Macro Econ Exam 1
1/104
Earn XP
Description and Tags
Vocabulary/Concepts for Samuel Le's Marco Economics Class at Green River Community College in preparation for week 1-5 midterm test. Textbook is Economics by Dean Karlan, Jonathan Morduch
Name | Mastery | Learn | Test | Matching | Spaced | Call with Kai |
|---|
No study sessions yet.
105 Terms
Economics
Study of how people manage resources
Microeconomics
the study of how individuals and firms manage resources
Macroeconomics
the study of the economy as a whole and how policy-makers manage the growth and behavior of the overall economy. Focuses on economic growth, unemployment, inflation. Talks about consumption, production, and prices in the aggregate and their effects at a national level.
Rational Behavior
When people make choices to achieve their goals in the most effective way possible given the resources they have
What 4 Questions do Economists ask when faced with a problem?
What are the wants and constraints of those involved in
What are the trade-offs?
How will others respond?
Are resources being allocated in the best way possible?
Scarcity
The condition of wanting more than we can get with available resources.
People want a lot of things but they are constrained by the limited resources.
Poverty
An income level below a certain standard based on the local economy.
Cost
What you give up, sacrifice
Investment
What you put in to generate a future benefit
Opportunity Cost
The value to you of what you have to give up in order to get something; the value you could have gained by choosing the next-best alternative
Marginal Decision Making
The idea that rational people compare the additional benefits of a choice against the additional costs without considering related benefits and costs of past choices
Sunk Cost
A cost that has already been incurred and cannot be recovered or refunded. Sunk costs should not have any bearing on your marginal decision about what to do next.
Incentive
Something that causes people to behave in a certain way by changing the trade-offs they face
(Positive) Incentive
Makes people more likely to do something
Negative Incentive (disincentive)
Makes them less likely to do something
Efficiency
Use of resources to ensure that people get what they most want and need given the available resources.
Resource
Anything that can be used to make something of value. When the economy is efficient resources are being used to create the greatest total economic value to society. From natural (ex; water and trees) to human resources (ex; talent and knowledge)
First 3 Economist Questions
Under normal circumstances, individuals and firms will act to provide the things people want. If not ask the first three economist questions:
have you misjudged people’s wants and constraints?
Have you miscalculated the trade-offs they face?
Have you misunderstood how people will respond to incentives?
Examples of Abnormal Circumstances
Innovation - explanation you’re hoping is correct. Your idea has not been used yet because it is too new.
Market Failure - People and Firms fail to take advantage of opportunities because something prevents them from capturing the benefits of the opportunity or imposes additional costs on them.
Intervention - if a powerful force—often the government—intervenes in the economy.
Unprofitable Idea - Idea won’t produce a profit. Individuals and governments have goals other than profit.
Correlation
When two variables have a consistent relationship
Positive Correlation
Both variables tend to move in the same direction
Negative Correlation
Two variables move in opposite directions
Uncorrelated
No consistent relationship between two variables
Causation
One variable causes the other making it appear that a casual relationship exists.
Correlation and Causation
Correlation and causation can be confused in 3 major ways
coincidence
omitted variables — two events may be extremely correlated due to a third event causing the two
reverse causation
Model
A simplified representation of a complicated situation.
A good model:
predicts cause and affect
States assumptions clearly
Describes the real world accurately
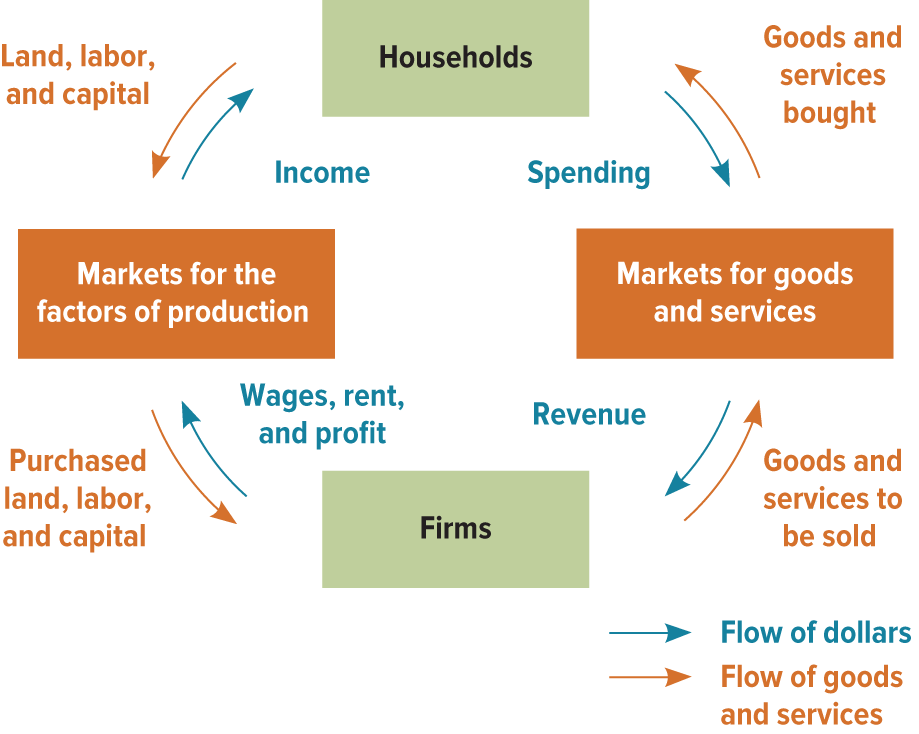
Circular flow model
—Houses supply land and labor to firms (+invest in capital firms) buy goods and services
—Firms do the opposite. Buy/rent land, labor, and capital supplied by households. Produce and sell goods and services.
—One is a loop of inputs and outputs.
Inputs: land, labor and capital firms use to produce goods. Outputs: Goods and services that firms produce using the factors of production
Market for/Factors of Production
Land, labor, capital. Households supply land, labor, capital and firms hire and purchase or rent these inputs.
Market for goods and services
All activity involved in buying goods in services. Households spend wages from labor and income from land and capital. firms earn revenue from selling their goods and services.
Positive Statement
Statement that makes a factual claim about how the world actually works.
Normative Statement
A statement that makes a claim about how the world should be.
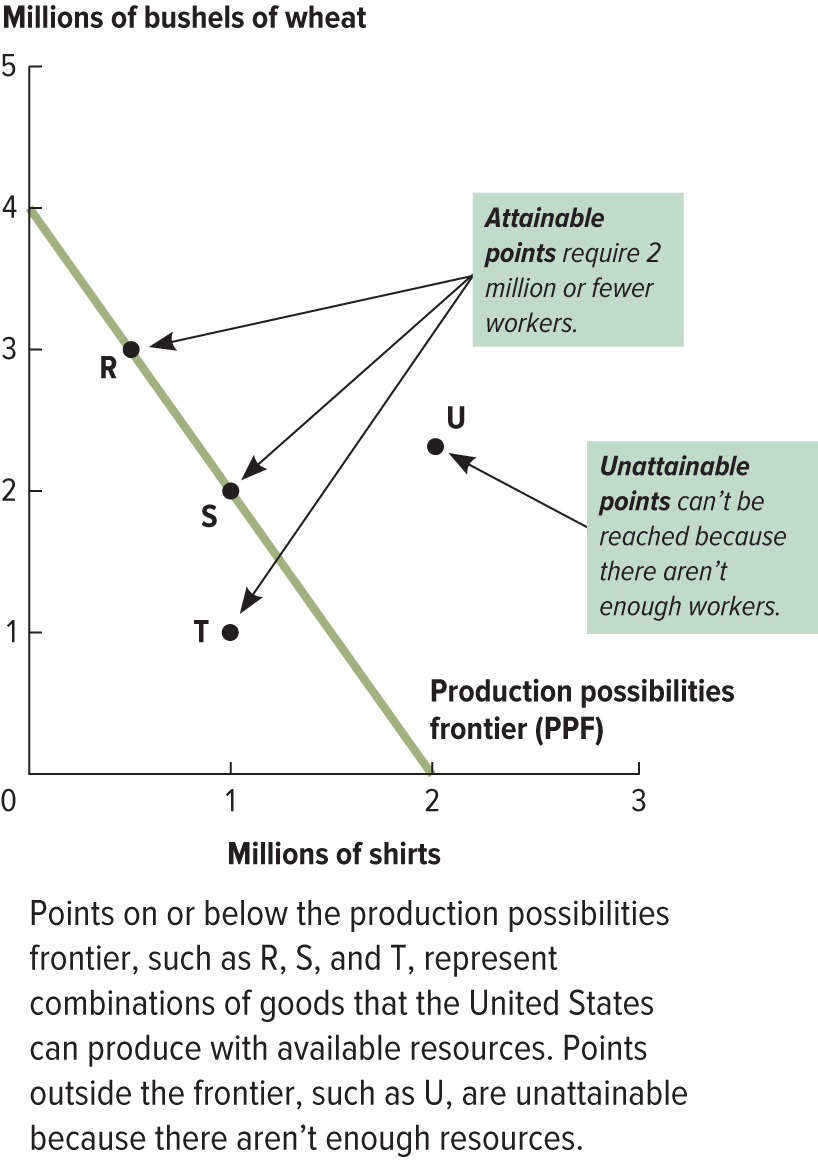
Production Possibilities Frontier (PPF)
A line or curve that shows all the possible combinations of two outputs that can be produced using all available resources.
Helps answer “What are the wants and constraints of those involved” and “What are the trade offs?”
Points that line on the line are efficient, outside are not possible, within inefficent
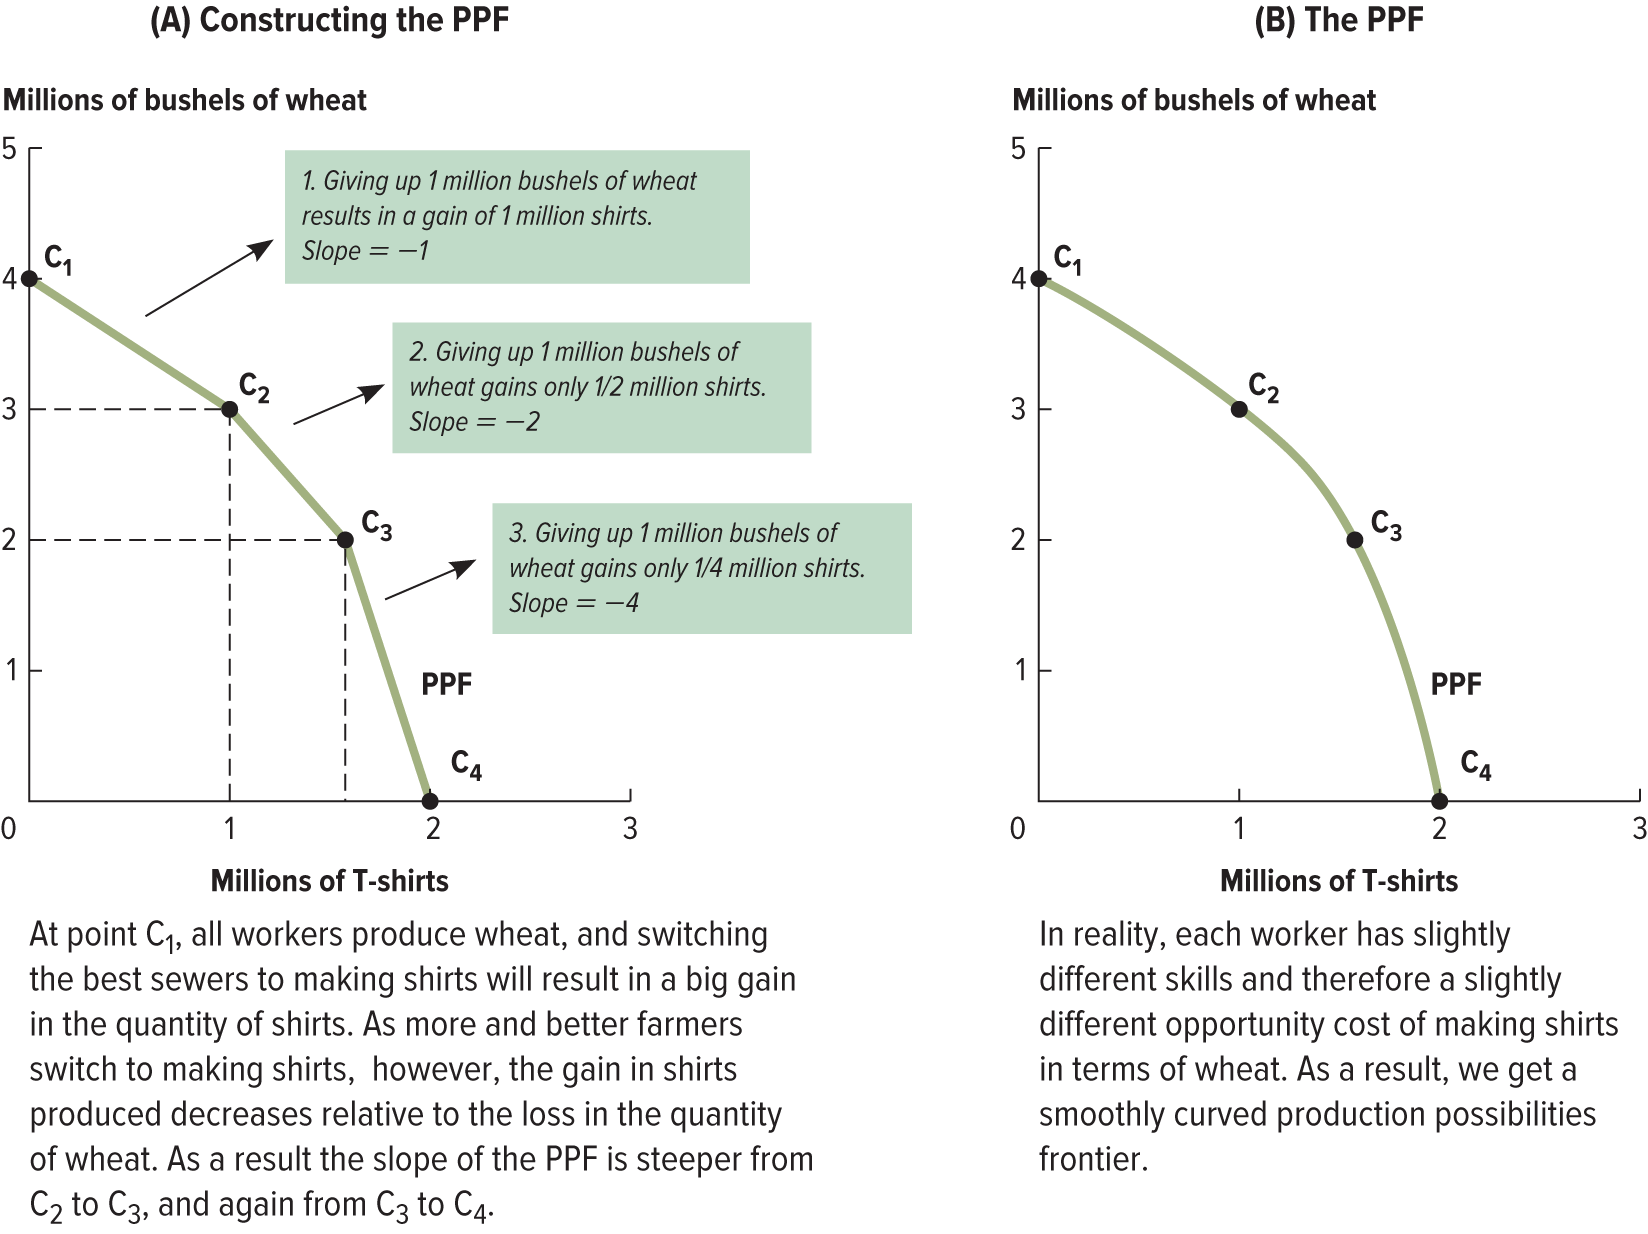
Convex PPF
The increased opportunity cost creates a curve that bows out (a concave curve instead of a straight line). Each point represents the opportunity cost of getting more wheat or more shirts based on the skills of the next worker who could switch.
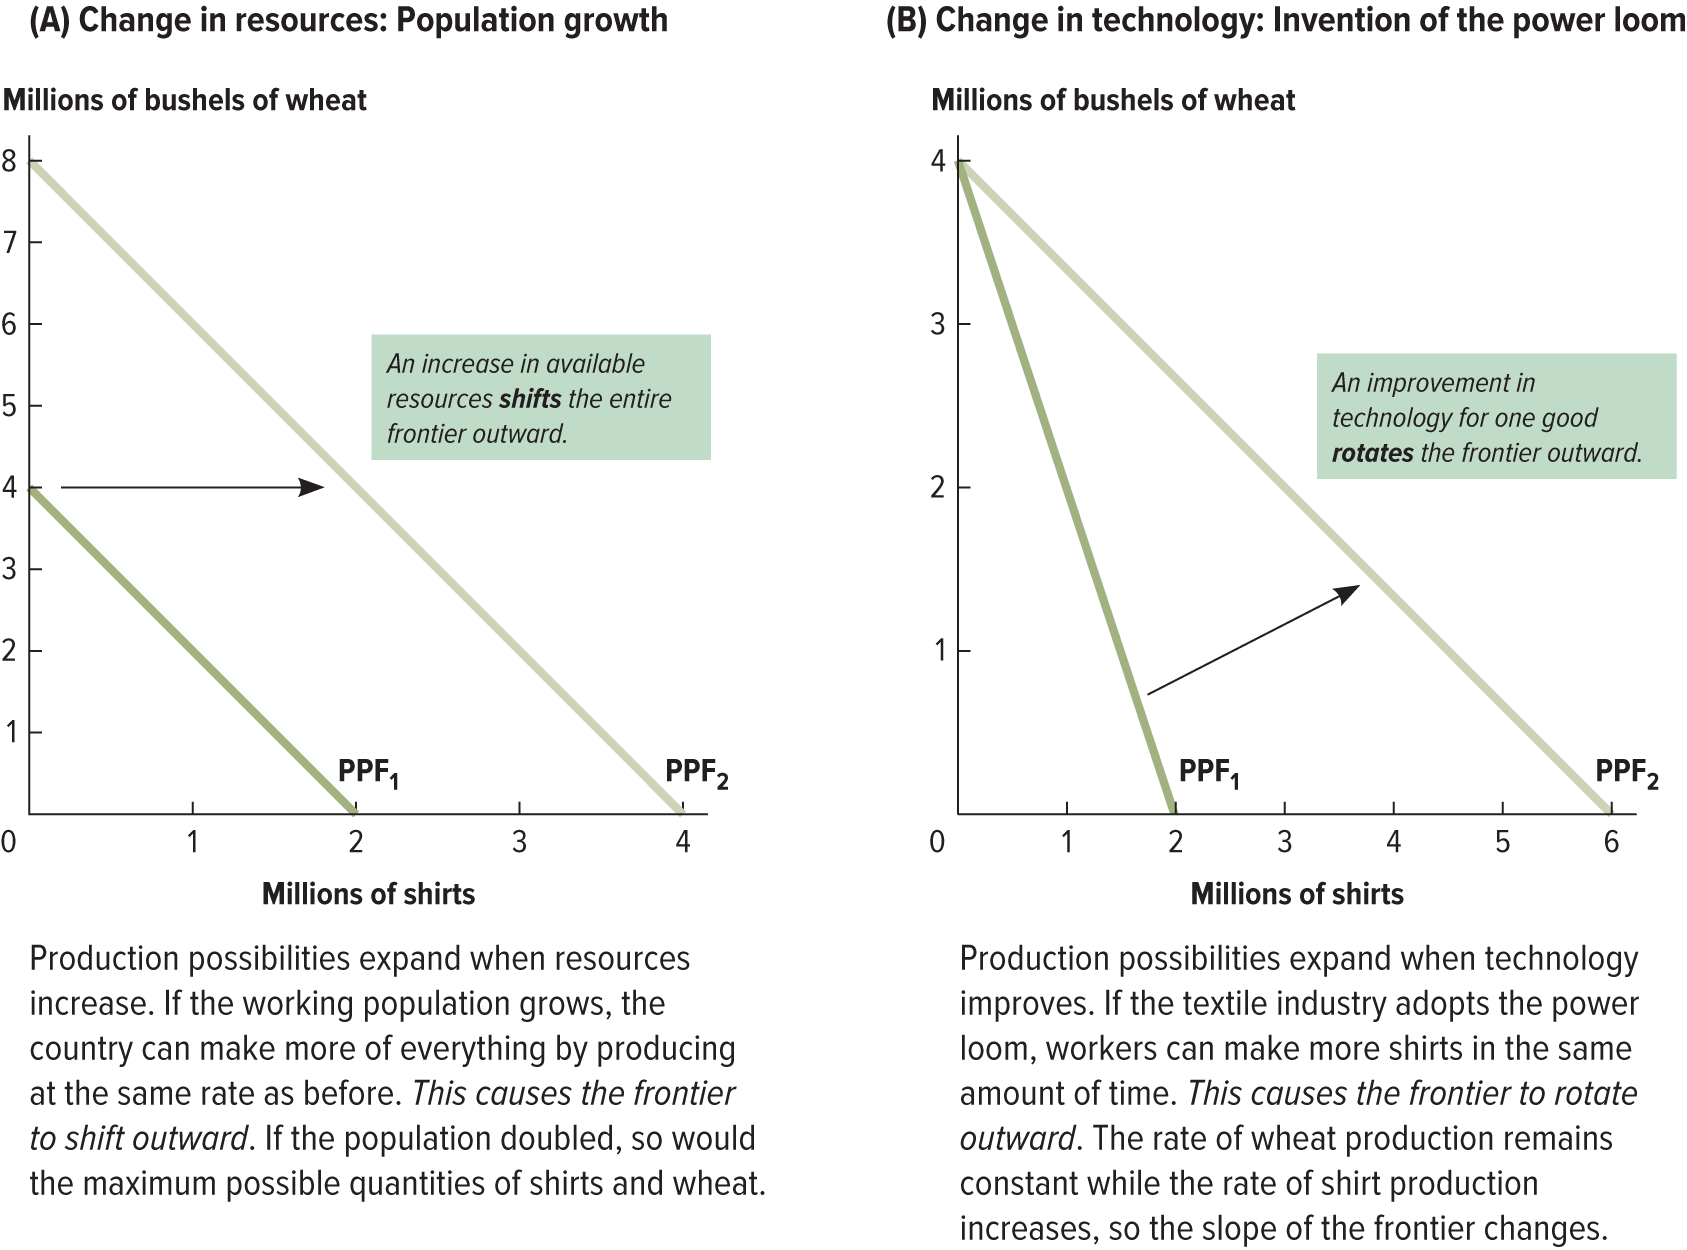
Shifting the PPF
In the United States economy, the factors that change its PPF
Number of workers (shifts the entire frontier outward)
Changes in Technology (improvement rotates it outward)
Absolute Advantage
A producer generating more output than another with a given amount of resources.
Comparative Advantage
When a producer can make a good at a lower opportunity cost than another producer. It is mathematically impossible for one country to have a comparative advantage at producing both goods
Specialization
Practice of spending all of your resources producing a particular good in which an entity has a comparative advantage. This increases total production using the same number of works and tech.
Gains from Trade
The Improvement in outcomes that occurs when specialized producers exchange goods and services.
Overall there is room for trade as long as:
The 2 Countries differ in their opportunity to produce a good
They set a favorable trading price
Invisible Hand
No government intervention is required to coordinate production. Thought of by Adam Smith.
National Income Accounting
System created by Simon Kuznets and Richard stone which adds up all economic activity to arrive at an overall value for the economy without double-counting items by ignoring the price of intermediate goods and services (goods and services used only to produce something else)
Gross Domestic Product (GDP)
Sum of the market values of all final goods and services produced within a country in a given period of time. Typically at a quarterly basis (US)
Regardless of how we calculate it
National Production = National Expenditure = National Income
Gross National Income/ Gross National Product (GNI/GNP)
Value produced by all companies of a nationality regardless of location.
Expenditure Approach
1/3 ways to measure GDP which highlights the importance of consumer spending versus government purchases. One way of calculating the GDP is adding up all the money people spend buying final goods and services.
Consumption (C) + Investment (I) + Government Purchases (G) + Net Exports (NX) =total expenditure = total production
Income Approach
2/3 ways to measure GDP. It emphasizes information about the relative importance of different factors of production. Every transaction has a buyer and a seller. Therefore we can measure GDP by adding up everyone’s income.
wages earned by workers
interest earned on capital investments
rents earned on land and property
profits earned by firms
National Income = Wages + Interest + Rental Income + Profits
In an economy without imports or export… this will equal the total we get using the expenditure approach.
Value-added Approach
Look at all transaction only counting the value they add to the economy. Especially useful for tracking how goods are sold and resold.
Consumption (C)IGNX
Measure spending on new goods and services by private individuals and households. Rent and college tuition is also included.
Investment C(I)GNX
Spending on new productive inputs such as factories, machinery, inventories (capital goods). Newly built houses are included in this.
Government Purchases CI(G)NX
Technically government consumption expenditures and gross investment.
Goods and services bought by all levels of government.
DOES NOT COUNT TRANSFER RESOURCES TO INDIVIDUALS (ex; Social Security)
Net Exports CIG(NX)
value of goods and services produced domestically and consumed abroad - services produced abroad and consumed domestically.
Real GDP
GDP calculation in which goods and services are valued at constant prices (given for a specific year). Real GDP isolates changes in an economy’s ouput.
Nominal GDP
Reported GDP without controlling for price changes. Calculated based on goods and services valued at current prices. Nominal GDP encompasses changes in both output and prices.
GDP Deflator
Measure of the overall change in prices in an economy.
(Nominal GDP / Real GDP) x 100 = GDP Deflator
Base year is always equal to 100.
If prices have risen answer will be x > 100
if prices have fallen, a year before the base year (~when prices are lower) x < 100
GDP Inflation Rate Equation
[ Deflator(year 2) - Deflator(year 1) / Deflator (year 1) ] x 100 = Inflation rate
GDP growth rate
[ GDP(year 2) - GDP(year 1) / GDP(year 1) ] x 100 = Growth Rate
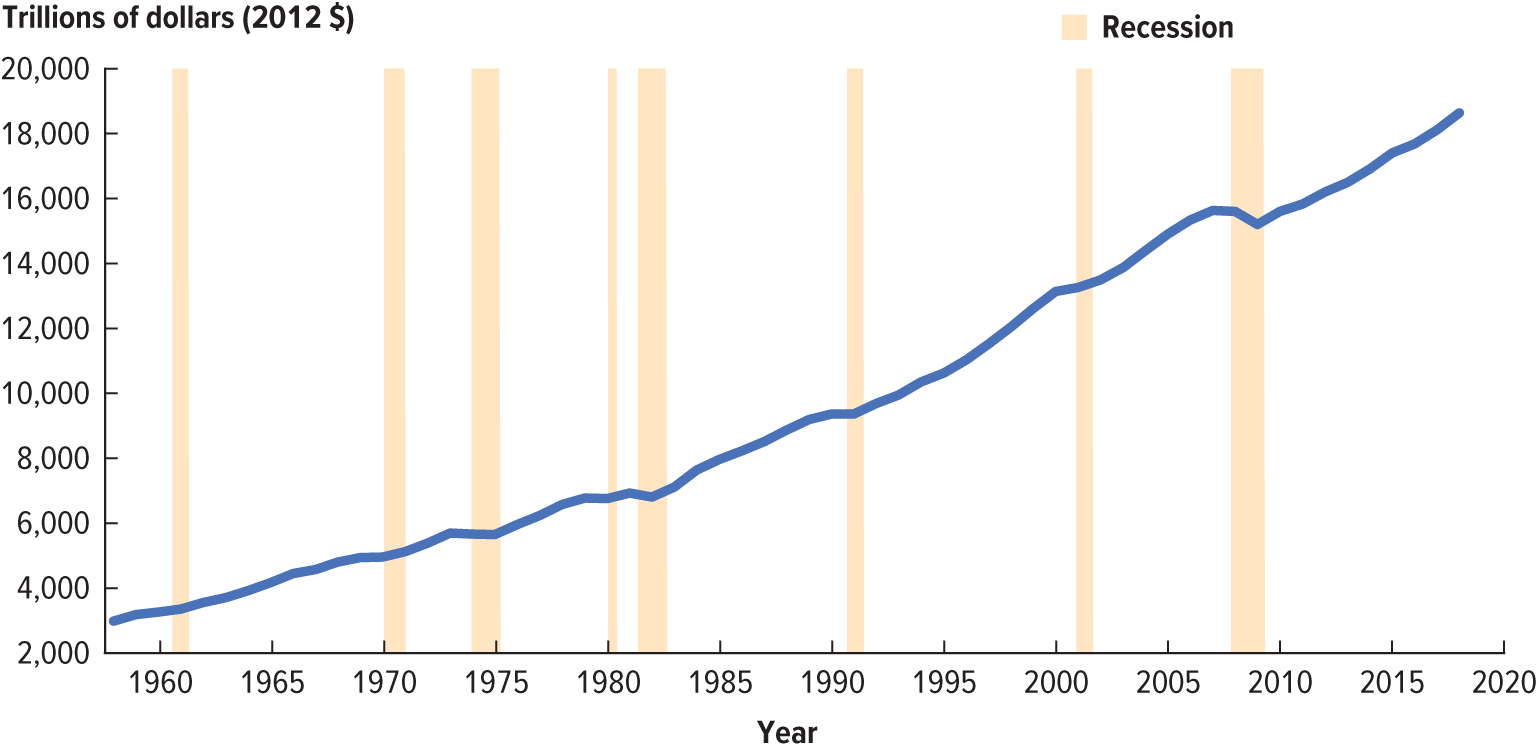
Recession
A period of significant decline in economic activity. A recession is typically marked by falling GDP, rising unemployment, and an increase in bankruptcies.
Years highlighted show recessions.
Depression
An extended or severe recession. Depressions and Recessions are officially determined by the National Bureau of Economic Research (NBER)
GDP per capita
Country’s GDP divided by population.
Home production
Goods and services produced and consumed within one household. Not part of GDP
Underground Economy
Goods and services sold below radar; outside of official records
Subdivisions of the underground economy are Black Market (sale of illegal goods and services)
Gray Market - legal economic transactions not reported to the government
Green GDP
Alternative measure of GDP that subtracts environmental costs of production from positive outputs normally counted in GDP.
Market Value
When expressing goods and services in a common unit they measure by this
Negative Externality
Products that harm people but don’t get counted in production or expenditure measures.
Life Satisfaction Index
Employed expansion of GDP per capita as a measure of well-being and happiness
The Market Basket
List including specific goods and services that roughly correspond to a typical consumer’s spending
Formula for calculating percentage change
[x2-x1/x1]100
Basket Approach
Changes in the cost of your shopping basket assuming you by the same items in the same quantities.
Price Index
Measure the cost of a market basket has risen/fallen relative to the cost in a base time period/location
Consumer Price Index (CPI[U])
Tracks changes in the cost of living in the United States by the cost of a basket of goods and services purchased by a typical U.S. household calculated by the Bureau of Labor Statistics (BLS).
CPI = [ cost of desired-year basket in base year prices/cost of base year basket in base year prices ] x 100
Based on urban consumers (93% of US population)
Changes in CPI over time
Substitution
Idea that people switch similar goods and services when relative prices shift.
Innovation
New goods and services become available people change what they consume.
Undermines constant basket of goods and services. Aim overall is to achieve a certain standard of living.
Hedonic quality adjustment
Break a product into a list of features then determine how much utility consumers get from each feature to determine how these features influence well-being. This allows us to estimate what the price of the good would be without improved quality.
Inflation Rate (CPI)
Inflation rate = percent change in CPI from year to year
Inflation rate = [CPIyear2-CPIyear1/CPIyear1] x 100
Headline Inflation
Measures price changes for the entire market basket of the average urban consumer. Another term for inflation measured using CPI
Core inflation
Measures price changes minus food and energy costs due to the high fluctuations in price.
Producer Price Index (PPI)
Measures the prices of goods and services purchased by firms. PPI is a good predictor of future consumer prices.
GDP Deflator
Measures price changes for everything in the country doesn’t include goods produced abroad and uses actual quantities produced in the economy each year rather than a fixed basket of goods.
Equation to Convert From the Past to Current Value
Real value(year Y) = nominal value(year x) x (CPI year Y/ CPI Year X)
Indexing /Index to inflation/cost-of living adjustments COLAs
Practice of automatically increasing payments in porportions to the cost of living
Purchasing Power Parity (PPP)
Idea that purchasing power should be the same everywhere when stated in a common currency. In reality PPP never holds exactly. Due to
Transaction Costs
Non-tradeables
Trade Restrictions
International Comparison Program (ICP) Index
ICP Main measure that economists use for international price comparisons by the World Bank that represents the cost of living across countries.
PPP-adjusted GDP Equation
PPP-adjusted GDP = nominal dollars(country A) x (1/1-price level adjustment(countryA))
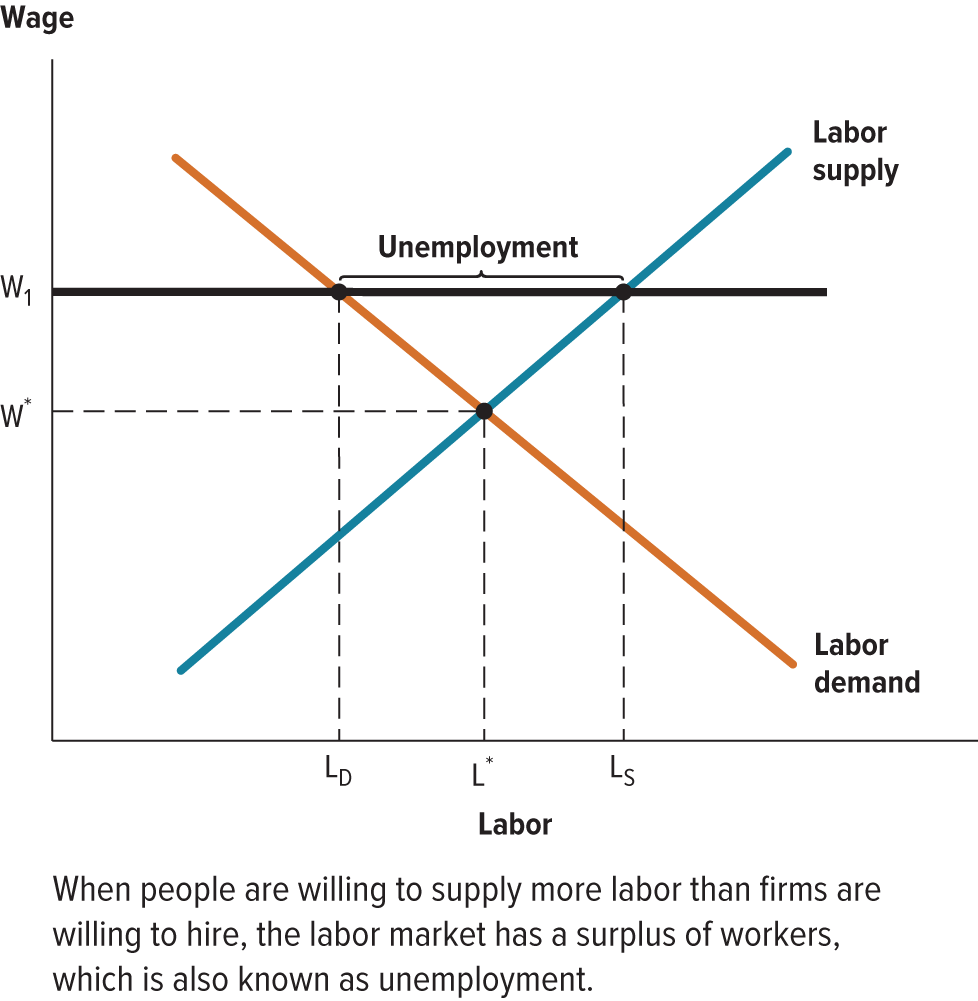
Unemployment
Situation in which someone wants work but is unable too in the current market. When the quantity of labor supplied at the prevailing wage is greater than the quantity of labor demanded (There is a surplus of labor) and meet these three criteria:
They didn’t work at all in the prior week.
They were available to work if they had been offered a job.
They were making efforts to look for a job.
This excludes full-time students, stay at home parents, people disabled to the point of unable to work, people who inherit wealth and choose not too, retirees
Unemployment is a sign of inefficiency and has serious social and psychological consequences.
Regardless of age anyone who works over 15+ hours a week is employed
An increase of unemployment is typically followed by an increase in enrollment of higher education to increase job prospects.
Labor Force
Anyone in the working age 16+ regardless of employment status and who isn’t:
Retired (~64 retirement age)
Institutionalized
Military
EMPLOYED + UNEMPLOYED = LABOR FORCE
Unemployment Rate Equation
[ # of unemployed / labor force ] x 100
Labor-force participation rate
[labor force / working-age population] x 100 = LFPR
typically falls during recessions
Discouraged Workers
People who have looked for work in the past year but have given up looking because of the condition of the labor market
Underemployed
Workers who are either working less than they would like or are working in jobs below their skill level.
Phantom unemployment
People who claim to be looking for work but aren’t in reality
BLS’s 6 measures of unemployment
The Bureau of Labor Statistics collects these stats from ~60,000 households monthly
U1. Counting only people who have been unemployed for a long time (15+ weeks)
U2. U1 in addition with those who have recently lost their jobs or done temporary work
U3. The official unemployment rate.
U4. Unemployed and discouraged workers
U5. Unemployed, discouraged workers, marginally attached workers
U6. Unemployed, discouraged workers, marginally attached workers, underemployed
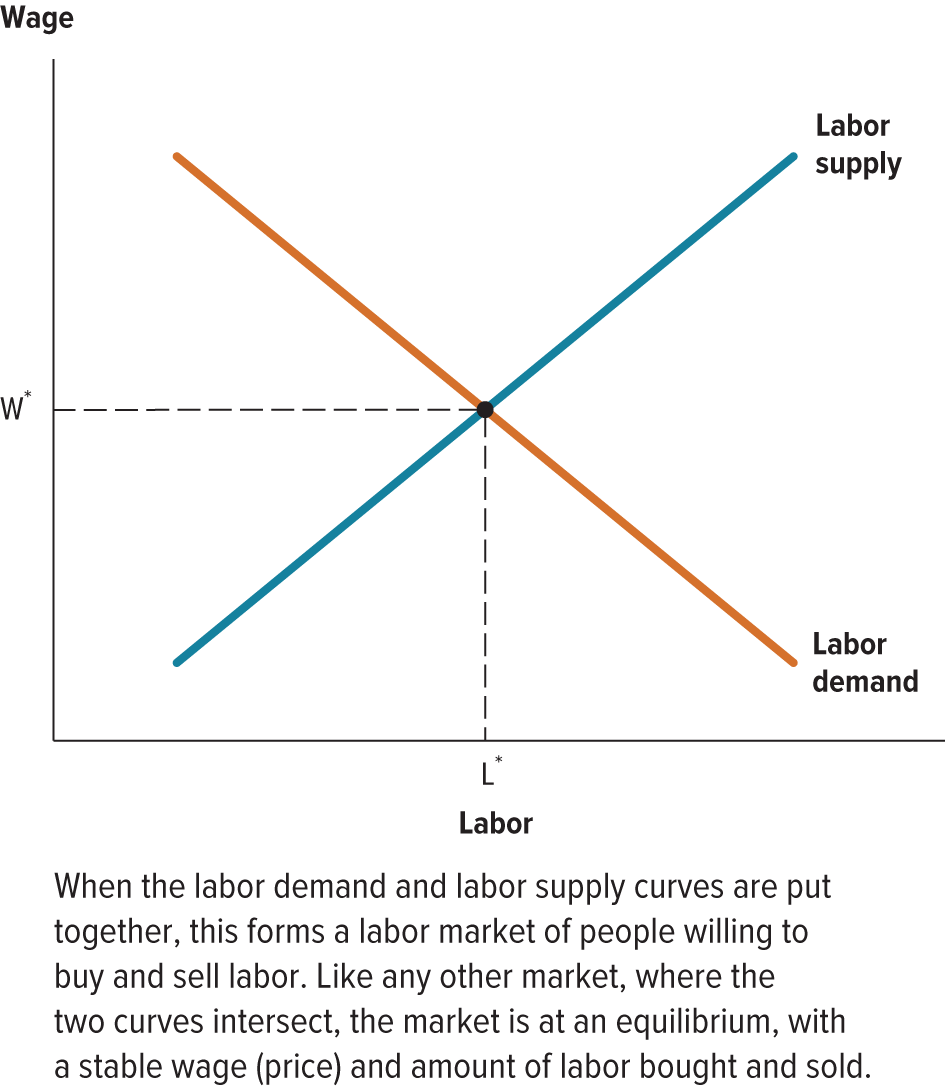
Equilibrium in the Labor Market
Labor is bought/sold like any service/good.
Wage = Price
Supply = unemployed
Demand = hiring
You’d expect the price to adjust until the market reaches equilibrium. Unemployment cannot be fully explained by a model.
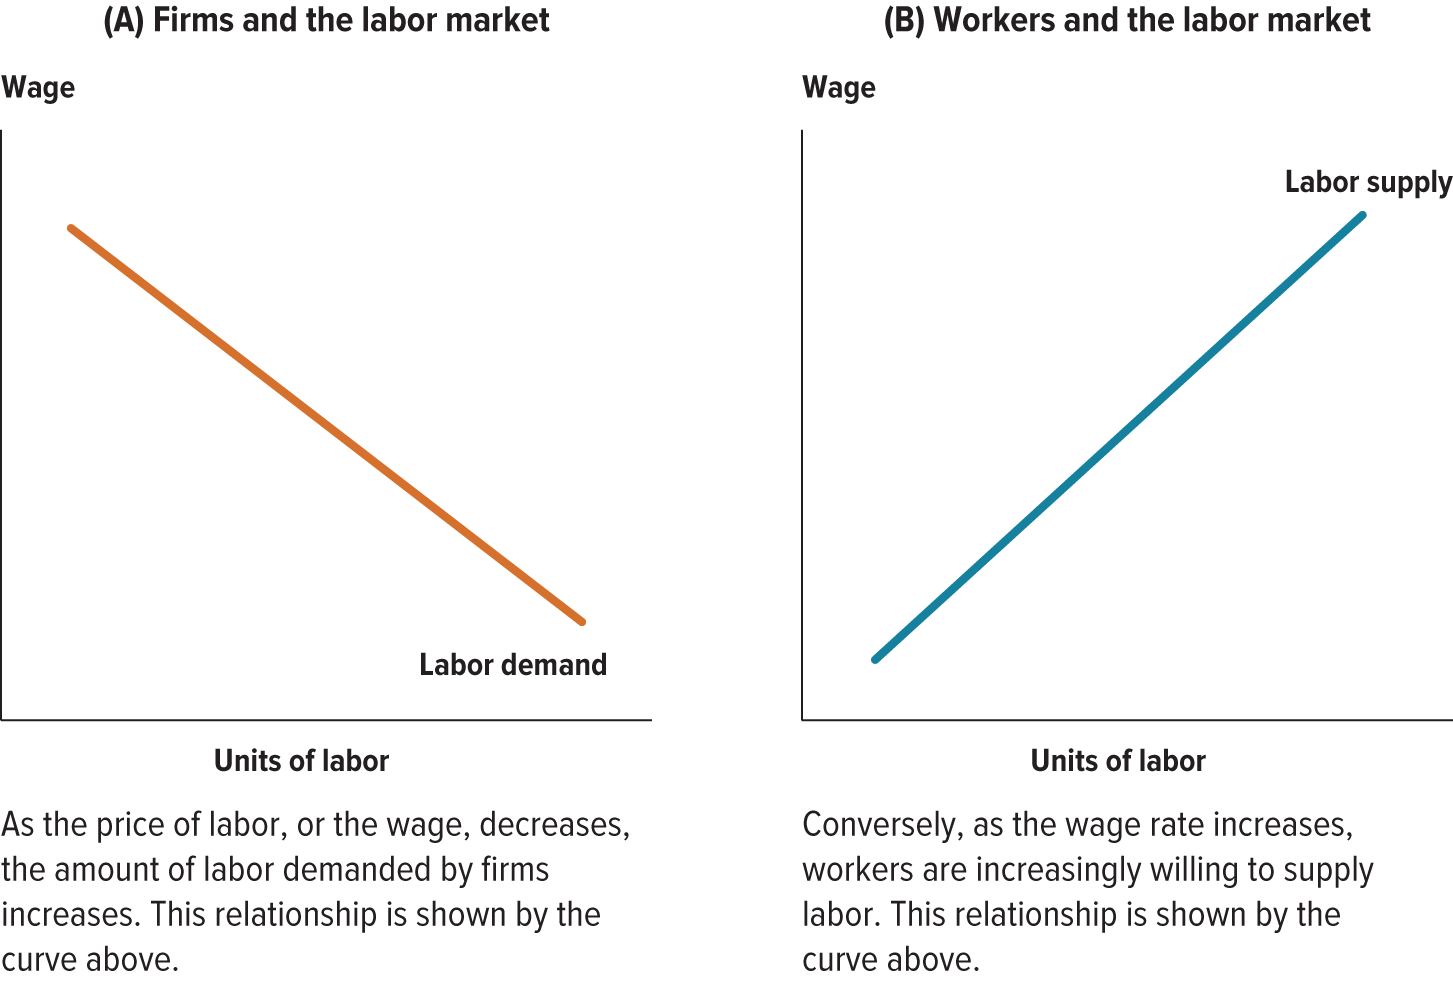
Labor Demand Curve
A graph showing the relationship between the total quantity of labor demanded by all the firms in the economy and the wage rate. Together these describe the national labor market
Natural rate of unemployment / equilibrium rate of unemployment
Normal level of unemployment that persists in an economy in the long run
Frictional Unemployment
Unemployment caused by workers who are changing location, job, or career. Some amount of this is unavoidable it’s natural and healthy, jobs open and close, ambitious people go seek better positions. Continue the job search.
Structural
Unemployment that results from a mismatch between the skills workers can offer and the skills that are in demand.
Vocational retraining is an appropriate response to this.
Real-wage (classical) unemployment
Unemployment that results from wages being higher than the market-clearing level. Explanations being:
Minimum wage laws
Bargaining from labor unions
Efficiency wages
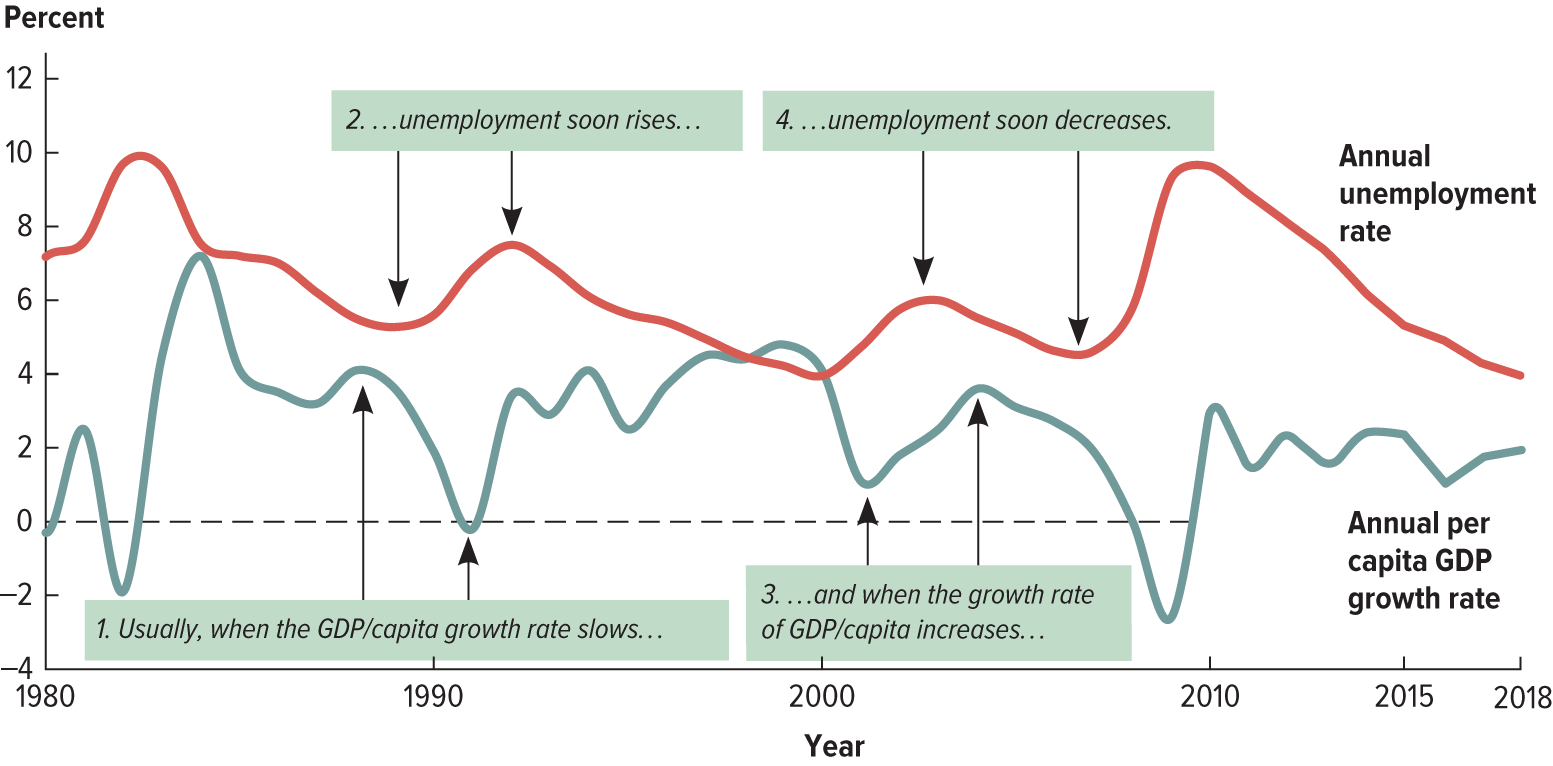
Cyclical Unemployment
Unemployment caused by short-term economic fluctuations. GDP tends to go in cycles so does employment.
Concept of sticky wages
Wages don’t simply fall, wages are slow to respond to shifts in the economy. Degree of stickiness is controversial. This time lag is called lagging/trailing indicator.
Wages tend to remain sticky due rigid employment contracts.
Lagging/trailing indicator
The slight delay in employers waiting to see how bad a recession looks by increasing/decreasing hours before laying off workers/hiring makes unemployment a lagging/trailing indicator. This is part of cyclical unemployment.
Minimum Wage
The lowest wage that a firm is legally allowed to pay its workers. The federal minimum wage is currently $7.25.
Supporters of it cannot agree where it should be set but argue that workers deserve a basic standard of living.
Opponents of the policy suggest that if the wage is higher than the equilibrium wage unemployment will rise. Research shows both. It does/change who is hired substituting workers for unskilled younger workers. AKA driving jobs “under the table”.
Nonbinding Minimum wage
When the minimum wage is set below the equilibrium level having no effect on employment.
Labor Unions
Groups of employees who join to bargain over salaries and working conditions. Their bargaining typically raises wages for the entire industry their employers wanting them to not join a union.
Current union participation is smaller than it was in the 1950s.