Lecture 9: Toxicity of mixtures (bioconcentration, biomagnification and bioaccumulation)
1/37
There's no tags or description
Looks like no tags are added yet.
Name | Mastery | Learn | Test | Matching | Spaced | Call with Kai | Chat |
|---|
No analytics yet
Send a link to your students to track their progress
38 Terms
Transfer from the environment to the site of action
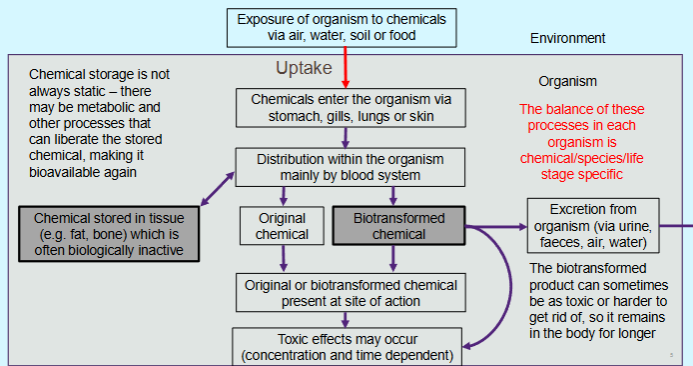
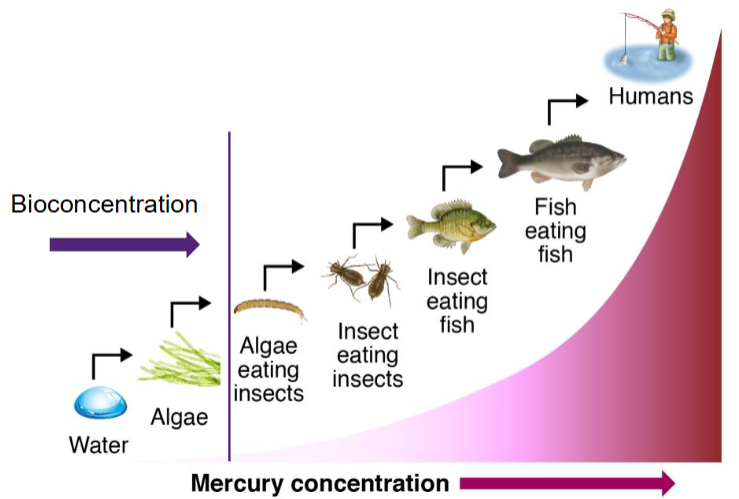
Bioconcentration
The uptake of chemicals from the surrounding (ambient) environment into organisms.
How does bioconcentration occur?
It is a partitioning process (there is continual movement in and out of the organism)
At equilibrium the rates of movement into and out of an object are equal so there is no change in the concentration
The internal concentration of a compound is greater than the external media (air, soil, water)
occurs when rate of uptake is greater than rate of excretion
will not occur if the rate of uptake is less or equal to rate of excretion
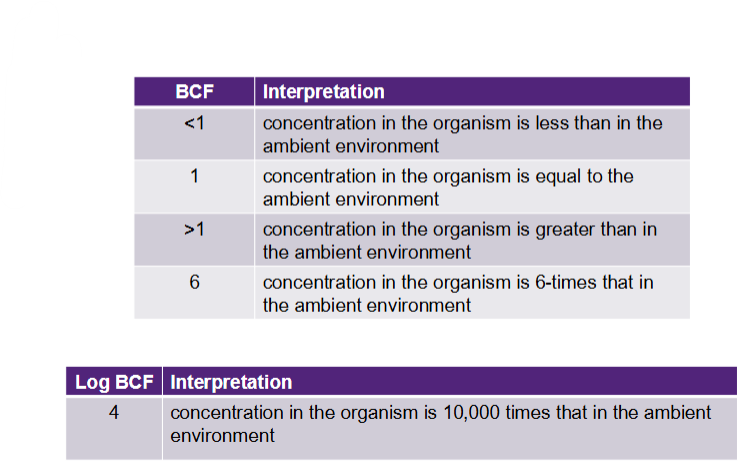
Bioconcentration factor
The ratio of a chemical in the organism to the ambient media once equilibrium has been reached or after specified duration:
BCF = Corganism/Cambient
*BCF values are often large and presented as log BCF values
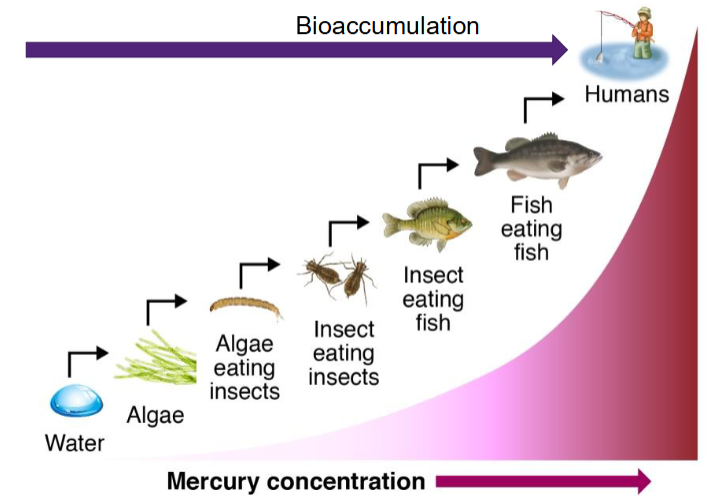
Biomagnification
The uptake of chemicals into an organism from its food.
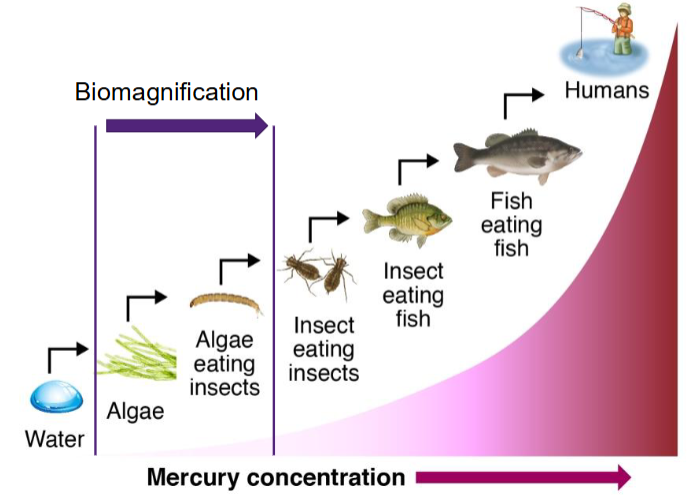
How does biomagnification occur?
The longer the food chain the greater the potential for biomagnification with increase in internal concentration with each step in the food chain
occurs when rate of uptake from food is greater than the rate of excretion
will not occur if the rate of uptake from food is less than or equal to the rate of excretion
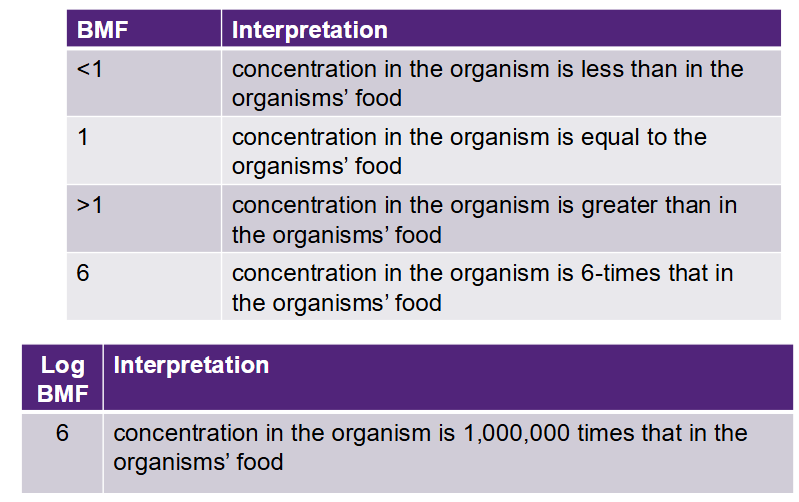
Biomagnification factors
The ratio of a chemical in the organism to the concentration in the food once equilibrium has been reached or after a specified duration:
BMF = Corganism/Cfood
*BMF values are often large and presented as log BMF values
Bioaccumulation
The uptake of chemicals into an organism from the ambient environment and/or food or any source
How does bioaccumulation occur?
Occurs when the rate of uptake from all sources is greater than the rate of excretion
Will not occur if the rate of uptake from all sources is less than or equal to the rate of excretion
Usually measured from field studies where it is difficult/impossible to separate the contribution from food and ambient environment
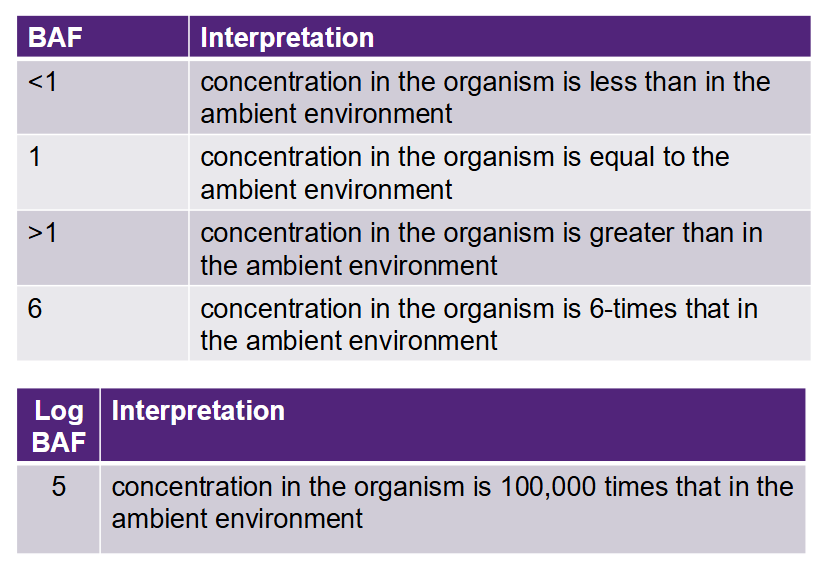
Bioaccumulation factors
The ratio of a chemical in the organism to the concentration in ambient environment once equilibrium has been reached or after a specified duration:
BAF = Corganism/Cambient
*BAF values are often large and presented as log BAF values
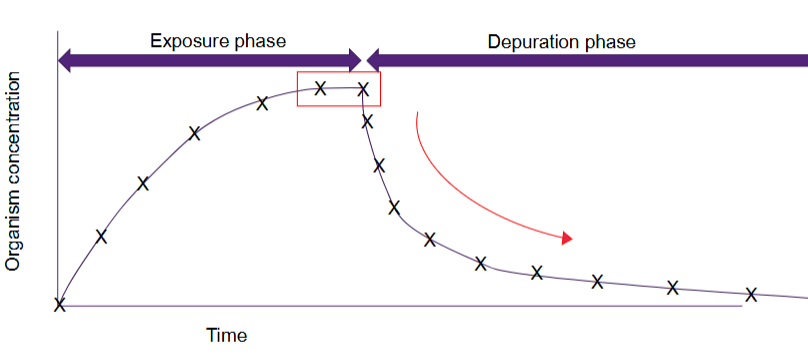
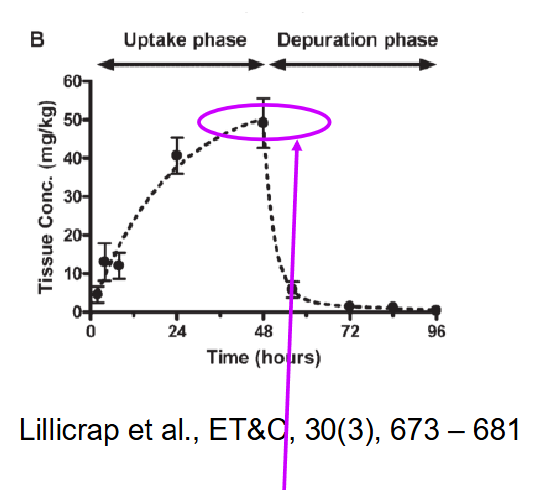
How to measure the BCF?
Exposure
expose organisms to > 2 text chemical concentrations and a control under flow through conditions
concentrations can be measure in fish and water until equilibrium or assigned time period ends
Post-exposure (depuration)
transfer organisms to water without test chemical
testing continues until concentration decrease by 95% or set time period has elapsed (i.e. twice a long as uptake phase)
Experimental design for uptake
Design for bioconcentration
test chemical is in water
Design for biomagnification
test chemical is in the food
food introduced at a frequency to maintain organism health
Design for bioaccumulation
test chemical is in the water and food
Bioconcentration of sucralose
Sucralose is a low-calorie artificial sweetener
log KOW = 0.51
The finding was that sucralose does not bioaccumulate in aquatic organisms from different tiers of the food web
in this case, BCF was determined at 48 hours (equilibrium was not established)
However, it was found to bioaccumulate in adipose tissue of rats and was present two weeks after cessation of a 40-day feeding period
the first study had tested an insufficient time
Time-cumulative toxicity
Cumulative effects occur due to irreversible binding to target receptors
Toxicants may not accumulate in lipids, so BCF is usually low
It is difficult to test for in standard bioassay (requires extended duration)
One indicator is an acute-to-chronic ratio much higher normal
Effects are also noticeable at the population or ecosystem level
e.g. mesocosm studies
Imidacloprid binds to acetylcholinase receptors
Demonstrate time-dependant toxicity (TDT)
imidacloprid log BCF = 1.1
Uptake of contaminant occurs through exposure (dermis, gills)
binding > elimination (through gills or faecal matter)
As more receptors are bound, the aqueous concentration required to elicit a toxic effect reduces
Short recovery periods between pulses can have the same effect as constant exposure
Imidacloprid concentrations can stay elevated in the GBR catchment area for months at a time
Imidacloprid SSD (standard approach)
Toxicity data from acute toxicity tests of ~4 days exposure
longer durations are not available due to logistical and financial constraints on bioassay design
Guidelines will not protect ecosystems if organisms are exposed to a chemical for months (cumulative effects)
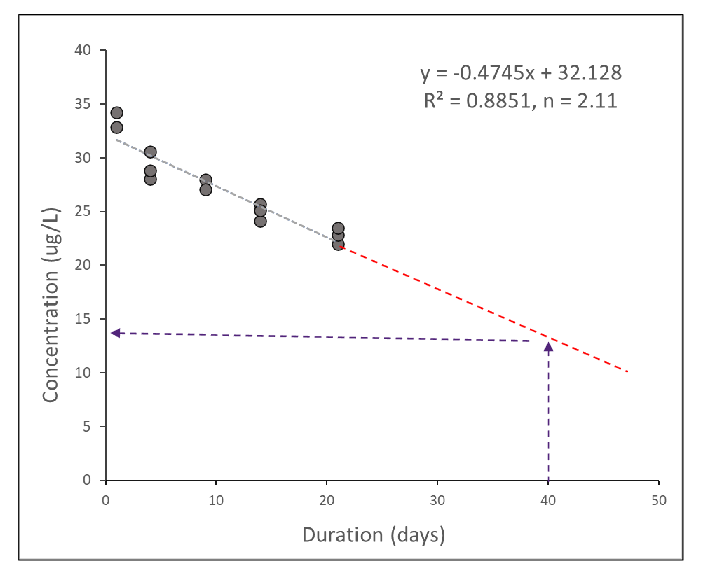
Linear regression as a solution to time constraint
A linear fit can be obtained using log of the two variables:
ln(Time) = α + β ln(Concentration)
α = model intercept
β = slope
These relationships can be used to calculate the effect concentration for the required toxicity measure (e.g. EC50) at the require time point (e.g. 100 days)
Temporal adjustment factor as a solution
Temporal adjustment factor (TAF) is calculated by dividing the modelled Effect Concentration (EC) on day x by the measured EC on day Y:
TAF = EC (modelledx)/ EC(measuredy)
This is calculated separately for Brachiopoda, Insecta and Malacostraca models and applied to appropriate class of organism in SSD
Temporal Response Surface (TRS) application
Globally applicable
Method will work for any toxicant with TDT
Also works for bioconcentration and bioaccumulation
Can be applied before a chemical is registered for use so long as suitable data are available
Can be used for chemical management as well as probablistic risk assessment
Risk assessment is based on both concentration in the waterway, as well as the duration of ecosystem exposure
Pesticide mixtures
Pesticides rarely occur in isolation
pesticide mixtures present in < 82% of samples from GBR catchment between 2011 to 2016
Future pesticide usage
Pesticide market projected to grow to USD $97.01B by 2032
Largest growth in Asia Pacific
driven by crop pests and disease, high yield pressure, increased population and food insecurity needs
Mixtures, fate and persistence, effect quantification are emerging
policy and science are required to keep pace
Mode of action (MOA)
A common set of physiological and behavioural signs that characterise a type of adverse biological response. A human equivalent would be a syndrome (e.g. caffeine makes you feel more awake).
Mechanism of action (MeOA)
Refers to the specific biochemical processes and/or toxicant-biological interactions underlying a given mode of action (e.g. caffeine blocks adenosine receptors in the brain that signal sleepiness).
Interactive
The presence of a chemical affects the toxicity or uptake of another chemical
Non-interactive
The presence of a chemical does not affect the toxicity or uptake of another chemical
Additivity
When the toxicity of the mixture is equal to the sum of the
toxicity of each component acting individually (i.e. 1 + 1 = 2).
Mixture toxicity of chemicals
It is concluded that irrespective of the mode of action of the components in the mixtures that:
~70-80% of mixtures exert additive toxicity
~10-15% of mixtures are synergistic
~10-15% of mixtures are antagonistic
While ~30% of mixtures are antagonistic or synergistic the deviation from additive models is generally not large
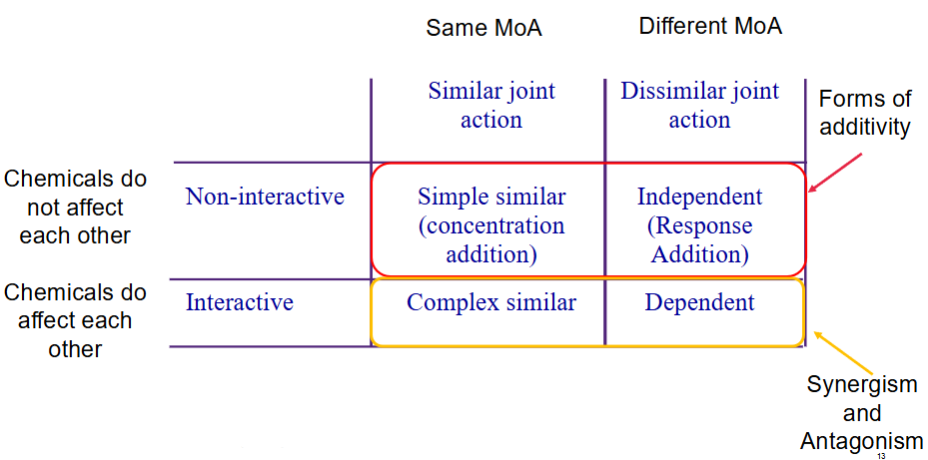
Types of additive toxicity
Concentration addition (CA) or simple similar action
Ca usually higher estimate of toxicity than IA
Response addition or independent action (IA)
IA usually lower estimate of toxicity than Ca
Types of joint action for mixtures
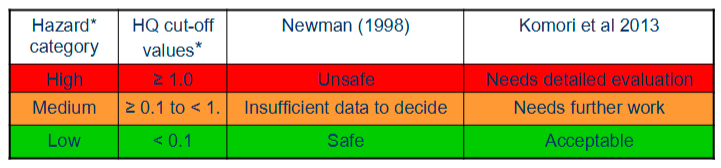
Hazard Quotient method (individual toxicants)
Hazard assessment is often conducted using the Hazard Quotient method (Risk Quotient):
HQ = maximum aqueous conc/ minimum aqueous toxicity
This is the ratio of a concentration to a suitable measure of toxicity
Chemicals are then assigned a hazard category based on the HQ values
If RQ = 10 it means the concentration in the sample is 10 times larger than the WQG
it does not mean the biological effect is 10 times worse
the relationship between concentration and toxicity is not linear but sigmoidal
Dealing with mixture toxicity in AUS/NZ WQGs
Uses the Concentration Addition (CA) model of joint action
The total toxicity of mixtures (TTM) is calculated by:
TTM = Σ(Ci / DGVi)
Ci is the concentration of the ‘i’th toxicant in the mixture
DGVi is the guideline for that toxicant
If the TTM exceeds 1, the mixture has exceeded the water quality guideline value for that mixture
if all DGVs are for protection of 95% of species in the ecosystem, then the combined effect is unlikely to protect the ecosystem to this level, even though the individual impacts are all < 1
Hazard and risk assessment
Both attempt to assess whether environmental harm is, has or will happen
Hazard assessment is deterministic (yes/no)
tier I risk assessment (e.g. RQ or TTM for first look)
Risk assessment is probabilistic (% chance % effect)
tier II risk assessment (provide more comprehensive info)
Both can be:
retrospective (assessing previous exposure)
prospective (assessing future/potential exposure)
Both are part of a continuum
Probabilistic risk assessment for single toxicants
SSD method:
log-logistic distribution = 𝐹 (𝓍, 𝛼, 𝛽) = 1 − 1 / 1+𝑒𝑥𝑝 (𝑙𝑛𝑥−𝛼 / 𝛽)
Probabilistic risk assessment for mixtures
A probabilistic estimate can be obtained using the SSD method combined with Response Addition (RA):
PAFRA = 1 - Πi (1 - PAFi)
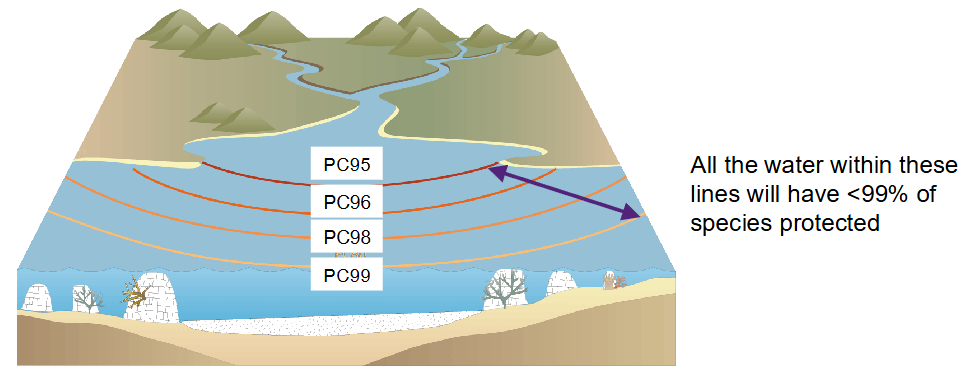
GBR as a HEV zone
If 99% of species are not protected at the river mouth there will always be a zone where < 99% of species are protected
this is a sacrificial zone
As the waterway water mixes with marine water the % of species protected increases
Pesticide Reduction Target is to protect > 99% of aquatic species from harmful effects of mixed pesticides at the mouth of waterways that discharge
to the GBR lagoon
Application to monitoring data
Average wet season risk to monitor magnitude and duration of exposure over time
temporal variability
Contribution to risk using land use mapping
spatial variability
Synergism
When the toxicity of the mixture is greater than the sum of the toxicity of each component acting individually (i.e. 1 + 1 = > 2)
Antagonism
When the toxicity of the mixture is less than the sum of the toxicity of each component acting individually (i.e. 1 + 1 = < 2)