STATS THE PAIRED SAMPLES T-TEST
1/17
Earn XP
Description and Tags
aka "Related Samples" or "Correlated Groups" t test
Name | Mastery | Learn | Test | Matching | Spaced | Call with Kai |
|---|
No analytics yet
Send a link to your students to track their progress
18 Terms
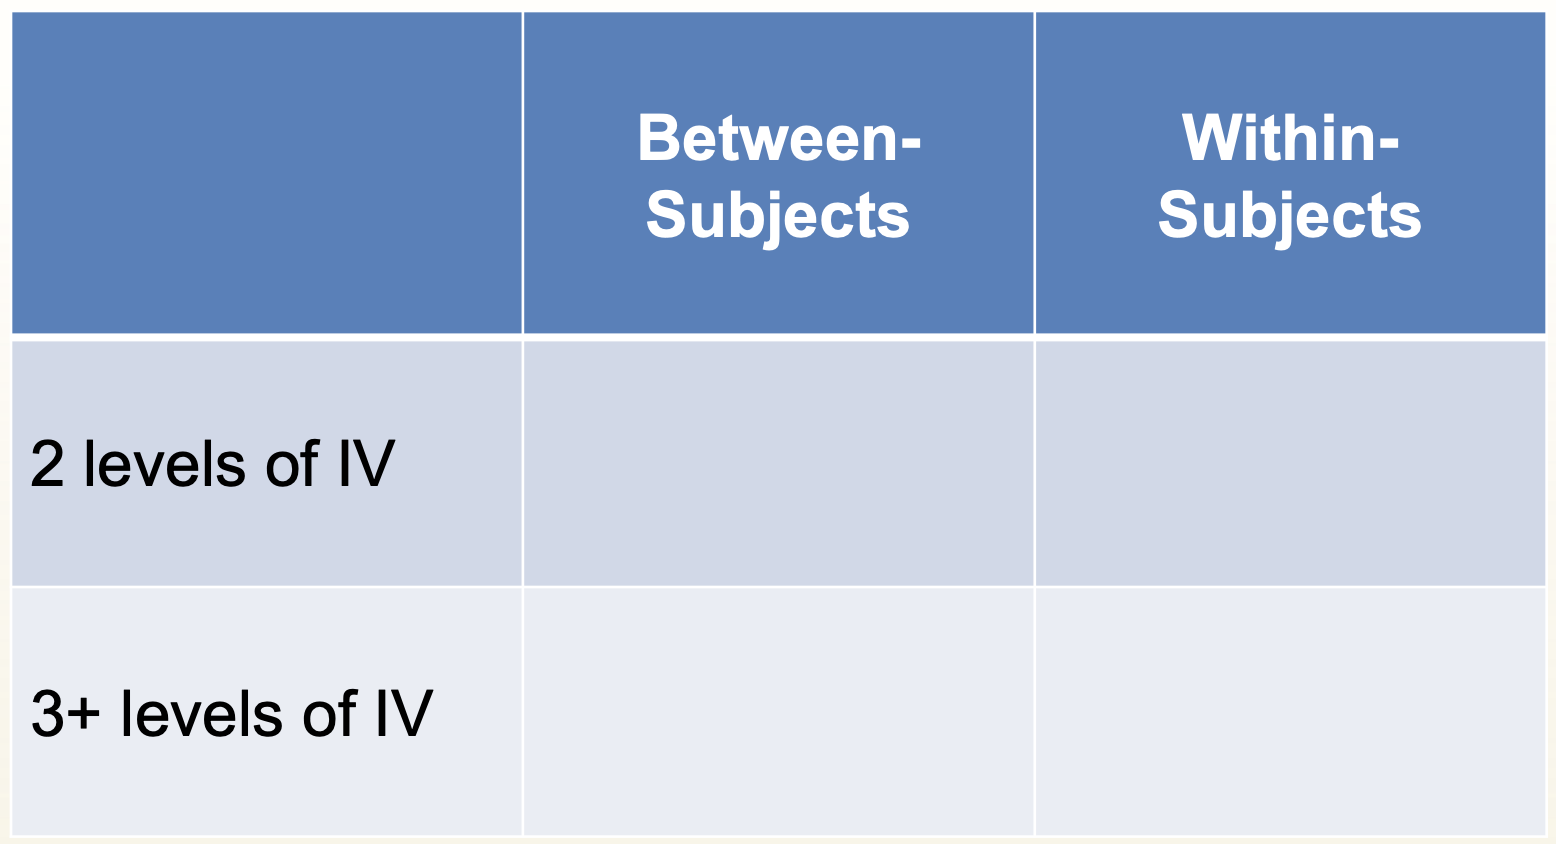
DV is… Fill out the table
Interval/ ratio
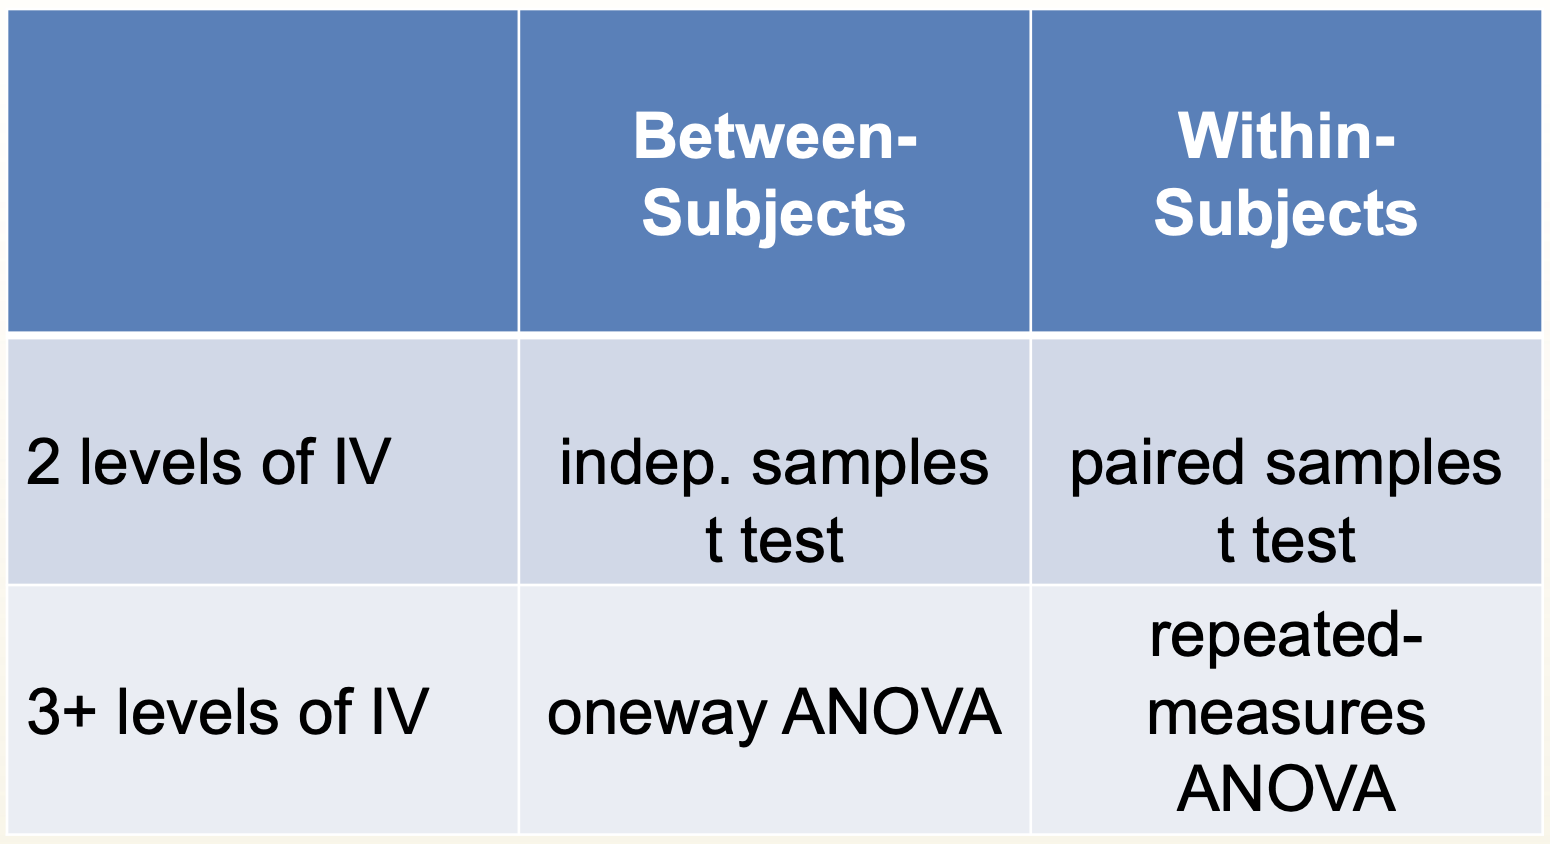
When do we use a Paired Samples t-test?
DV is interval/ ratio and…
Within-subjects (concurrent-measures or repeated-measures designs)
Natural pairs (examples)— looking for DIFFERENCES, not correlations
Are older siblings more conscientious than younger ones (in same family)?
Does one person in a couple have better memory for relationship events than their partner does?
Do brothers & sisters in the same family differ in how permissive they think their parent was with them?
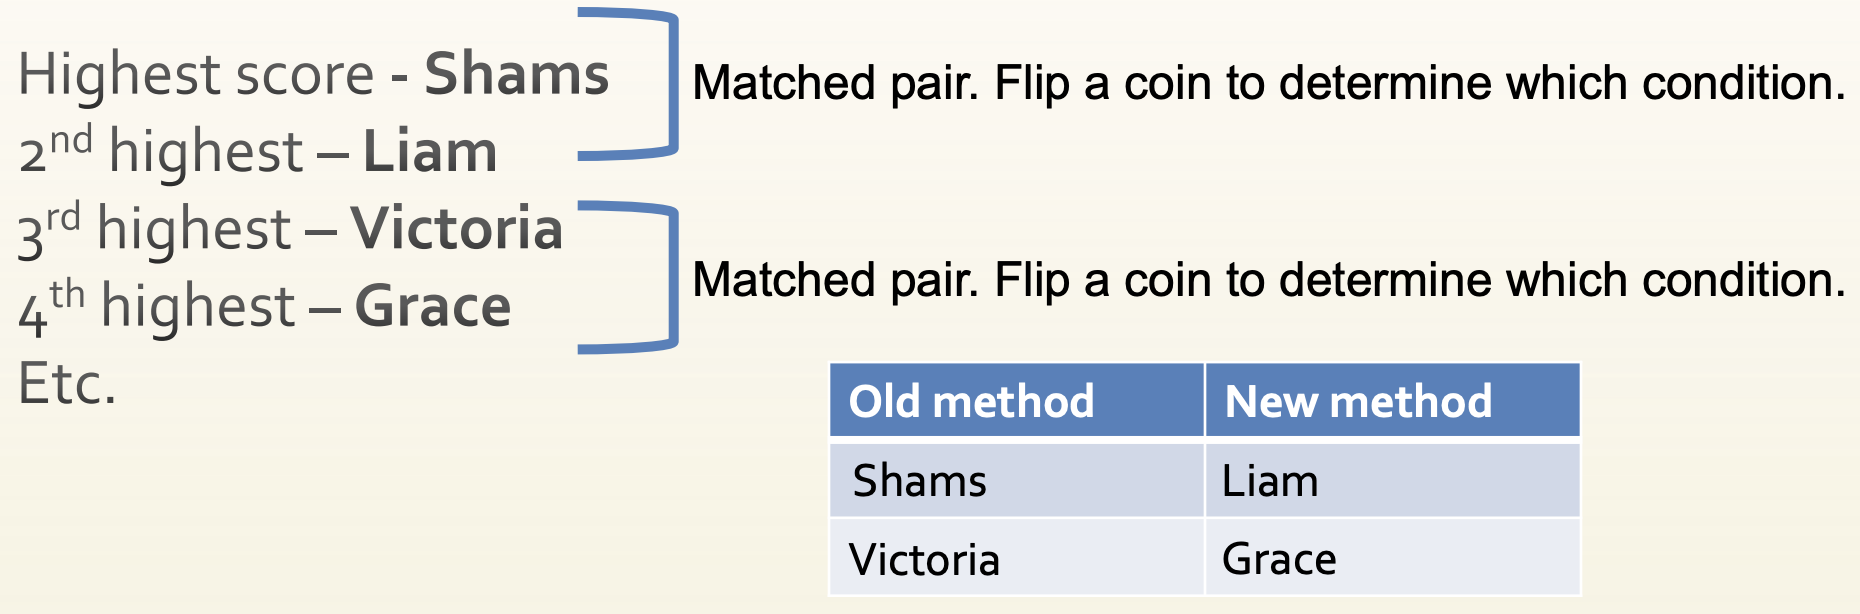
Experimental matching
Pairs are formed on a matching variable. Within each pair, one subject is randomly assigned to the experimental condition & the other is assigned to the control condition.
Experimental Matching: Example
Does a new way of teaching 3rd graders multiplication work better than the old way? Rank order the children on math achievement scores prior to the study:
WHY do we use a Paired Samples t-test?
Eliminates some of the “noise” due to disturbance variables
How does this affect power?
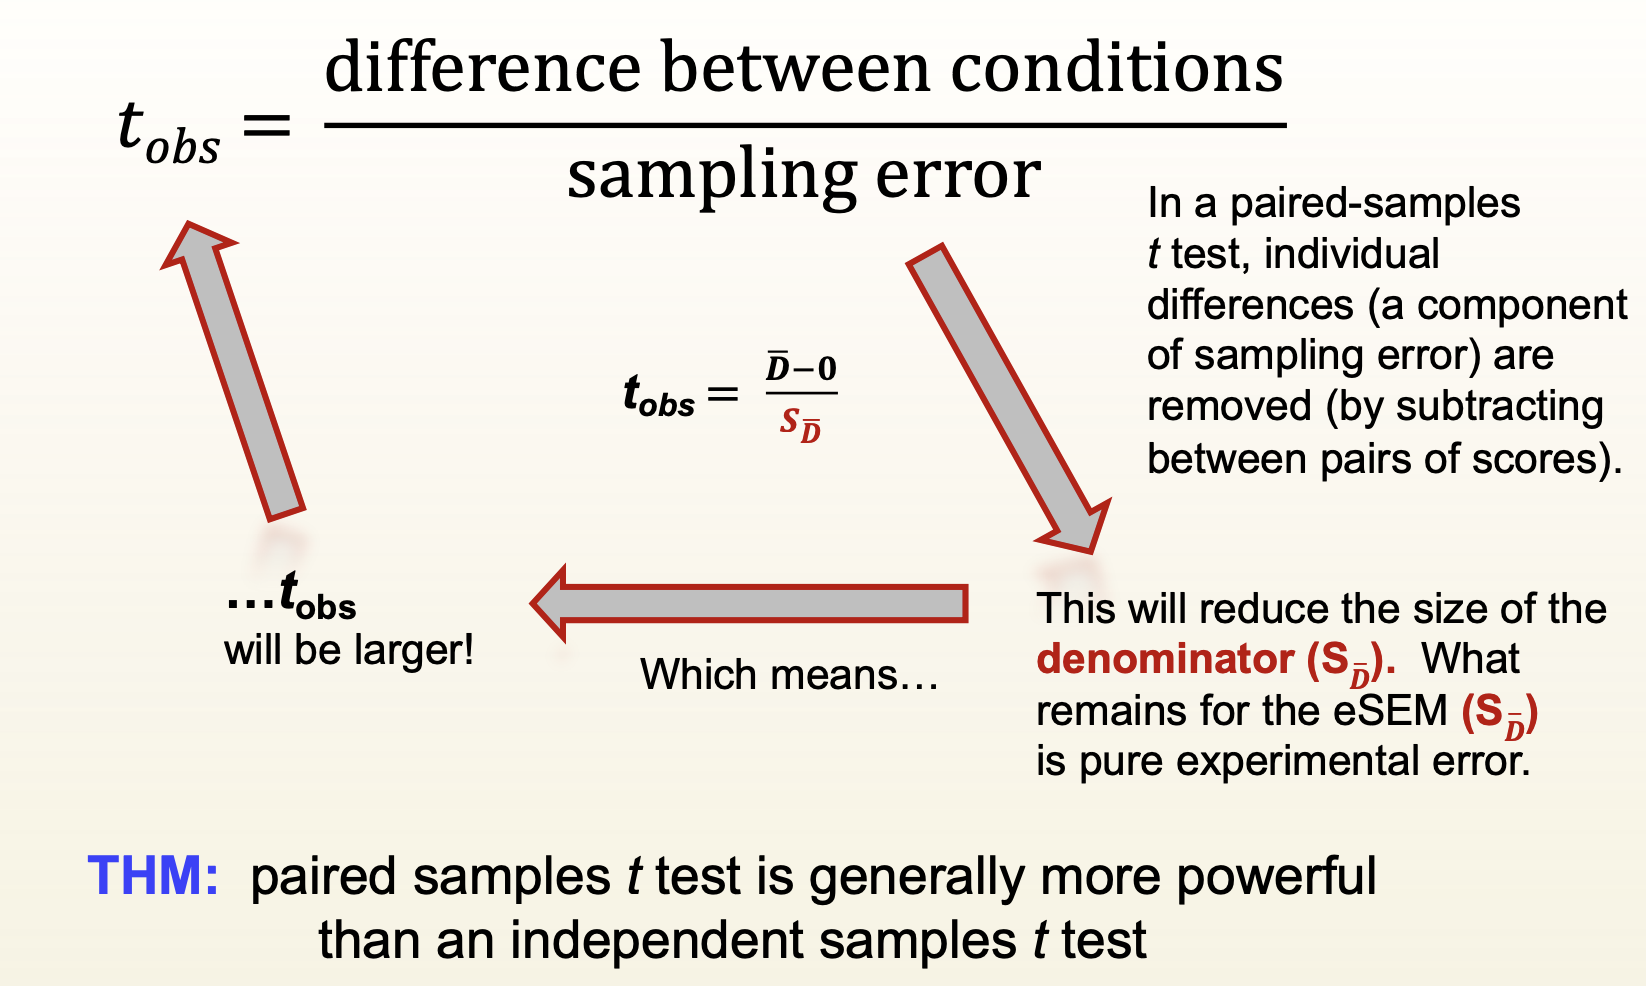
In a paired-samples t test, individual differences (a component of sampling error) are removed (by subtracting between pairs of scores)
This will reduce the size of the denominator. What remains for the eSEM is pure experimental error, which means that…
tobs will be larger!
Paired samples t test is generally more powerful than an independent samples t test
Example of how a Paired Samples t-test Reduces Noise
Studies show that exercise increases blood flow to brain areas involved in memory.
Research question: Does aerobic exercise aid memory more than anaerobic exercise does?
Aerobic Condition:
Run in place for 10 min.
Take memory test
Anaerobic Condition:
Lift weights for 10 min.
Take memory test
If conducted as a between-groups study:
The two groups may differ with respect to individual differences that affect the DV:
Amount of sleep previous night
Ability to concentrate
Memory skill
If conducted as a within-groups study:
These individual differences are exactly the same in each condition (b/c the same people are in each condition).
Can remove this error (thus shrinking the denominator of the t test).
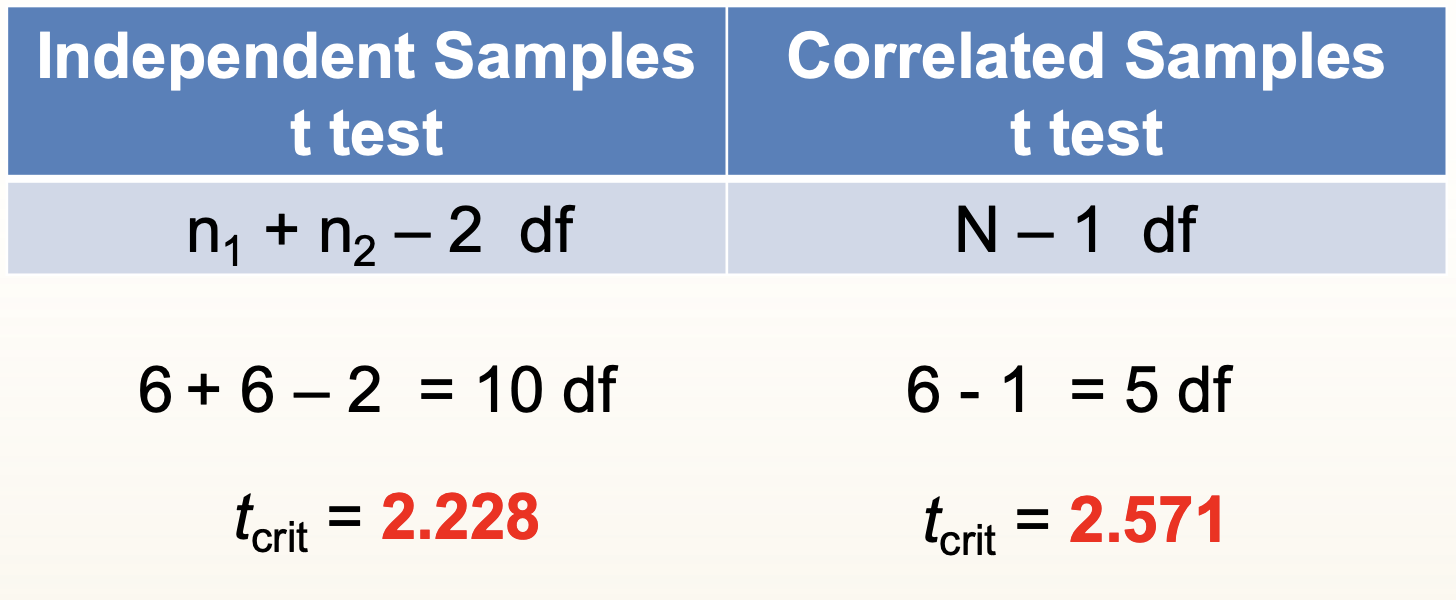
The statistical cost of the correlated samples t-test
Correlated samples (aka paired samples) t test is more powerful ONLY if we reduce enough error variance to offset the decrease in df (we usually do!)
HOW Do We Conduct a Paired Samples t test?
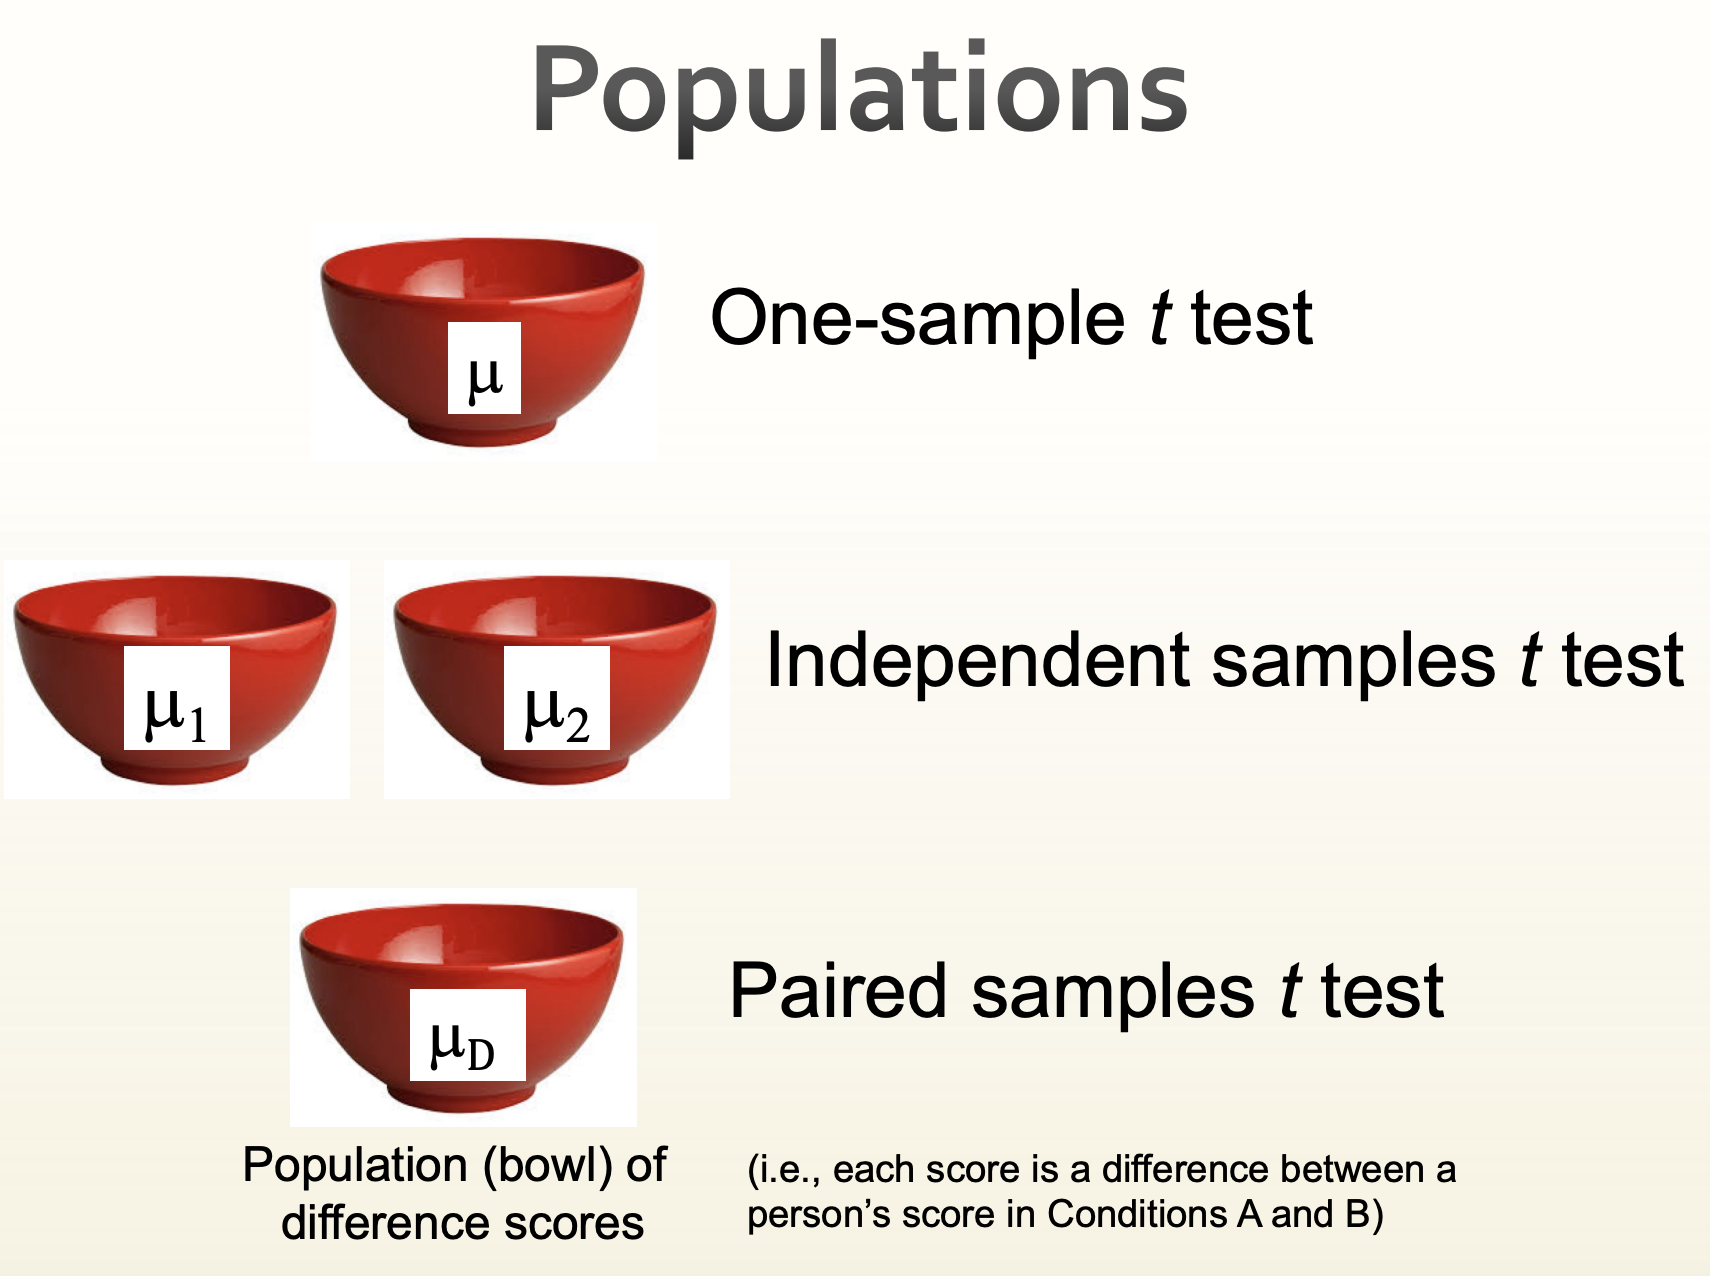
A paired samples t test is exactly like a one-sample t test, but using difference scores.
Population (bowl of difference scores), i.e. each score is a difference between a person’s score in Conditions A and B
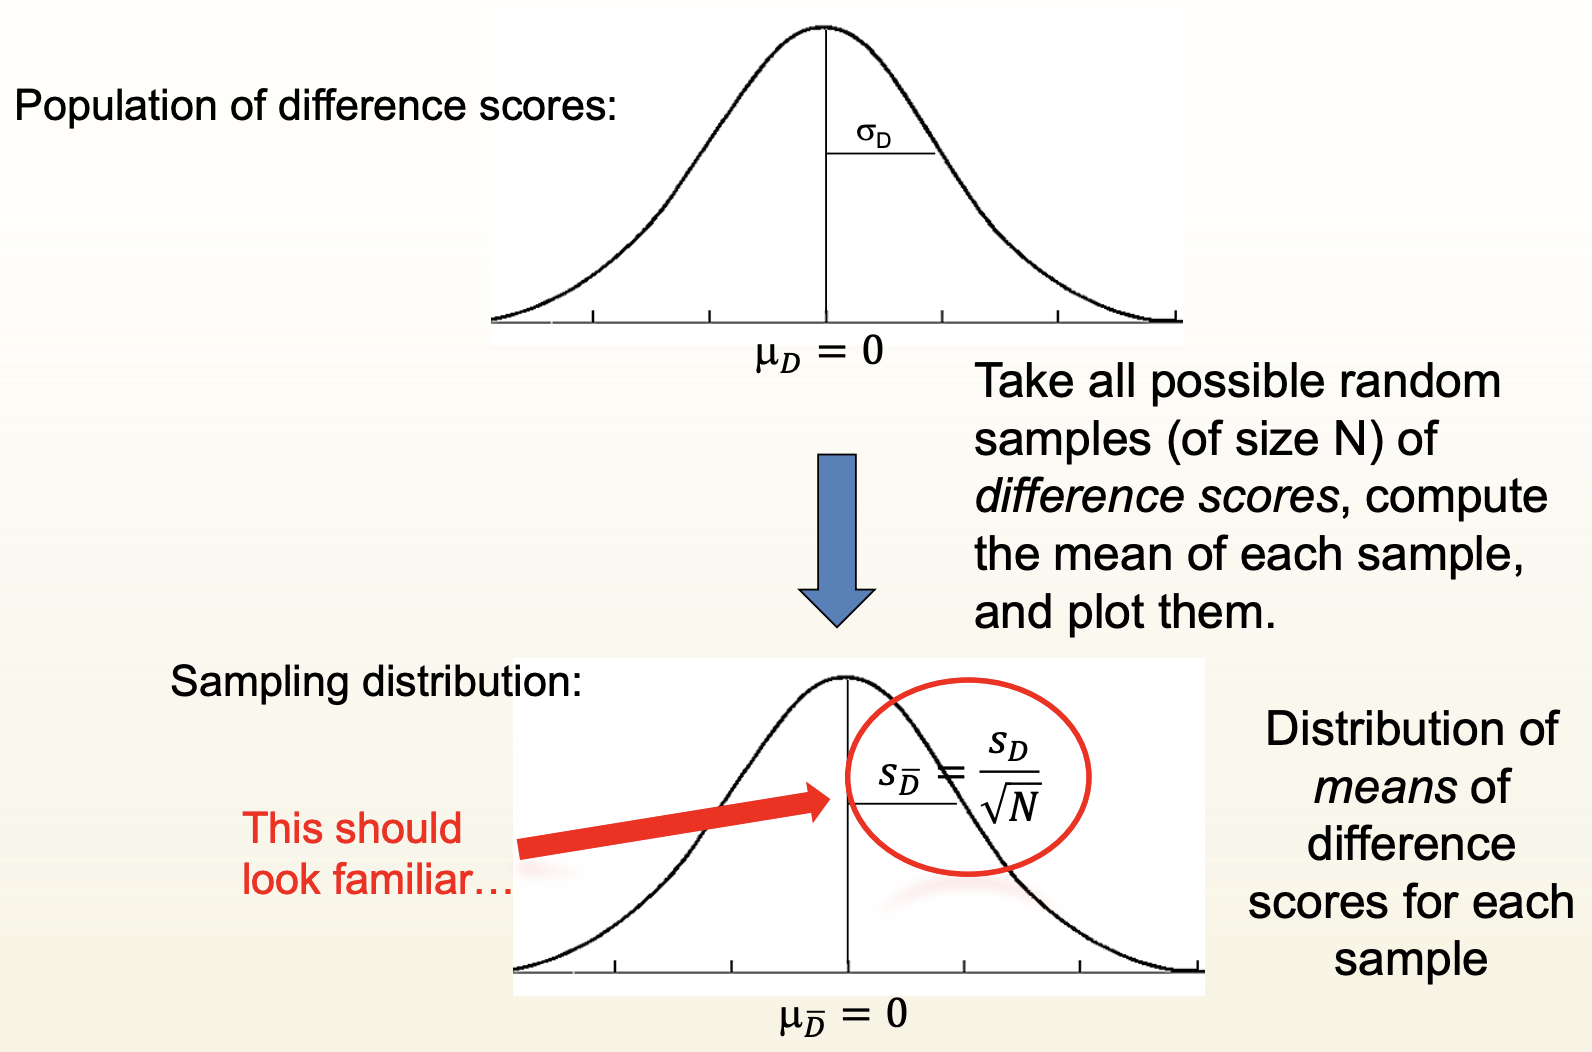
Creating the Sampling Distribution
From population of difference scores:
Take all possible random samples (of size N) of difference scores, compute the mean of each sample, and plot them.
Distribution of means of difference scores for each sample
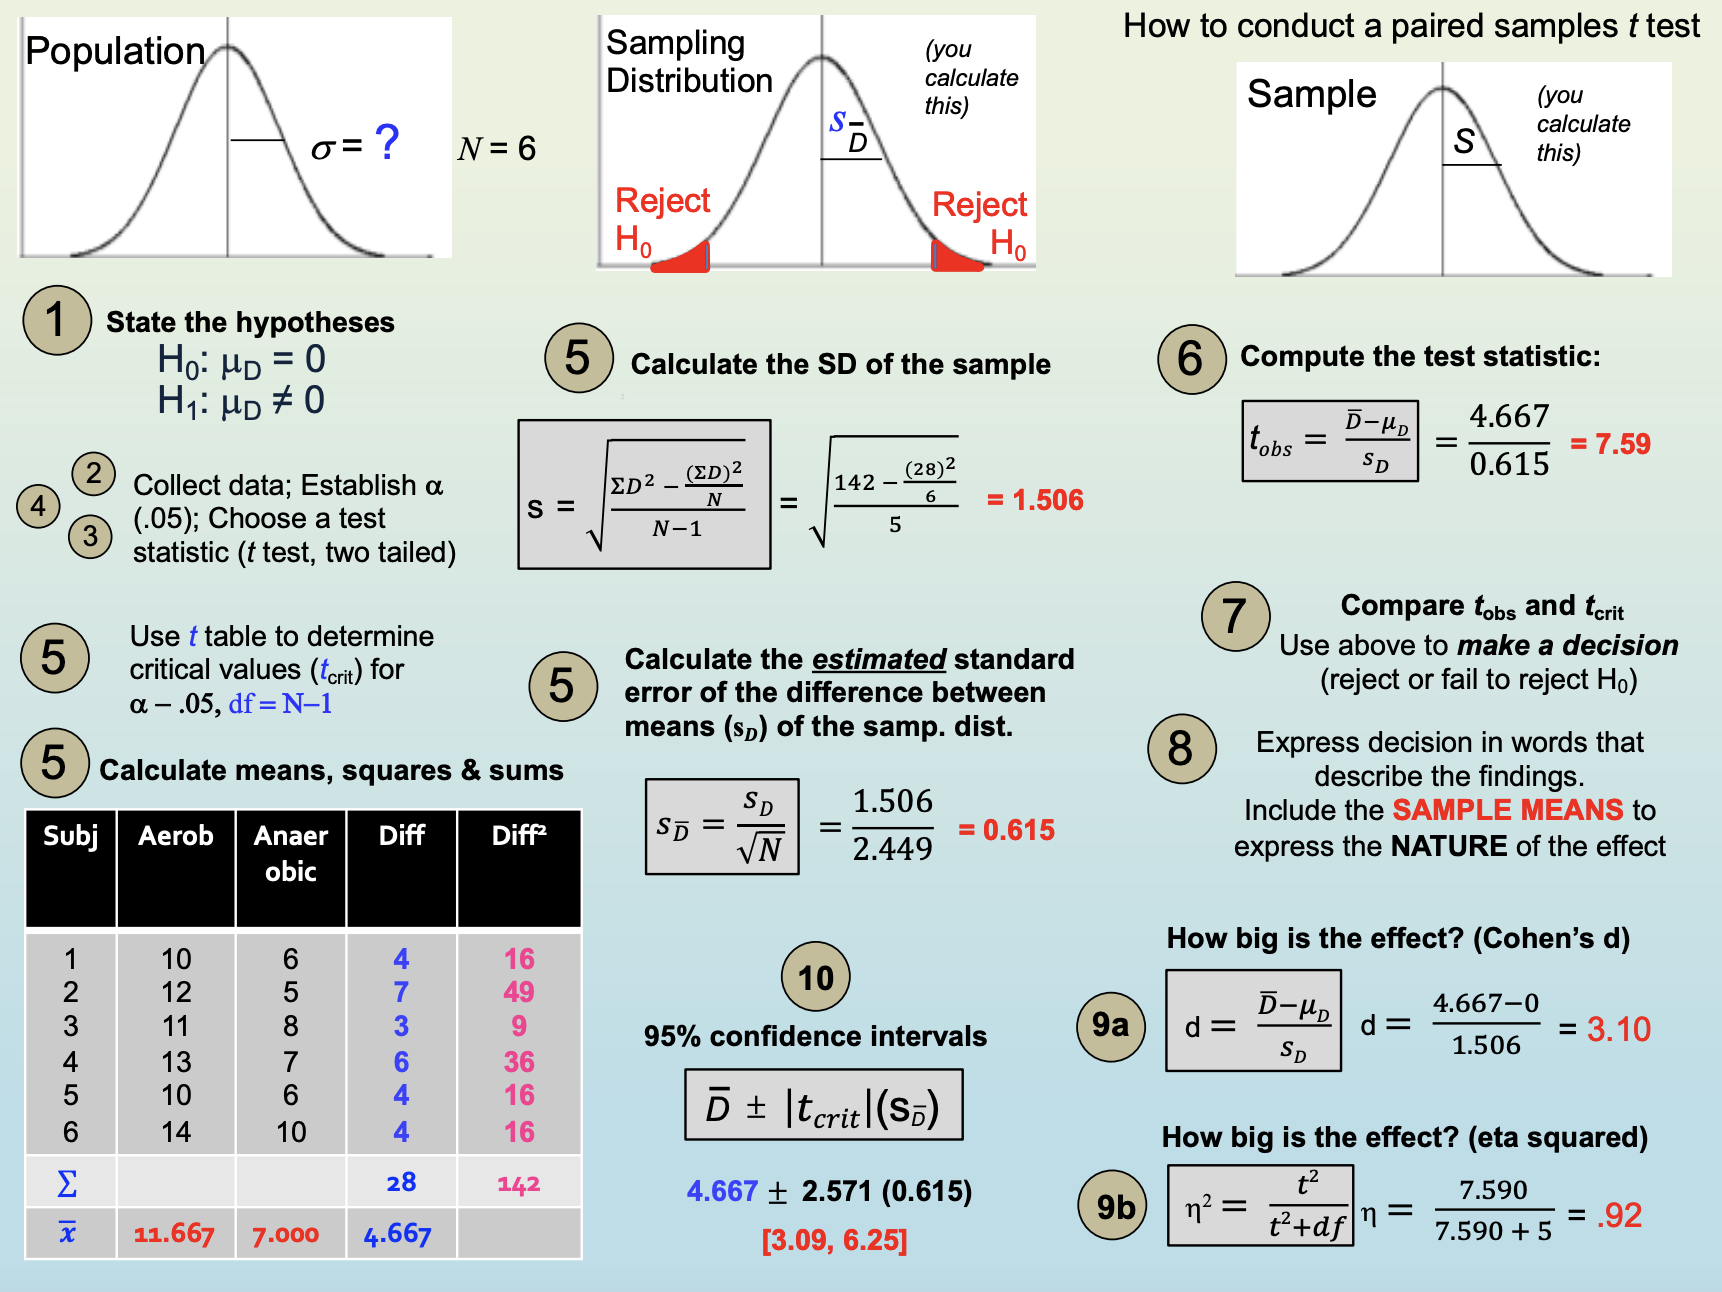
Steps in Hypothesis Testing: Answering “Is there an effect?”
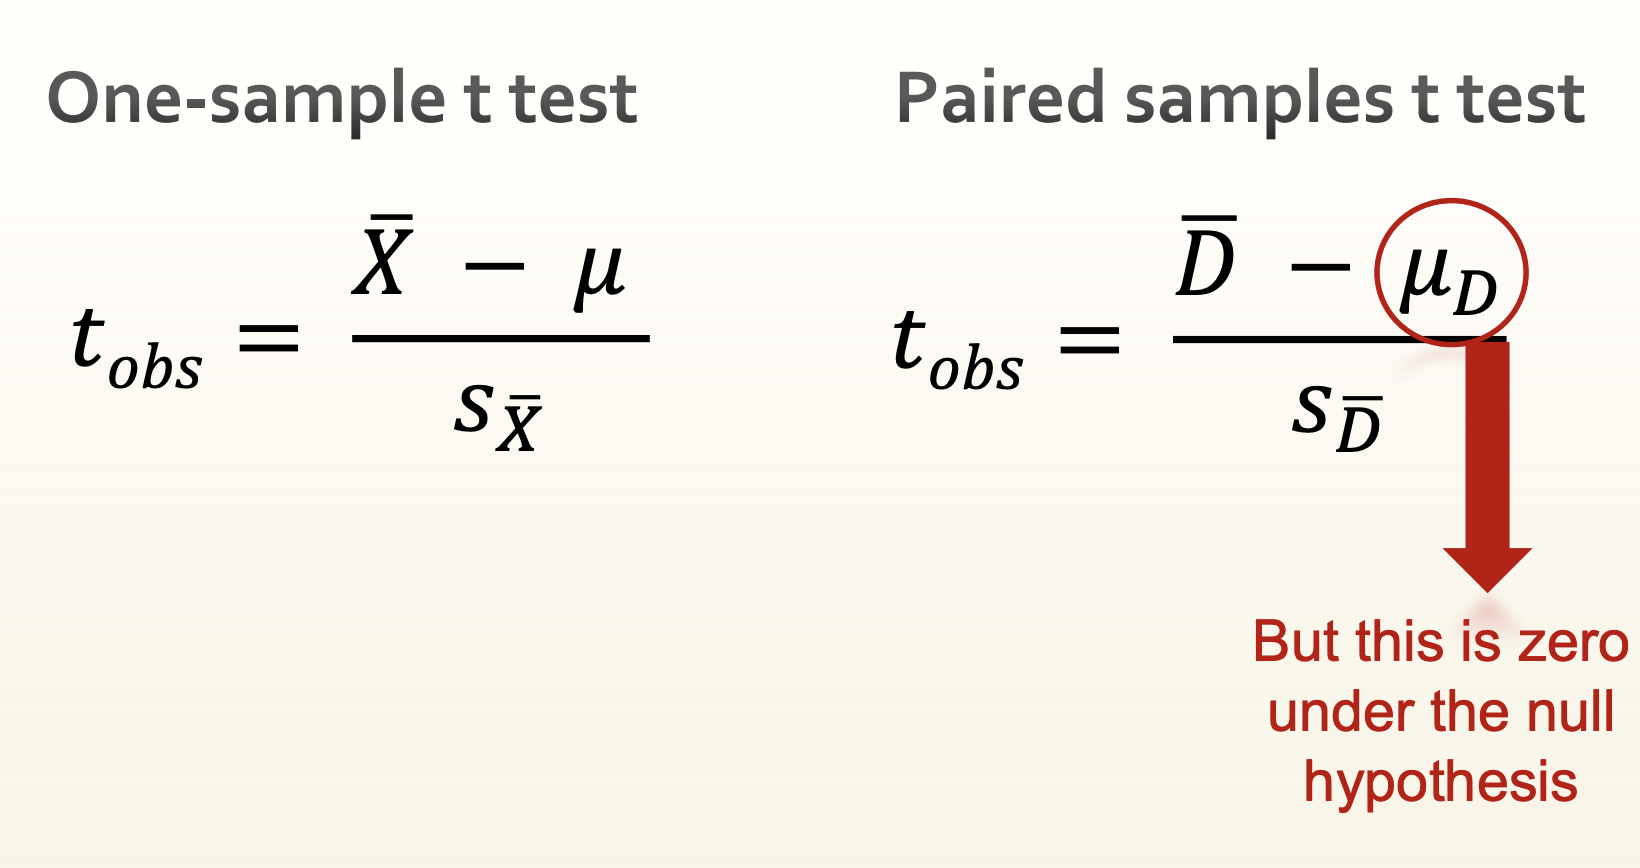
Establish H0 and H1 (If there’s no treatment effect, what should be the mean of the difference (D) scores in the population?)
H0: µD = 0
H1: µD ≠ 0
Collect data
Determine the relevant sampling distribution
Compute standard error of sampling distribution
Establish a (usually = .05)
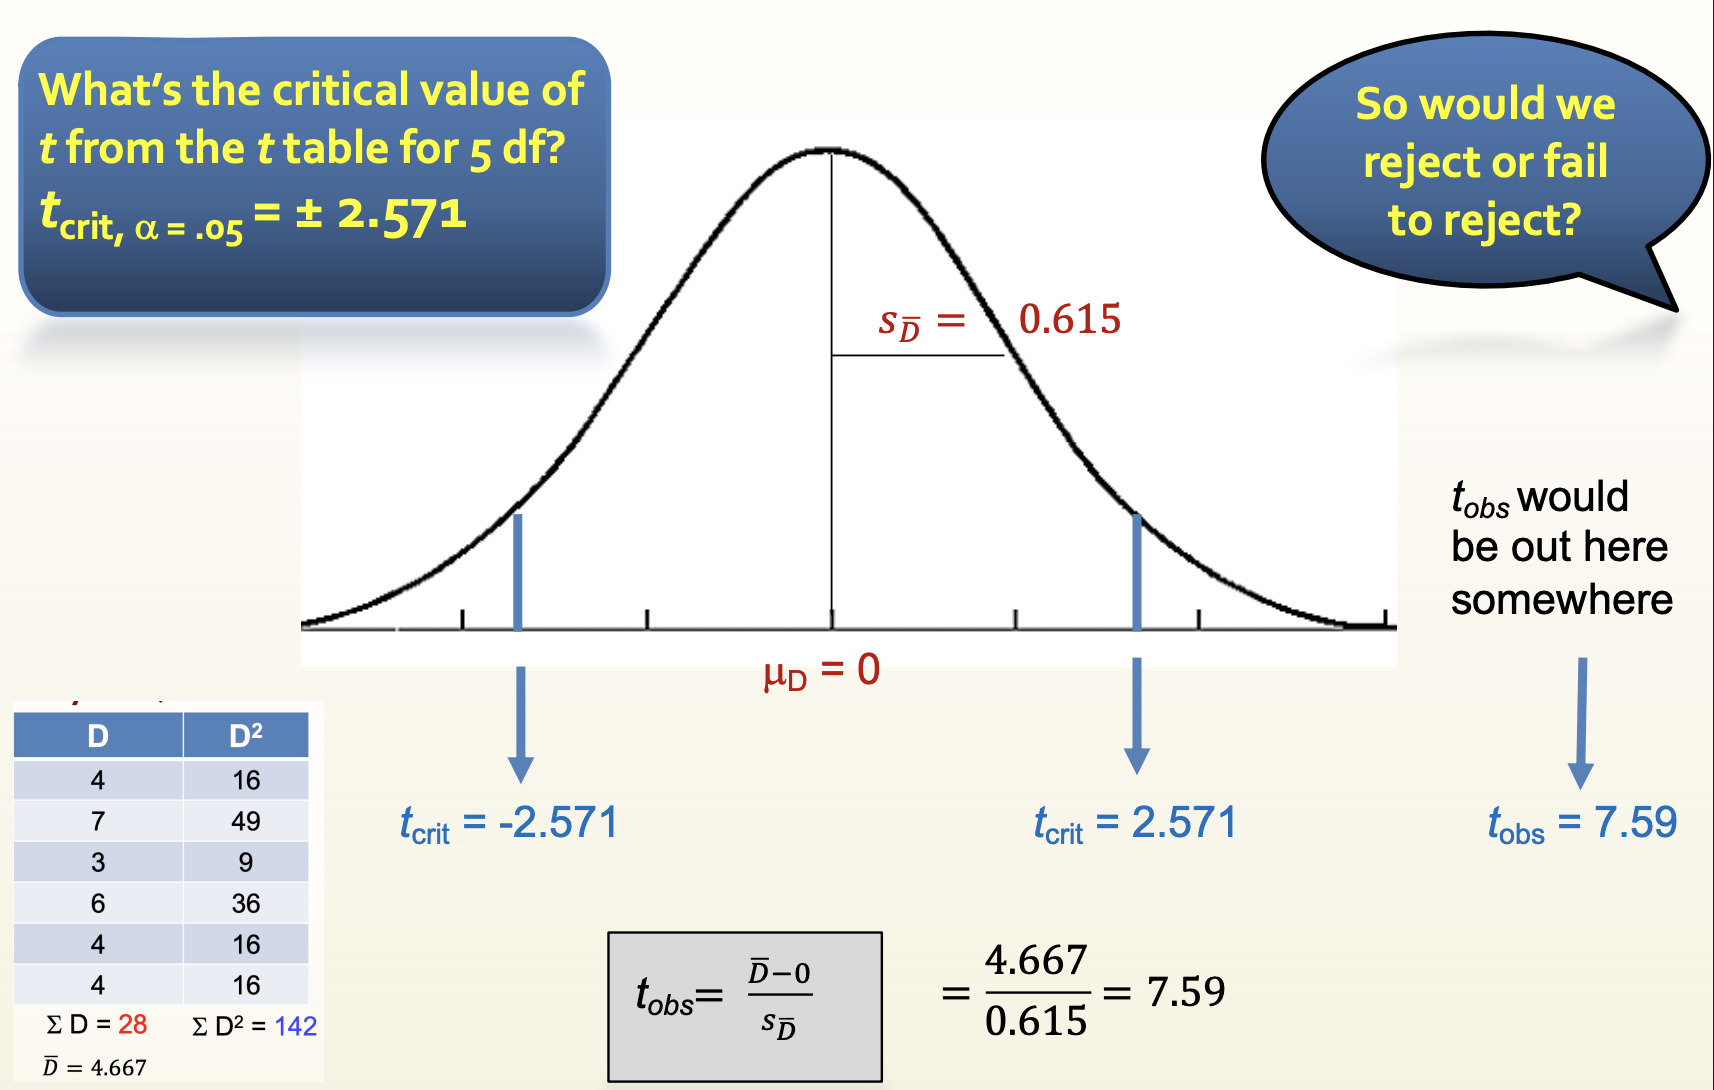
Compute critical rejection points that define the “reject H0” and “fail to reject H0” regions
Compute test statistic (t in this case)
Draw a conclusion
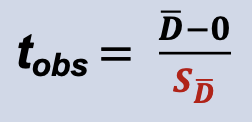
Formula for t
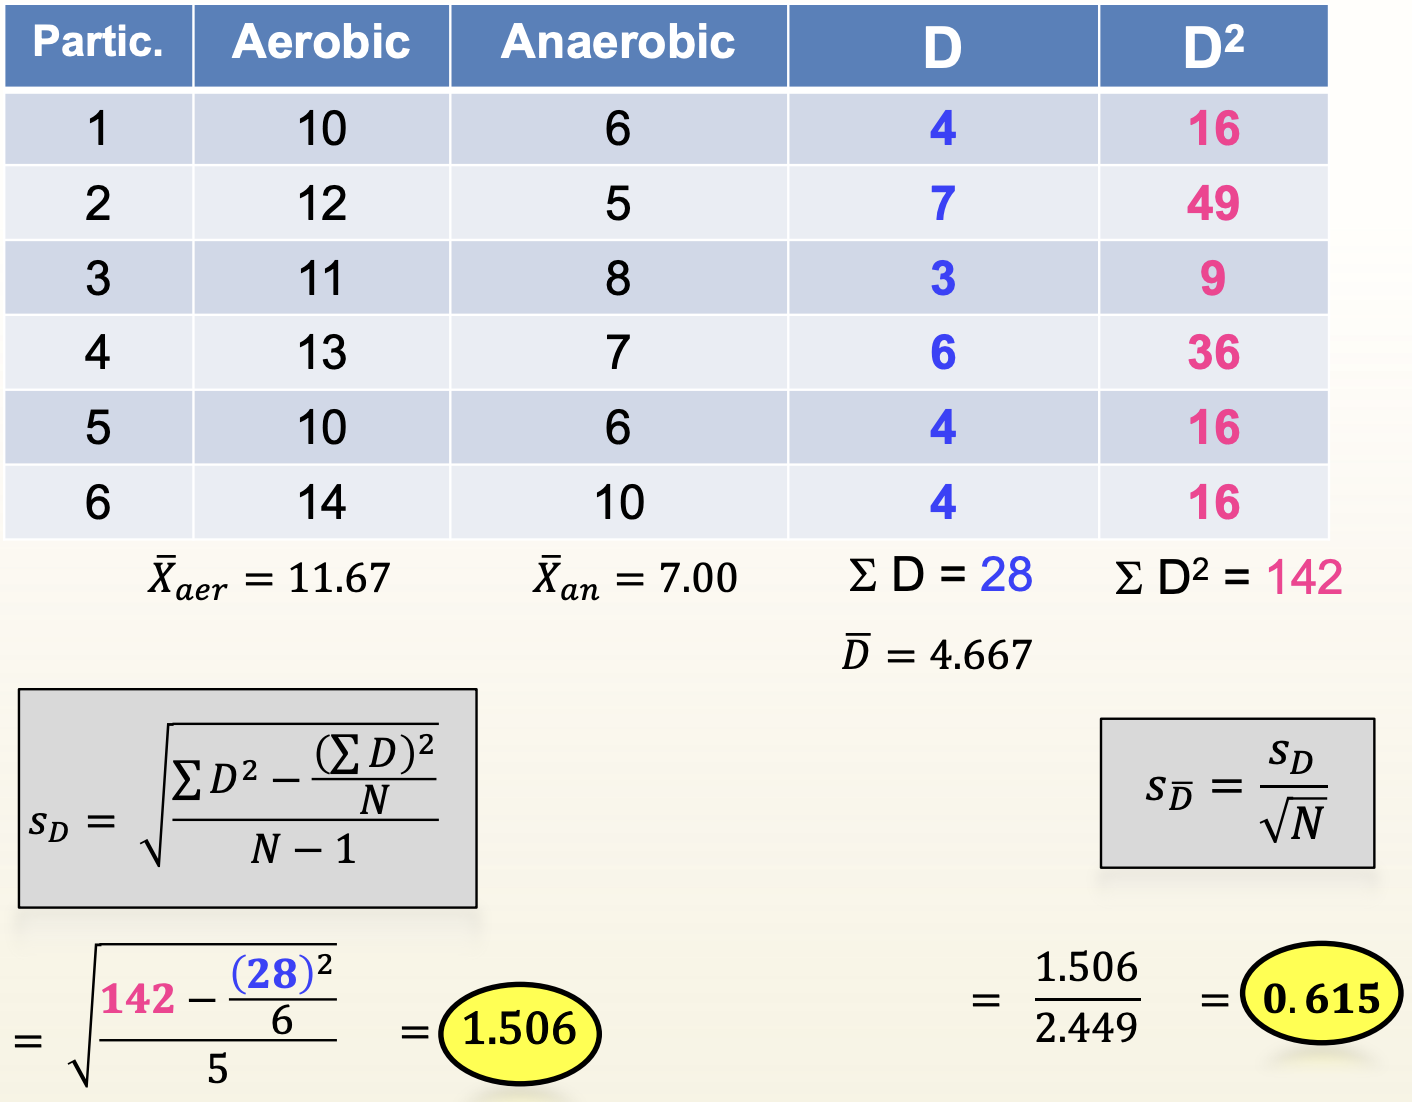
Compute the Paired Samples t test (DV = # correct on memory test); Data Collection
Visualizing the Sampling Distribution
Our 3 Qs:
Is there an effect?
Yes! Our t was statistically significant.
What is the nature of the effect?
Look at the means: Aerobic = 11.67, Anaerobic = 7.00
Memory was significantly better following aerobic than anaerobic activity. Include:
DV (memory)
Both levels of IV (aerobic, anaerobic)
Significance (write the word!)
Direction/Nature (better, less, more, slower)
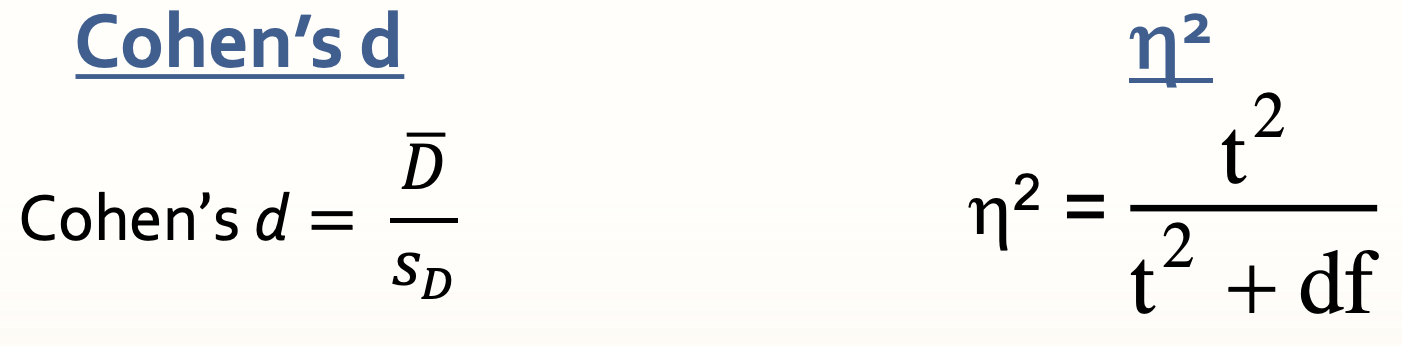
How strong is the effect? Cohen’s d and eta-squared
Measures of Effect Size
Cohen’s D
How many SDs the mean difference scores shifted above or below zero (zero = the difference specified in the null hypo)
Eta-squared
Proportion of variability in the DV associated with the IV after the effects of individual differences have been removed.
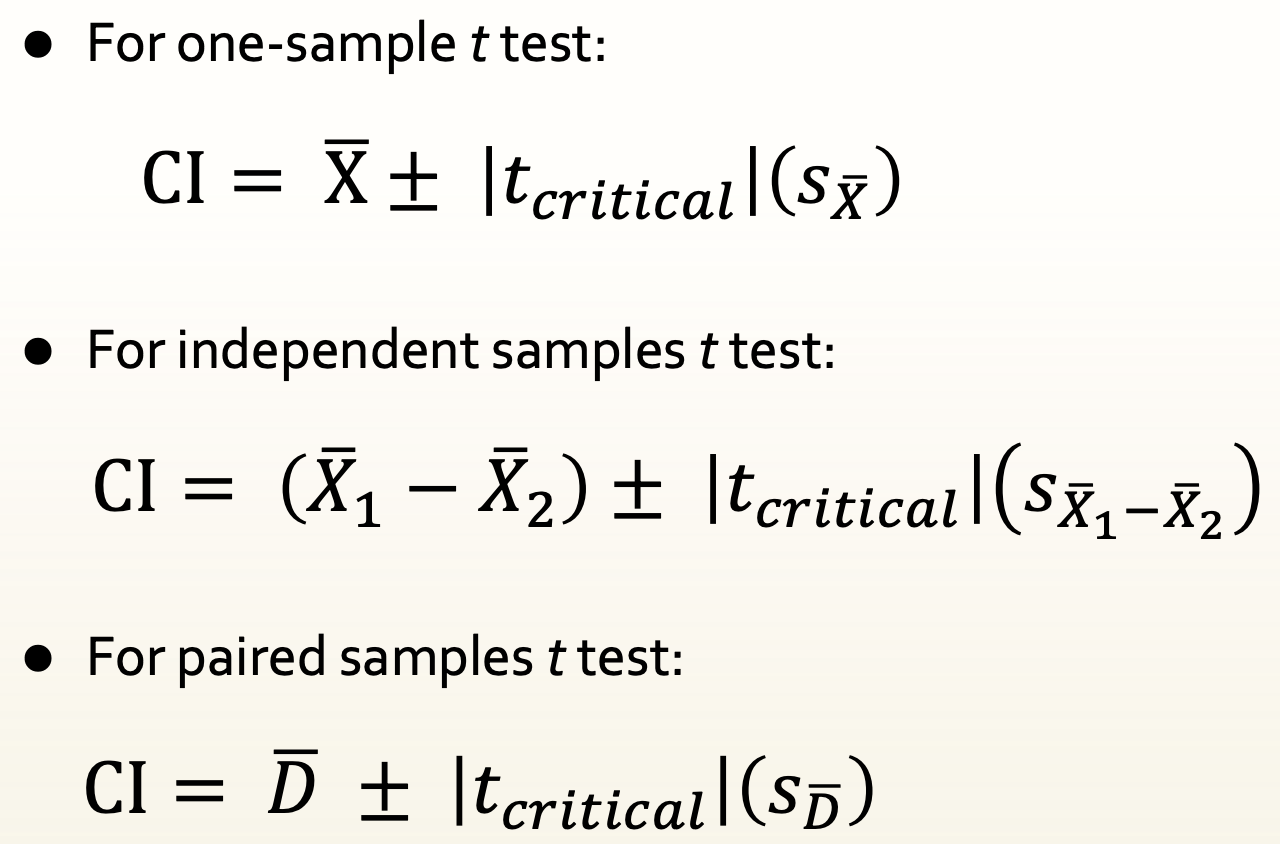
Confidence Intervals
Where tcrit is found in the t table where a = .05 (for 95% CI)
We are 95% confident that the true mean difference in the population falls within this interval. The CI does not contain zero, consistent with our decision to reject the null hypothesis.
True mean difference: The difference in means that exists in the POPULATION, not the sample.
You are 95% confident that the sample difference you pulled comes from a population that has a mean difference somewhere between 3.09 and 6.25.
Steps for conducting Paired Samples t-test
Assumptions of the Paired Samples t test
Difference scores are independently and randomly sampled from the population.
Population of difference scores is normally distributed.
The t test is robust to violations of this assumption, especially if N > 40.
Sample APA-Style Results Section
A paired samples t test examining the difference in memory after aerobic exercise versus anaerobic exercise was statistically significant, t(5) = 7.59, p = .001, d = 3.10, eta-squared = .92. Participants recalled significantly more items following aerobic exercise (M = 11.67, SD = 1.63) than following the anaerobic exercise (M = 7.00, SD = 1.79); 95% CI [3.09, 6,25].