Lecture 11 Gulf Stream and NAO
1/19
There's no tags or description
Looks like no tags are added yet.
Name | Mastery | Learn | Test | Matching | Spaced | Call with Kai | Chat |
|---|
No analytics yet
Send a link to your students to track their progress
20 Terms
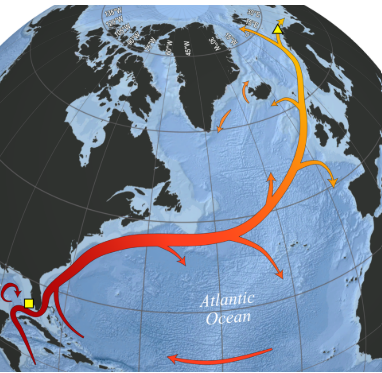
What is the Gulf Stream?
A river in the ocean
Part of the Thermohaline Circulation
West to East (Florida to UK)
Carries warm water Northward from the Gulf of Mexico
Transports a large amount of heat, strongly influencing the climate in the North Atlantic
Carries surface water, movement of currents (Not wind, ENSO)
Who first chartered the Gulf Stream and when?
Benjamin Franklin, 1770
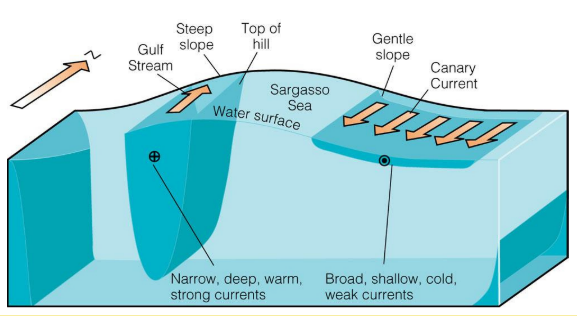
What causes the fast flow rate of the gulf stream?
Western Intensification → Presence of the North American land mass and the
Earth’s rotation (West to East) → “Squeezes” the water flow and increases its speed
Canary current
Eastern side of the Atlantic
Land masses move away from the current instead of squeezing it, resulting in a slower current
Much more shallow and wider, as a result weaker
What are the physical attributes of the Gulf Stream?
Atlantic North Equatorial Current
Flows along the US eastern coast and up to Newfoundland, then eastward towards Europe
Transport rate ~31 Sv (fast)
In comparison, river runoff to the Atlantic Ocean totals only 0.6 Sv
On average 100 km, 800-1200 m deep
Surface maximum speed 2.5 m s ^-1 (makes a good energy source, wind turbines)
What else does the Gulf Stream transport other than water masses?
Large amounts of heat Northward from the equatorial region (tropics, Florida/Gulf of Mexico)
What does the transport of large amounts of heat mean?
Milder climate (warmer) in the North, including northern Europe
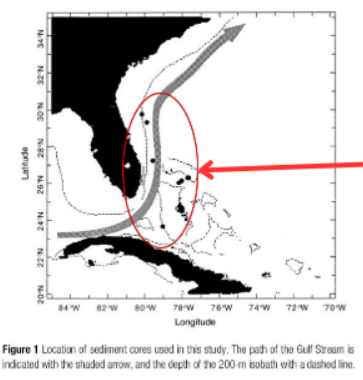
Has the GS always been a fast-flowing current, research paper?
Lynch-Stieglitz et al. (1999)
Collected sediment samples (cores) across the Florida Strait to reconstruct the history of the Gulf Stream
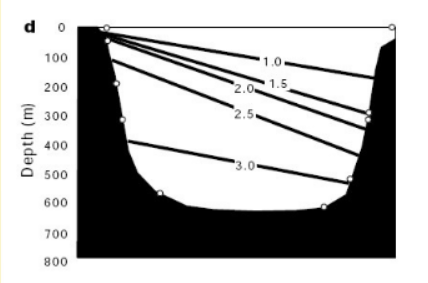
Modern day temperature/density/oxygen isotopes (O16/18) ratios isopleths (line where temp is constant)
Modern day temp: 0 - 800 m temp range from 25 at surface to 10 degrees at depth
Modern day density: the faster current, the more the tilt on isopleths, increases with depth as a result of the Coriolis effect
Modern day Oxygen ratios: match temp and density profiles, shows “titlt” characteristic of fast Gulf Stream flow
Modern day can be compared to the Last Glacial Maximum (LGM)
How does the Lynch-Stieglitz et al. (1999) paper compare modern day to LGM?
Last Glacial Maximum (last Ice Age)
Oxygen isotopes: During LGM, “titlt” was less than modern day conditions, meaning there was a slower fl, ow rate
14-21 Sv during LGM compared to 31 Sv in modern day
Slowing down = less heat transport North
However, 2024 paper suggests the opposite - a faster flow (due to increased wind sheer stress) during the LGM and a redirected path away from Florida (due to lower sea level, water locked up in ice)
Gulf Stream still functioned fast, but due to differences in temperature and sea level, it took a different path, bypassing the Florida Straits and went deeper
Stronger cold winds due to ice age, more severe temp and pressure differences led to very strong winds, which pushed the Gulf Stream more forcefully, resulting in a stronger flow rate
North Atlantic Oscillation (NAO)
Phenomenon affecting North Atlantic climate
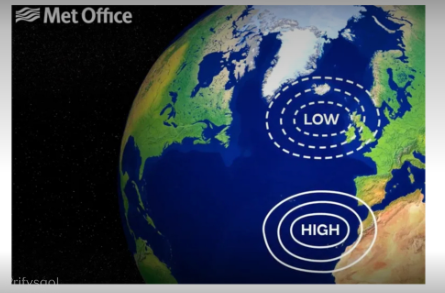
Recurring patterns of atmospheric pressure differences across the North Atlantic Ocean
Where is Sea Surface atmospheric pressure measured near?
Iceland, lower pressure (polar low)
Azores, high pressure (subtropical high)
Pressure difference between two locations indicates the conditions of NAO (either positive or negative)
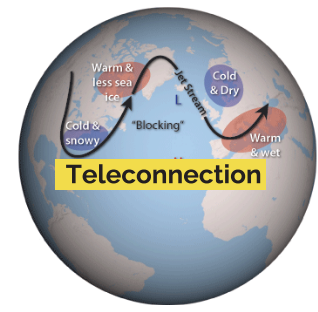
NAO Negative mode
Pressure differences is weaker than normal
Polar low less low in pressure / Subtropical less high in pressure
Pressure areas are closer together, so less difference
Jet Stream less direct
Winds from East and North more frequent, more cold air/winds
Creates peaks and troughs, giving rise to different climatic conditions (pic) - Teleconnection: cold and dry one side, warm on the other
Storms bypass Northern Europe
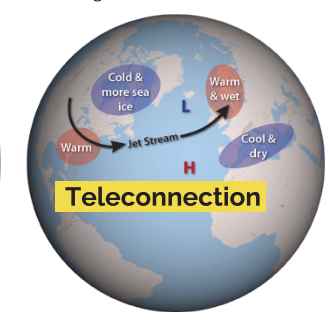
NAO Positive mode
Pressure difference is greater than normal
Polar low becomes lower (colder) / Subtropical high is higher (warmer)
Leads to Westerly winds from North America dominating winds in our direction (Europe), winds bring warmer air with them across the Jet Stream (more direct path)
More frequent storms, as they are pushed directly across the Atlantic
How long does the NAO Index last compared to ENSO?
Years, so lasts longer
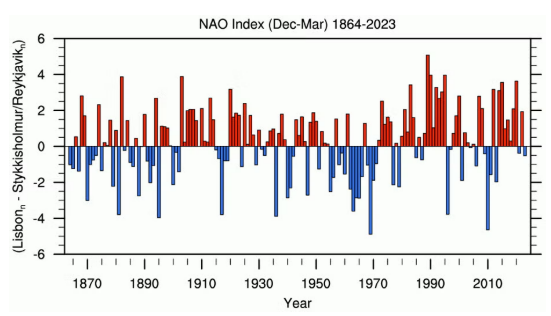
NAO Index
Shows changes
Has no unit - not the actual temperature change
Indicates how much the climate conditions deviate from the average condition
What is the NAO effect on ocean physics?
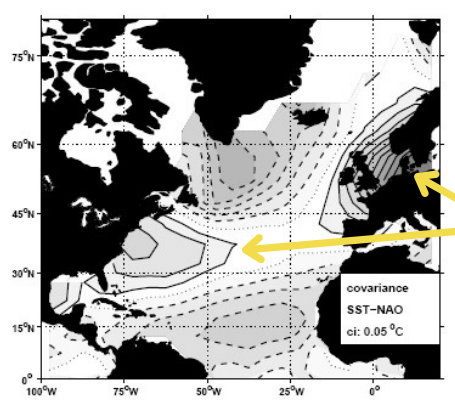
Covariance between NAO index and SST anomaly
When NAO index highly +ve (positive), SST anomaly also highly +ve (warmer than usual) and vice versa
Photo: Solid contours indicate positive covariance, dashed = negative covariance
SST = Sea Surface Temperature
Covarience = linked and changes in a predictable way
Positive covariance = As one increases, so does the other, as NAO index increases, so does SST and vice versa
Negative covariance = Where oscillation index is positive, temp anomaly is negative, colder than usual. When NAO index is negative SST change is positive
Shows that at the same point in time the same NAO can lead to different effects on sea surface temperature at different parts of the Atlantic
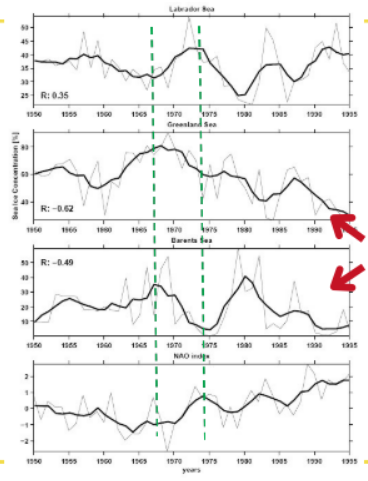
NAO and sea ice concentration
1950 - 1995
Negative covariance (NC) = West Greenland and Canada
Positive covariance (PC) = E.Greenland and N.Europe
NC peaks and troughs in sea ice = inverse sea ice concentrations in PC
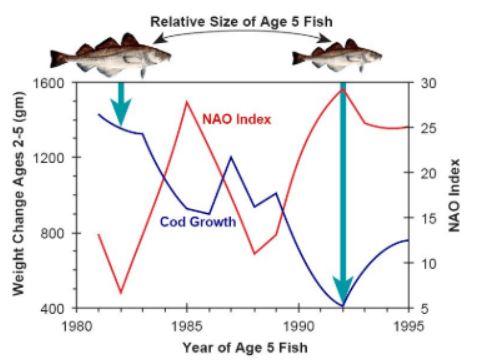
NAO effects on fishery
Example: Northern cod off Newfoundland, Canada
Inverse effect between weight change in Northern cod and NAO Index
Newfoundland = NC, NAO increased sea surface, decreased
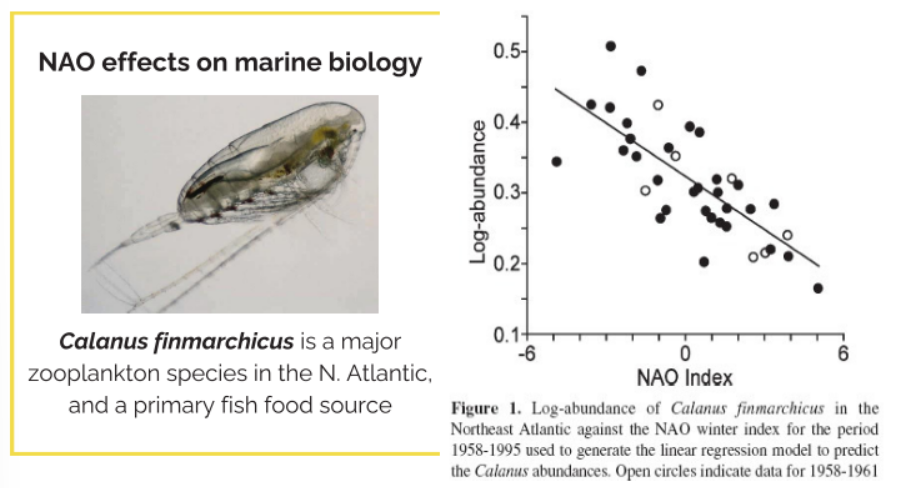
NAO Effects on Marine Biology Paper Example
Fromentin & Planque, 1996
NAO affects biological productivity
Zooplankton = food source for fish larvae
NAO index is high (positive NAO):
Abundance of C. finmarchicus zooplanton decreases.
When the NAO index is low (negative NAO):
Abundance increases.
Abundance of zooplankton species decreases as NAO index increases (negative relationship)
Unfavourable conditions for cold water species:
Warmer temperatures reduce survival and productivity
Altered circulation changes transport pathways
Reduced phytoplankton production lowers food availability
NAO biological productivity - other paper examples