finance formulas sem 1
1/53
There's no tags or description
Looks like no tags are added yet.
Name | Mastery | Learn | Test | Matching | Spaced | Call with Kai |
|---|
No analytics yet
Send a link to your students to track their progress
54 Terms
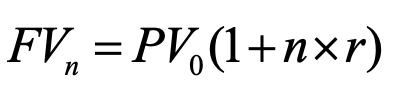
simple interest fv
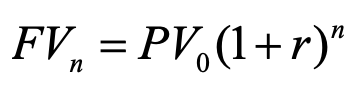
compounding interest
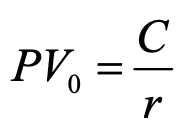
perpetuity
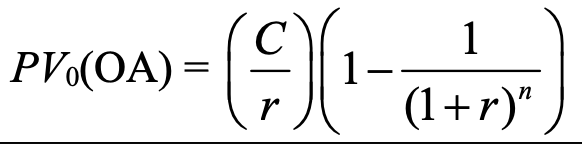
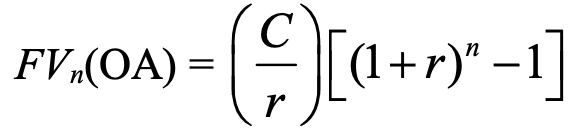
ordinary annuity
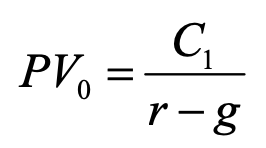
growing perpetuity
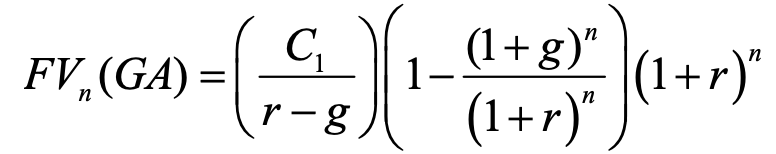
growing annuity fv
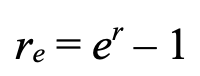
effective interest rate with continuous compounding
r = nominal interest rate
e = eulers number
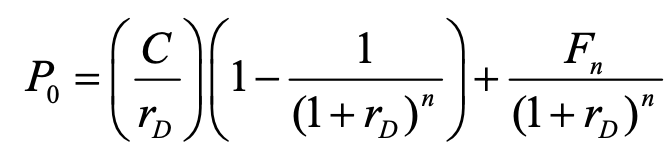
bond pricing / pv of bond
rd = discount rate, n = no. of periods until maturity
fn = face value
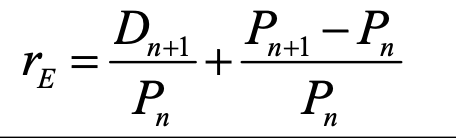
expected return/required rate of return
dn+1 = expected dividend at end of period
pn = price of inv at beginning of period/current price per share
pn+1 = price of inv at end of period
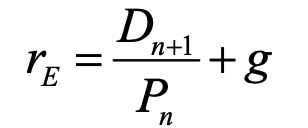
expected return / required rate of return
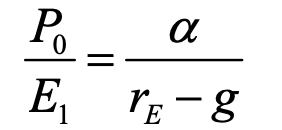
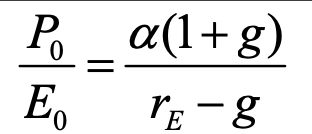
price to earnings ratio (forward)
e1 = earnings per share for next year
a = constant
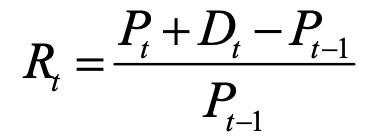
rate of return
rt = rate of return at time t
pt = price of asset at time t
dt = dividends or cash flows received at the previous time period

arithmetic average
r1, r2 etc = individual values in the set
t = total no. of values in the set
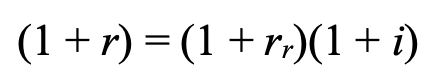
fisher equation
r = nominal interest rate
rr = real interest rate
i = inflation rate

variance
pi = probability of the i-th outcome
ri = i00th outcome of the random variable
E(r ) = expected value of r
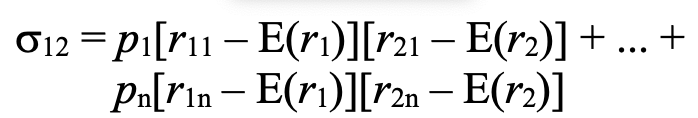
covariance between two random variables
o12 = covariance between r1 and r2
r1i = probability of r1 in i-th scenario
E(r1) = expected value of r1
covariance between two random variables given probability
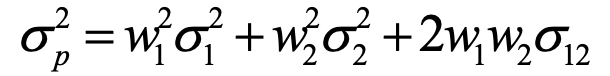
variance of a portfolio of two assets
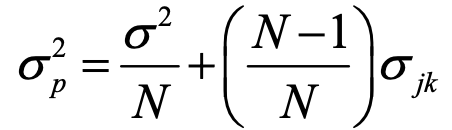
variance of a portfolio of two assets
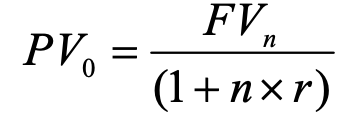
simple interest pv
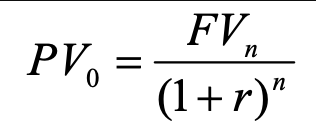
compounded interest pv
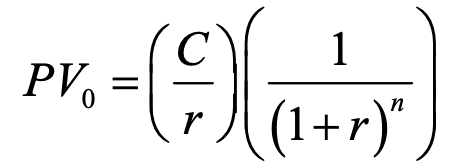
deferred perpetuity pv
ordinary annuity fv
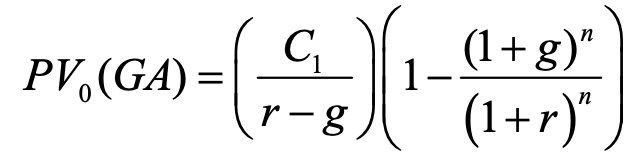
growing annuity pv
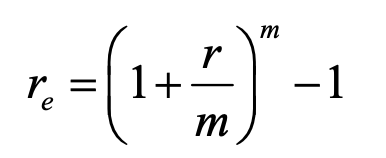
effective annual interest rate
m = no. of compounding periods per year
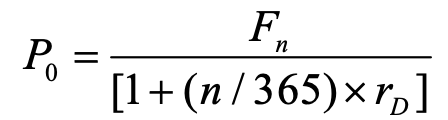
present value / current price of a future payment discounted over time
Fn = future value
n = no. of days
rD = discount rate
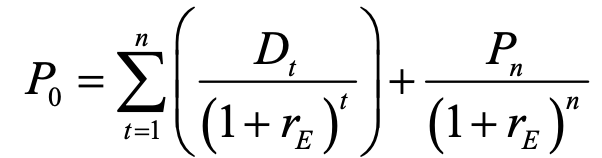
dividend discount model / gordon growth model to find pv / price of stock
n = no. of periods (usually years) over which dividends are considered
t = variable representing each period from 1 to n
Dt = dividend expected in period t
rE = required rate of return
Pn = expected price at end of period n
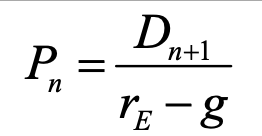
constant dividend growth model to find pv / current price
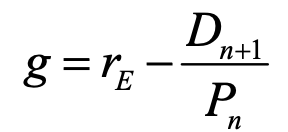
constant dividend growth model to find growth rate
price to earnings ratio (current)
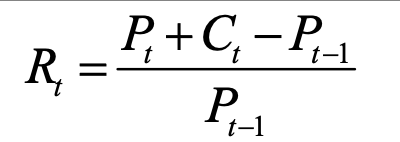
rate of return for a given period
rt = rate of return at time t
ct = cash flow at time t
pt -1 = price at previous time period

geometric average
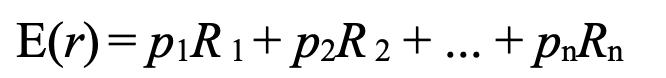
expected return / required rate of return
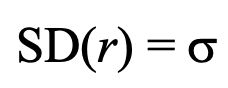
standard deviation
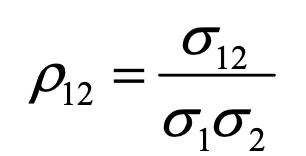
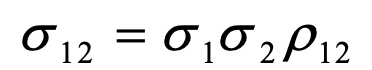
correlation coefficient
o12 = covariance between variables 1 and 2
o1 = sd of variable 1
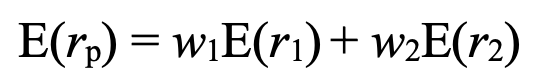
expected return of a portfolio
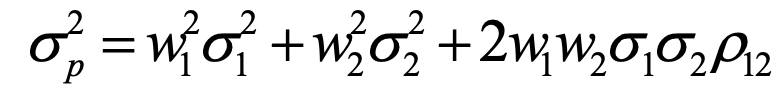
variance of a portfolio of two assets
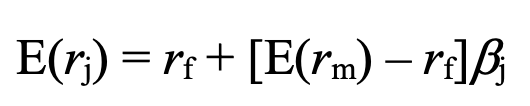
CAPM formula - expected return of an asset based on its risk relative to the market
rf = risk-free rate of return
E(rm) = expected return of the market
Bj = beta of assets (measures volatility relative to market)
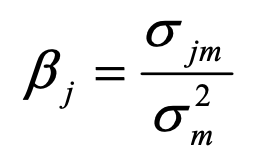
beta
ojm = covariance of returns of asset j and the market
o2m = variance of market returns
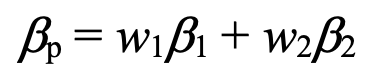
beta of a portfolio
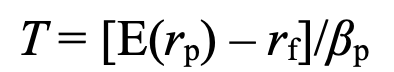
treynor ratio / reward-to-volatility ratio - risk-adjusted performance of an inv portfolio
E(rp) = expected return of portfolio
rf = risk-free rate of return
Bp = portfolio beta
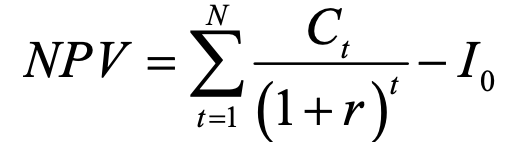
net present value - profitability of an investment
Ct = cash flow at time t
r = discount rate / rate of return
N = total no. of periods
t = time period
I0 = initial investment cost
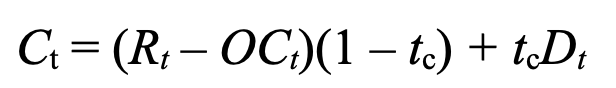
after-tax cash flow
Rt = revenue in period t
OCt = operating costs in period t
tc = corporate tax rate
Dt = depreciation in period t
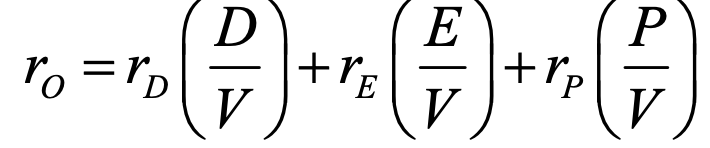
WACC before tax
ro = overall cost of capital (WACC)
rD = cost of debt
rE = cost of equity
rP = cost of preferred stock
V = total market valye of company’s capital (D+E+P)
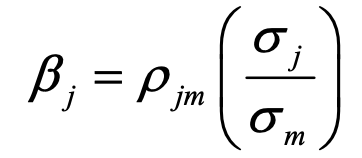
beta of an asset - systematic risk of an investment
pjm = correlation between asset j and market m
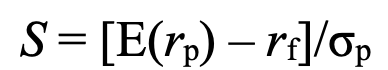
sharpe ratio - how much extra return you are getting for extra risk
E(rp) = expected return of portfolio
rf = risk free rate of return
op = sd of portfolio’s excess return
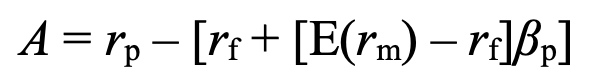
alpha - portfolio’s extra return for extra risk
+ve alpha means portfolio has outperformed expected return
-ve alpha means portfolio has underperformed
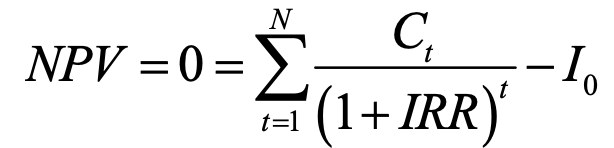
NPV when it equals zero to find internal rate of return (IRR)
E = sum series of values
ct = cash flow in period t
I0 = initial investment cost
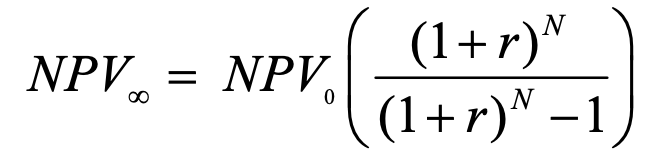
net present value of a perpetuity
N = no. of periods
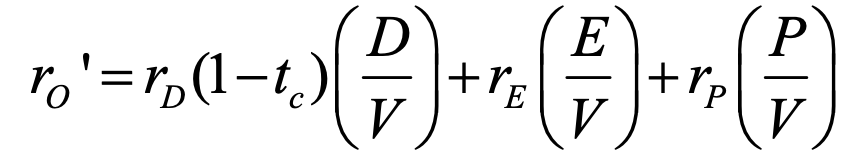
after-tax WACC
rD = cost of debt
tc = corporate tax rate
V = company’s capital = D+E+P = debt + equity + preferred stock
rE = cost of equity
rP = cost of preferred stock
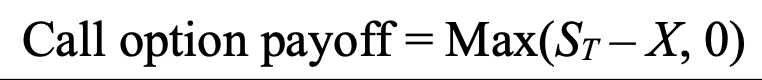
call option payoff
ST = stock price at expiration
X = strike price
if ST > X, call option holder receives difference
if ST < X, option will expire worthless and payoff = 0

call option profit - provides buyer with the right, but not obligation, to purchase asset at a predetermined price (strike price) on or before a specific date
ST = price of underlying asset at expiration
X = strike price
C = premium paid for call option
if ST > X, profit is difference
if ST < X, profit is zero as this option would not be exercised
C is subtracted from potential profit or zero to determine overall profit

put option payoff
give buyer the right, but not obligation, to sell an asset at a specified price (strike price) on or before a certain date
ST = asset’s price at expiration
if X > ST, payoff is difference
if X < ST, payoff is zero as option expires worthless

put option payoff
ST = price of asset at expiration
if X > ST, profit is difference
if X < ST, profit is zero