MODULE 5 NOT DONE
1/53
There's no tags or description
Looks like no tags are added yet.
Name | Mastery | Learn | Test | Matching | Spaced | Call with Kai |
|---|
No analytics yet
Send a link to your students to track their progress
54 Terms
The availability of highway transportation has provided several advantages that contribute to a high standard of living. However, several problems related to the highway mode of transportation exist. These problems include highway-related crashes, parking difficulties, congestion, and delay. To reduce the negative impact of highways, it is necessary to adequately collect information that describes the extent of the problems and identifies their locations. Such information is usually collected by organizing and conducting traffic surveys and studies
TRAFFIC IMPACT ASSESMENT
Traffic studies may be grouped into three main categories
Inventories
Administrative Studies
Dynamic Traffic Studies
provide a list or graphic display of existing information, such as street widths, parking spaces, transit routes, traffic regulations, and so forth.
Inventories
use existing available in government agencies and departments. This information is used to prepare an inventory of the relevant data. Administrative studies include the results of surveys, which may involve field measurements and/or aerial photography
Administrative Studies
involve the collection of data under operational conditions and include studies of speed, traffic volume, travel time and delay, parking, and crashes. Since dynamic studies are carried out by the traffic engineer to evaluate current conditions and develop solutions
Dynamic Traffic Studies
are conducted to estimate the distribution of speeds of vehicles in a stream of traffic at a particular location on a highway. The speed of a vehicle is defined as the rate of movement of the vehicle; it is usually expressed in miles per hour (mi/h) or kilometers per hour (km/h).
Spot speed studies
is carried out by recording the speeds of a sample of vehicles at a specified location. Speed characteristics identified by such a study will be valid only for the traffic and environmental conditions that exist at the time of the study
Spot speed study
LOCATIONS FOR SPOT SPEED STUDIES
1. Locations that represent different traffic conditions on a highway or highways are used for _____________
2. Mid-blocks of urban highways and straight, level sections of rural highways are sites for ________________
3. Locations that represent different traffic conditions on a highway or highways are used for
basic data collection
speed trend analyses
basic data collection
TRUE OR FALSE
The time of day for conducting a speed study depends on the purpose of the study. In general, when the purpose of the study is to establish posted speed limits, to observe speed trends, or to collect basic data, it is recommended that the study be conducted when traffic is free-flowing, usually during off-peak hours.
The duration of the study should be such that the minimum number of vehicle speeds required for statistical analysis is recorded. Typically, the duration is at _________
TRUE
at least 1 hour and the sample size is at least 30 vehicles.
is used to represent the true mean value of all vehicle speeds at that location. The accuracy of this assumption depends on the number of vehicles in the sample. The larger the sample size, the greater the probability that the estimated mean is not significantly different from the true mean.
Calculated mean (or average) speed
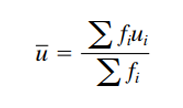
is the arithmetic mean of all observed vehicle speeds (which is the sum of all spot speeds divided by the number of recorded speeds). It is given as
Average Speed
is the speed at the middle value in a series of spot speeds that are arranged in ascending order.
Median Speed
which is the speed value that occurs most frequently in a sample of spot speeds
Modal Speed
which is the spot speed value below which i percent of the vehicles travel; for example, 85th percentile spot speed is the speed below which 85 percent of the vehicles travel and above which 15 percent of the vehicles travel
ith-percentile Spot Speed
is the range of speed—usually taken at 10-mi/h intervals—that has the greatest number of observations.
Pace
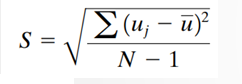
is a measure of the spread of the individual speeds. It is estimated as
Standard Deviation of Speeds
defined as the degree of confidence that the sampling error of a produced estimate will fall within a desired fixed range.
precision level
is commonly given in terms of the level of significance (α), where α = (100 - confidence level). The commonly used _______ for speed counts is 95 percent
confidence level
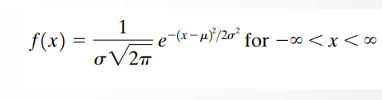
The basic assumption made in determining the minimum sample size for speed studies is that the ________________. describes the speed distribution over a given section of highway. It is given as:
The methods used for conducting spot speed studies can generally be divided into two main categories:
manual and automatic.
These automatic devices can be grouped into three main categories:
Road Detectors
Radar-Based Traffic Sensors
Electronic-Principle Detectors
When ____ ____ are used to measure speed, they should be laid such that the probability of a passing vehicle closing the connection of the meter during a speed measurement is reduced to a minimum
Road Detectors
work on the principle that when a signal is transmitted onto a moving vehicle, the change in frequency between the transmitted signal and the reflected signal is proportional to the speed of the moving vehicle
Radar-Based Traffic Sensors
NAG BUG SAME SA ROAD DETECTOR AND DEFINITION
Electronic-Principle Detectors
are conducted to collect data on the number of vehicles and/or pedestrians that pass a point on a highway facility during a specified time period. This time period varies from as little as 15 minutes to as much as a year depending on the anticipated use of the data. The data collected also may be put into subclasses which may include directional movement, occupancy rates, vehicle classification, and pedestrian age
Traffic volume studies
Traffic volume studies are usually conducted when certain volume characteristics are needed, some of which follow:
Average Annual Daily Traffic (AADT)
- is the average of 24-hour counts collected every day of the year.
Average Daily Traffic (ADT)
- is the average of 24 hour counts collected over anumber of days greater than one but less than a year.
Peak Hour Volume (PHV)
- is the maximum number of vehicles that pass a point on a highway during a period of 60 consecutive minutes.
Vehicle Classification (VC)
- records volume with respect to the type of vehicles,for example, passenger cars, two-axle trucks, or three-axle trucks
Vehicle Miles of Travel (VMT)
- is a measure of travel along a section of road. It is the product of the traffic volume (that is, average weekday volume or ADT) and the length of roadway in miles to which the volume is applicable.
involves one or more persons recording observed vehicles using a counter. With this type of counter, both the turning movements at the intersection and the types of vehicles can be recorded
Manual Method
require the laying of surface detectors (such as pneumatic road tubes) or subsurface detectors (non invasive, such as magnetic or electric contact devices) on the road, detect the passing vehicle and transmit the information to a recorder, which is connected to the detector at the side of the road
Automatic Method
It is capable of obtaining per-vehicle or volume data. The data collected can be downloaded to the Centurion-CC software for Windows and a variety of reports obtained. Data collected can be verified in the field using a four-line LCD display. It can collect data on up to four lanes.
Apollo Counter/Classifier
These use an inductive loop to identify the presence of individual vehicles and determine speed, length, occupancy, and obtain vehicle counts. They are designed to use either standard inductive loops or 3M’s Non Invasive Microloop Model 702 Probes.
3M Canoga C900 Series Vehicle Detectors.
Different types of traffic counts are carried out, depending on the anticipated use of the data to be collected.
Cordon Counts
Screen Line Counts
Intersection Counts
Pedestrian Volume Counts
Continuous Counts
Control Counts
Coverage Counts
when information is required on vehicle accumulation within an area such as the central business district (CBD) of a city, particularly during a specific time, a cordon count is undertaken
Cordon Counts
the study area is divided into large sections by running imaginary lines, known as screen lines, across it
Screen Line Counts
are taken to determine vehicle classifications, through movements, and turning movements at intersections.
Intersection Counts
are made at locations such as subway stations, mid blocks, and crosswalks. The counts are usually taken at these locations when the evaluation of existing or proposed pedestrian facilities is to be undertaken.
Pedestrian Volume Counts
are taken ______ using mechanical or electronic counters. Stations at which continuous counts are taken are known as permanent count stations.
Continuous Counts
are taken at stations known as____ _____ stations, which are strategically located so that representative samples of traffic volume can be taken on each type of highway or street in an area-wide traffic counting program
Control Counts
These counts are used to estimate ADT, using expansion factors developed from control counts. The study area is usually divided into zones that have similar traffic characteristics.
Coverage Counts
TRAFFIC VOLUME DATA PRESENTATION
These maps show traffic volumes on individual routes. The volume of traffic on each route is represented by the width of a band, which is drawn in proportion to the traffic volume it represents, providing a graphic representation of the different volumes that facilitates easy visualization of the relative volumes of traffic on different routes
Traffic Flow Maps-
These sheets are graphic representations of the volume and directions of all traffic movements through the intersection. These volumes can be either ADTs or PHVs, depending on the use of the data
Intersection Summary Sheets
These charts show the hourly, daily, monthly, or annual variations in traffic volume in an area or on a particular highway. Each volume is usually given as a percentage of the average volume..
Time-Based Distribution Charts
These tables give a summary of traffic volume data such as PHV, Vehicle Classification (VC), and ADT in tabular form
Summary Tables