Looks like no one added any tags here yet for you.
What is elasticity?
A measure of how sensisitive one variable is to proportional changes to another variable
You can replace the word elasticity to sensitity, and it will mean the same thing in economics.
What is PED and give the formula.
PED is the price elasticity of demand. Basically how sensitive the demand is to changes in price in the same good, ceteris paribus.
PED is given as %Change in Quantity Demanded / % Change in Price.
Note that it refers to proportional changes.
Why is the PED generally negative and
what does it mean when the PED is:
|PED| = ∞
|PED| > 1
|PED| < 1
|PED| = 0
PED is generally negative because when prices increases quantity demanded always decreases (law of demand)
|PED| = ∞ → Demand is perfectly price elastic. Any change in P, infinite change in Qd
|PED| > 1 → Demand is price elastic. Small change in P, big change in Qd
|PED| < 1 → Demand is price inelastic. Big change in P, small change in Qd
|PED| = 0 → Demand is perfectly price inelastic. Any change in P, no change in Qd
Which part of a linear demand curve is the PED elastic, inelastic, and unitary?
PED decreases as you move down the demand curve
What is total revenue?
How do you read the total revenue (or total expenditure from a consumer’s perspective) from a demand curve?
Total revenue/expenditure is P x Q
You can read it from the area of a rectangle that is under the demand curve.
What are externalities?
Effects of an economic activity (can be costs or benefits) experienced by an unrelated third party
How do you read elasticity from a revenue/expenditure vs quantity curve (assuming linear demand curve).
When the total revenue is rising as the Qd increases, the good is price elastic.
When the total revenue it falling as Qd increases, the good is price inelastic
For something which demand is price elastic, how can the firm increase total revenue?
They can lower prices.
To get more revenue firms can either increase Qd or P. When they lower prices for sth that is elastic, the Qd increases in a greater proportion.
For something which demand is price inelastic, how can the firm increase total revenue?
They can increase prices.
To get more revenue firms can either increase Qd or P. Since for sth which demand is inelastic changes in P will not affect the Qd so much, increase P can increase total revenue.
What will a change in price for sth which demand is unitary price elastic do to the total revenue?
The total revenue will not change
(Note: this refers to tiny tiny changes in price. If you tested the above with real numbers, the total revenue will always drop, as technically when sth is unit elastic the total revenue is at its maximum)
The elasticity that A-levels refers to is the point elasticity, not the arc elasticity (which is what you calculate when you take the difference in P or Qd and divide it by the original to calculate %changes in P or Qd)
Give the determinants of PED.
A good’s PED is affected by:
S.P.L.A.T
The availability of Substitutes (whether ppl can switch easily or not)
The closeness of Substitutes (whether ppl can switch easily or not)
Proportion of income spent on the good. (ppl will be more sensitive to “expensive” things)
The degree of its Luxury or necessity. (If you really need sth, you will buy it with less regard to the price.)
Addictive products are generally inelastic
Time period in consideration (ppl will adjust buying patterns with a longer period of time, short term they just buy)
Why should one avoid arguing that sth is price elastic due to its low degree of necessity?
Most things on the market are non-essential.
When you say that sth is price elastic because it has a low degree of necessity, you are saying most things in the market are elastic, which makes the statement more meaningless and too general.
You can argue the converse (that sth is inelastic because of high degree of necessity) because that applies to less goods.
Why should one avoid arguing that because sth has low number of substitutes, it is inelastic?
Something can have low number of substitutes that are very close substitutes, which will make it elastic again.
One should also becareful with the converse arguement, as having a large amount of substitutes that aren’t very close might not make sth elastic.
What are the applications of PED?
Firms can strategise and decide whether to raise prices or not.
The government can predict how consumers will react to price changes, and hence plan whether to tax/subsidise certain products.
They can also consider how a change in tax/subsidy will affect tax revenue.
What is YED and give the formula.
YED measures the degree that quantity demanded responds to changes to income, ceteris paribus
Y refers to income in economics.
YED = %Change in Qd / %Change in P
What does it mean when the YED is:
Positive
Negative
|YED| > 1
|YED| < 1
|YED| = 0
Positive YED means the when income increases, the demand for the good increases, showing that they are normal goods.
Negative YED means the when income increases, the demand for the good decreases, showing that they are inferior goods.
|YED| > 1 → Demand is income elastic.
If YED was positive the goods could be luxury goods (You might buy jewlery if you got richer). If YED is negative it just means that the good is very inferior.
|YED| < 1 → Demand is income inelastic.
If YED was positive the goods could be necessity goods (You wont buy more toilet paper if got richer). If YED is negative it just means that the good is inferior.
|YED| = 0 → there is no relationship between income and demand
What are the appplications of YED?
It is useful for companies to predict how much should they produce in the future (production capacity), based on expectations of people’s future change in income.
Eg, lets say companies think there is a recession coming. If the YED of thier products > 1, it means that they will be affected a lot when people’s income fall, hence they might prepare to produce less things.
It can also inform the firm whether to focus their marketing strategy on inferior or normal goods.
What are the determinants of YED?
Normal/inferior goods
Degree of luxury of a good. (The more luxurious the product, the more sensitive it is to income changes
Overall level income level of the consumers. (The richer people are, the less sensitive they are to the price of things, hence demand changes less proportionally when they experience a change in income)
What is XED and give its formula.
XED is the cross elasticity of demand. It measures the degree which the demand of one product responds to a change in price of another product, ceteris paribus.
XED = %Change in QD of A / %Change in P of B
What does it mean when XED is:
positive
negative
|XED| > 1
|XED| < 1
|XED| = 0
When XED is positive, Products A and B are substitutes (When P of A increases, Qd of B increases)
When XED is negative, Products A and B are complements (When P of A increases, Qd of B decreases)
|XED| > 1 → Products are cross-elastic, if positive, it means A and B are strong substitutes. If negative, A and B are strong complements
|XED| < 1 → Products are cross-inelastic, if positive, it means A and B are weak substitutes. If negative, A and B are weak complements
|XED| = 0 → There is no relationship between A and B
What are the applications of XED?
Firms can use the XED to identify their competitors and respond correctly if they decide to change their price.
If firms sell 2 or more products they can identify which products are complements and hence increase revenue by prioritising the correct ones.
Loss leaders. (Complementary goods, reduce price in one to increase dd in the other)
What are the determinants of XED?
Positive → The closeness of the substitutes
Negative → The strength of the complements
What are the limitations of PED, YED and XED?
To calculate elasticities, data is required. If the data is unreliable, it will make elasticity calculations unreliable too.
The assumption ceteris paribus is unlikely to hold in reality. These elasticities can only investigate the response to the change of specific things, but in the real world there many factors at play that can alter the analysis of the situation.
Ommision of total cost in PED. When using PED, you can only make judgements as to whether total revenue will increase or not. It tells you nothing about total cost, and hence nothing about profit.
PED and XED also do not tell you anything about the production capacities of the firms. While sth can be price elastic, firms may not be able to produce enough to meet the demand.
What is PES and give its formula.
PES is the price elasticity of supply. It measures the degree of responsiveness of quantity supplied to changes in price, ceteris paribus.
PES = %Change Qs / %Change P
Why is PES always positive and what does it mean when it
PES = ∞
PES > 1
PES < 1
PES = 0
PES is always positive because of the law of supply.
PES = ∞ → Supply is perfectly elastic to price.
PES > 1 → Supply is elastic to price. Change in price, supply responds very well. Very easy to supply.
PES < 1 → Supply is inelastic to price. Change in price, supply doesnt respond by alot. Difficult to supply sth.
PES = 0 → Supply is perfectly inelastic to price. No matter the price, the Qd stays the same. This can happen when the time period is too short for sth to be produced.
What are the factors that will affect PES?
PES is all about ease and/or speed of production.
1) Length of production period. The longer it takes to produce something, the more difficult for supply to respond to price, so the PES will be inelastic.
2) Time period in consideration. Note the difference compared production time. Over a longer period of time, companies can build up the supply required. PES is elastic with a longer time period in consideration.
3) Availability of excess capacity. The closer the company is to max capacity, the more difficult it is for the company to supply more in response to a price change. More excess capacity, PES is elastic.
4) Stockability. Whether can companies stockpile the good of not, similar to availability of excess supply, but refers to finished goods.
5) Mobility/availability of factors of production. How easy it is to mobilise the factors of production that is required for production. If it is mobilise the factors of production, PES is elastic.
What are the applications of PES for analysis?
PES can tell you the extent which an increase in demand will cause an increase in price. Consider 2 graphs, one with the SS very steep (inelastic) and another with the SS very shallow (elastic). When the DD curve shifts in the two graphs, look at how the equilibrium price changes.
PES can also help you identify manufactured goods and agricultural goods. (Ease of production!)
What is welfare?
Welfare is the overall wellbeing and happiness of people. Economics primarily investigates how it can be achived through material goods and services.
What is:
Marginal Benefit?
Marginal Social Benefit?
Marginal Social Benefit Curve?
Marginal Benefit - The utility one gains from the additional consumption of a good. (the value of one more unit of good or service)
Marginal Social Benefit - The utility society gains from the adittional consumption of a good.
Marginal Social Benefit Curve = Demand curve
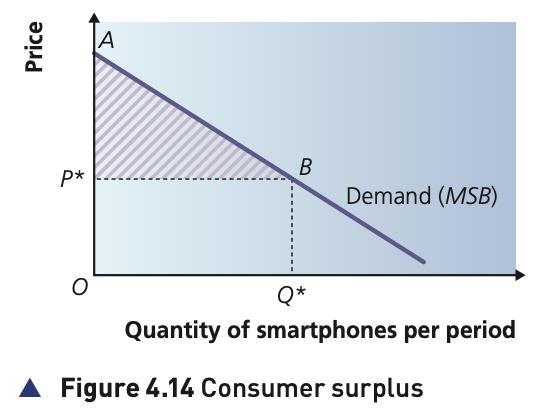
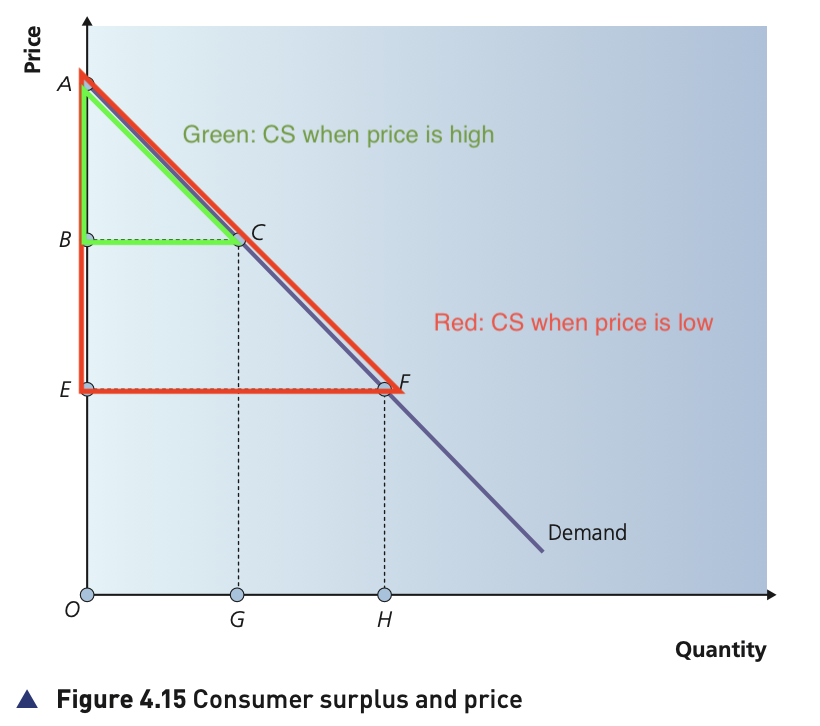
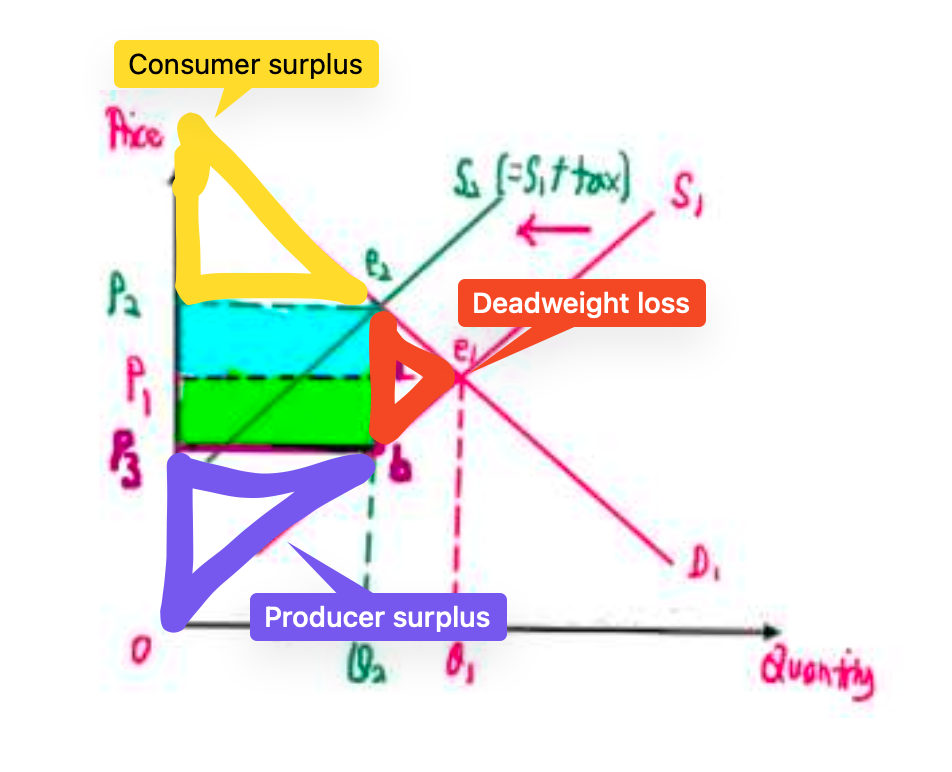
What is consumer surplus?
The value that consumers gain from consuming good and service over and above the price paid.
The difference between the price consumers are willing and able to pay and the price they actually paid for the good or service.
Consumer surplus is the welfare gained by the society by consuming the product, over and above the price they paid.
Where on a graph can we read the consumer surplus?
The area underneath the demand curve and over the price, bounded by the quantity demanded.
What happens to consumer surplus when price:
Increases?
Decreases?
Price Increases - CS decreases, less people will be able to buy the good with extra welfare
Price Decreases - CS increases, more people will be able to buy with extra welfare
What is producer surplus?
The difference between the price producers actually recieve and the price they were originally willing and able to sell of a good or service.
PS represents the benefit gained by firms over and above the price at which they would have been prepared to supply a product.
What is:
Marginal cost?
Marginal Social Cost?
Marginal Social Cost Curve?
Marginal cost it the additional cost required to make one more of a good or service. It is the minimum price producers must receive to be willing and able to receive one more of the good. A profitability threshold.
Aggregate of all the MC of producers is MSC
Marginal Social Cost Curve = supply curve
What is society surplus?
Total surplus enjoyed by producers and consumers (Also consider the Government. Tax revenue is added to the surplus and subsidies and deducted.
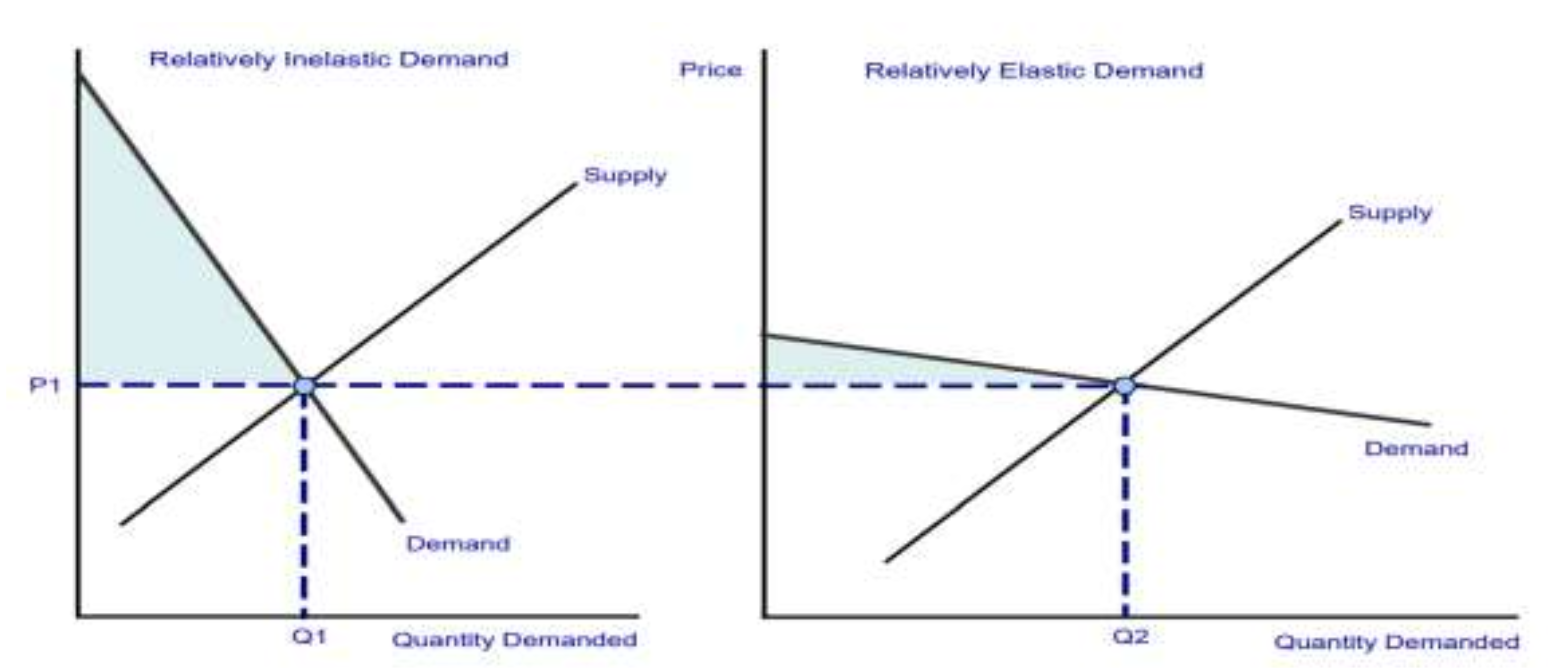
What is the relationship between PED and consumer surplus?
If the PED is generally inelastic, CS is larger.
If PED is generally elastic, CS is smaller
What is the relationship between PES and producer surplus?
If PES is generally inelastic, the producer surplus is larger
If PES is generally elastic, the PS is smaller
How do changes in demand affect the entry and exit of firms into a market?
If demand increases, equilibrium price increases, and PS increases. Firms will be attracted to enter this market, which increase supply. Equilibrium price will fall back down.
If demand decreases, equilibrium price decreases, and PS decreases. Firms will be attracted to exit this market and look for profits elsewhere , which decrease supply. Equilibrium price will climb back up.
What is a deadweight loss?
A fall in total surplus due to market distortions. An artifact of allocative inefficiency or excess burden.
What are some ways that the government can reduce income and wealth disparity?
Direct and indirect taxes
Tranfer payments
Minimum wages
State provision of essential goods and services
What is the diference between income and wealth?
Income refers to the flow of money. The flow of wages, salaries & earnings from other sources in a period of time
Welath refers to a store of money or assets. The stock of accumulated assets
Having a high inflow doesnt mean you have a large store.
What is the difference between equality and equity?
Equality means everyone is treated the same. (Sameness)
Equity means everyone in the same situation is treated the same. (Fairness)
NOTE: Economists may sometimes call equal income distribution as an equitable income distribution
Why does a market economy not result in an equal income distribution?
In a market system, how much you own and how much of the factors of production you own determines your income. (Duh, the more wealth you have, the more you can generate income.)
Since some ppl have more stuff than others, then some ppl will have more income than others.
What is the difference between horizontal and vertical equity?
Horizontal equity means “equal treatment of equals'“ those in the same situation should get the same treatment (eg same income, same tax)
Vertical equity means if you have more, you should contribute more. (More income, more tax)
Two principles work hand-in-hand with each other
Give an example of a tradeoff between equity and efficiency
Methods to achieve alllocative efficiency (through taxes and subsidies) may affect certain groups more disproportionately than others.
A specific tax on cigarretes will affect the poor more than the rich (As the tax is not proportional to their income.
What are progressive taxes?
Progressive taxes are taxes where the marginal tax rate rises with income.
Those who earn more, pay more taxes
What are regressive taxes? Give an example.
Regressive taxes are taxes that will affect the poor more than the rich.
Specific indirect taxes are regressive.
What is the marginal tax rate?
The tax on additional income. It is the amount of additional tax paid divided by an change in income.
What are the pros and cons of specific taxes?
Pros: It is easy to implement
Cons: they are regressive (average tax rate rises as income drops)
What are the pros and cons of income taxes?
Pros: can help reduce the income gap
Cons: decentivises people from high paying jobs, (as they are going to be taxed!)
Diferrences between proportional taxation, progressive taxation, and regressive taxation? (Relate with marginal rate)
Proportional taxation: Same proportion of tax no matter the income. Rich and poor pay the same proportion (Not amount!). Marginal rate (tax on additional income) is constant.
Progressive taxation: Increasing proportion of tax as income increases. Marginal rate increases as income increases. Rich people pay a larger proportion than poorer people.
Regressive taxation: Tax burdens low income households more than higher income households. Marginal rate decreases as income increases.
what are transfer payments?
Income or payment made in which no goods or services are being paid for.
E.g. government benefits.
Pros and cons for minimum wage and price controls?
Pros: Minimum wage can protect workers and price controls can protect consumers.
Cons: Companies may layoff workers and unemployment can rise. Deadweight loss can occur with price controls.
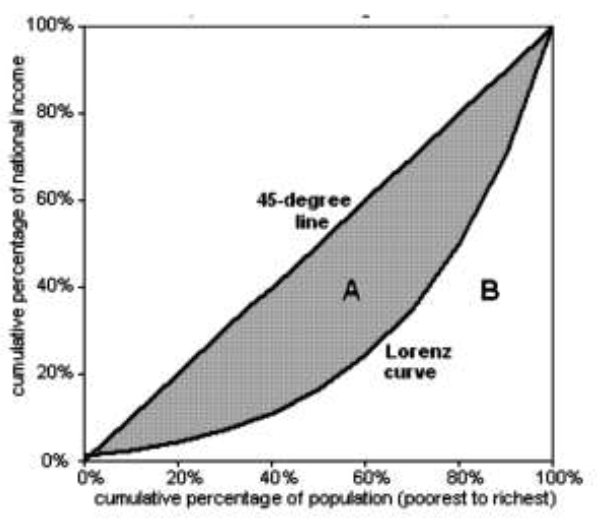
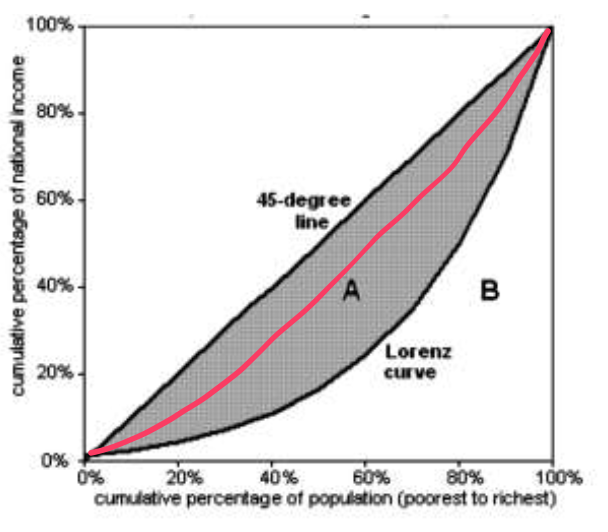
Decribe the graph with a lorenz curve. (Axis lables and 2 curves
Y axis is the cumulative percentage of national income, x axis is the cumulative percentage of population.
The straight line is the line of absolute equality, and the curve is the lorenz curve.
What is the gini coefficient? How to calculate it?
What does a gini coefficient = 1 mean?
What does a gini coefficient < 1 mean?
What does a gini coefficient = 0 mean?
It is a measure of equality in income distribution. It is namely A / A+B
Gini coefficient < 1 means there is some inequality.
Gini coefficient = 1 means absolute inequality, 1 person owns 100% of the national income.
Gini coefficient = 0 means absolute equality, or no inequality.
The closer to 0, the more equal income is distributed.
What happend to the lorenze curve if the gini coefficient gets closer to 0
It gets closer to the line of absolute equality
What are the causes of income and wealth inequality?
Labour market explanation
Different jobs are valued differently at different times, so people will get paid differently. Higher skilled workers will be paid more than lower skill ones.
Inheritance
Some people will get an advantage over others due to family wealth that is accumulated over generations. More wealth means a higher capacity to generate more income.
Demographic changes
If the demographic of the country ages, young people will have to work to support the pensions of the older generation. Taxes could then burden a portion of society more than another.
What are the ways (5) that the government can intervene in a market?
Taxes and Subsidies
Maximum and minimum prices
Direct provision of public goods
Buffer stock schemes
Direct provision of information
What problems do taxes and subsidies solve?
Taxes can tackle overconsumption of demerit goods
Subsides can tackle underconsumption of merit goods.
What problems do maximum and minimum prices solve?
Maximum prices are supposed to protect consumers. E.g. rental.
Minimum prices are supposed to protect “producers”. E.g. minimum wages.
What problem does the direct provision of public goods solve?
The lack of public goods due to the free rider problem.
What problem does a buffer stock scheme solve?
Volatility. So that prices can be stable.
What problem does the direct provision of information solve?
Imperfect information
What is market failure? When does it happen?
A situation where an unregulated price mechanism fails to allocate resources to achieve the best outcome for society.
Happens when there is:
Underallocation (which can happen with merit goods.
Overallocation (which can happen with demerit goods).
Or no allocation (which can happen with the non provision of public goods.).
What is the free rider problem?
The free rider problem is something that arises with the provision of public goods in market economies. It is the problem that arises with the non-excludability of public goods.
Firms cannot prevent non-payers from enjoying the good, so it is impossible to charge a price on its use, as no one will want to pay for it.
What problem does the non-rival quality of public goods pose in market economies?
The good doesnt diminish with consumption. This means if a company sold one public good to one person, other people who didn’t pay for it can also enjoy it, so the marginal cost for the good is zero, and firms can only charge zero for such a good, but no firm will want to supply the good then.
How to think about the problems of non-rivalry and non-excludability of public goods in market economies
Non-rivalry: consequence is only price can be charged is 0, so firms dont want to supply it.
Non-excludability: free rider probelm, consequence is consumers dont have to pay for it, so consumers wont want to pay for it.
Refer to previous flash cards for more detail.
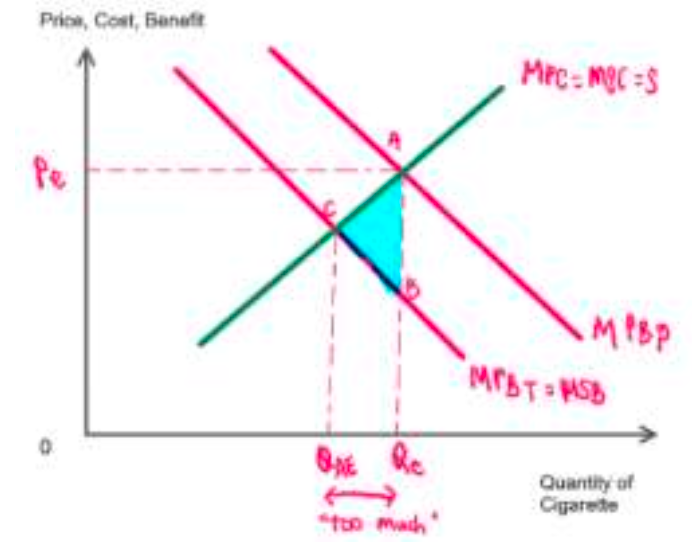
How can overconsumption of demerit goods be displayed on a graph?
There will be 2 demand curves. The percieved Marginal Social Benefit (right) and the true Marginal Social Benefit (left).
The quantity demanded is too much. The shaded region represents how much people are overpaying for the good (The deadweight loss)
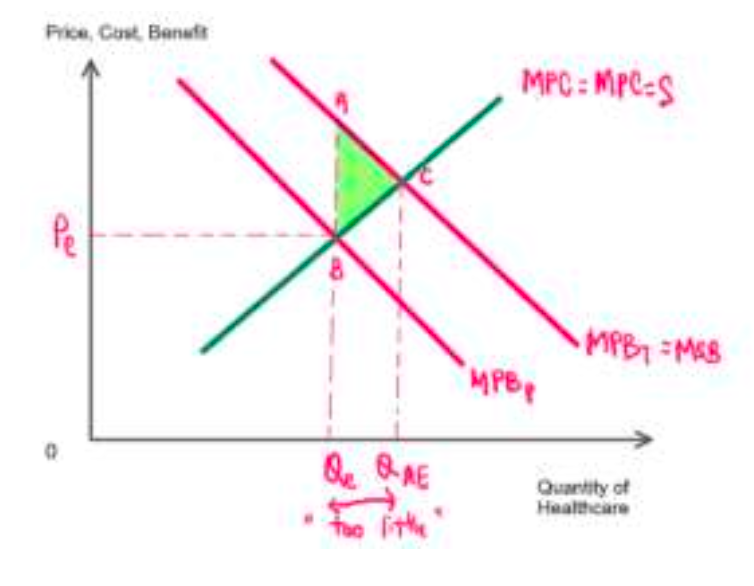
How can underconsumption of merit goods be displayed on a graph?
There will be 2 demand curves. The percieved Marginal Social Benefit (left) and the true Marginal Social Benefit (right).
The quantity demanded is too little. The shaded region represents how much people are underpaying for the good, or how much society stands to gain.(The deadweight loss)
What are indirect taxes?
Taxes levied not directly on income, but on expenditure on goods or services. Paid through the sellers
What is the marginal rate of taxation?
What is the average rate of taxation?
marginal rate of taxation =
percentage change in tax / percentage change in income. x100
Average rate of taxation=
tax paid / income
what are direct taxes?
Taxes that are levied on the individual, perhaps through income.
Specific taxes vs ad valorem taxes.
Specific taxes apply a fixed amount of tax per unit good.
Ad valorem taxes apply a taxes a percentage of expenditure. The more you spend, the more you pay.
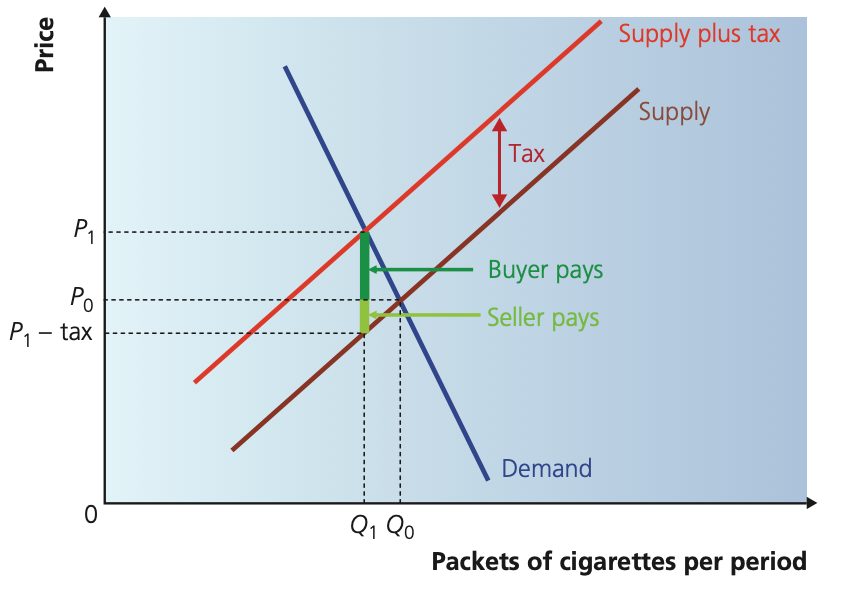
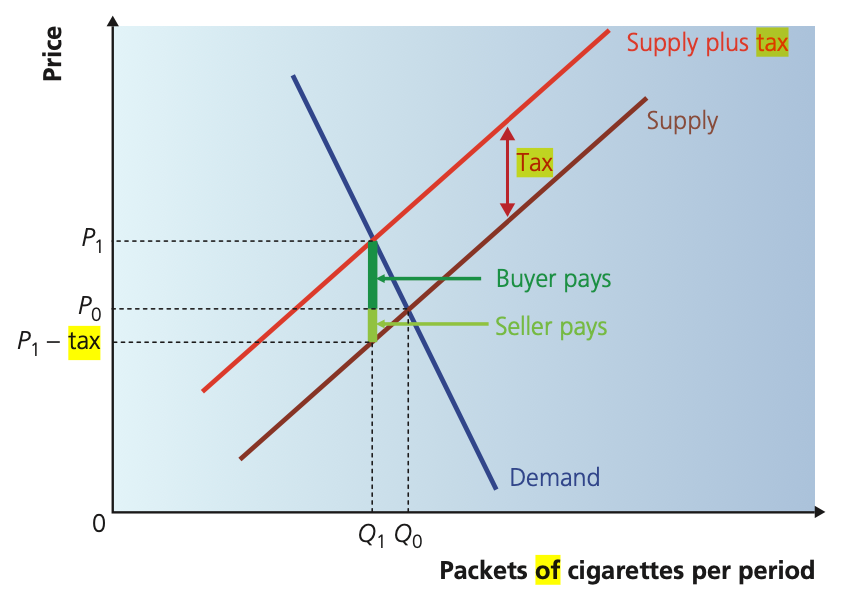
How does an indirect tax affect the market and how can it be illustrated on a graph?
When an indirect tax is levied on a good, the cost or production increases. As such, the supply curve will shift up by the amount of tax that is levied (hence the curve can also be said to shift left). The equilibrium price will rise. Quantity demanded will decrease.
Dont worry about incidence of tax. The flashcard will come.
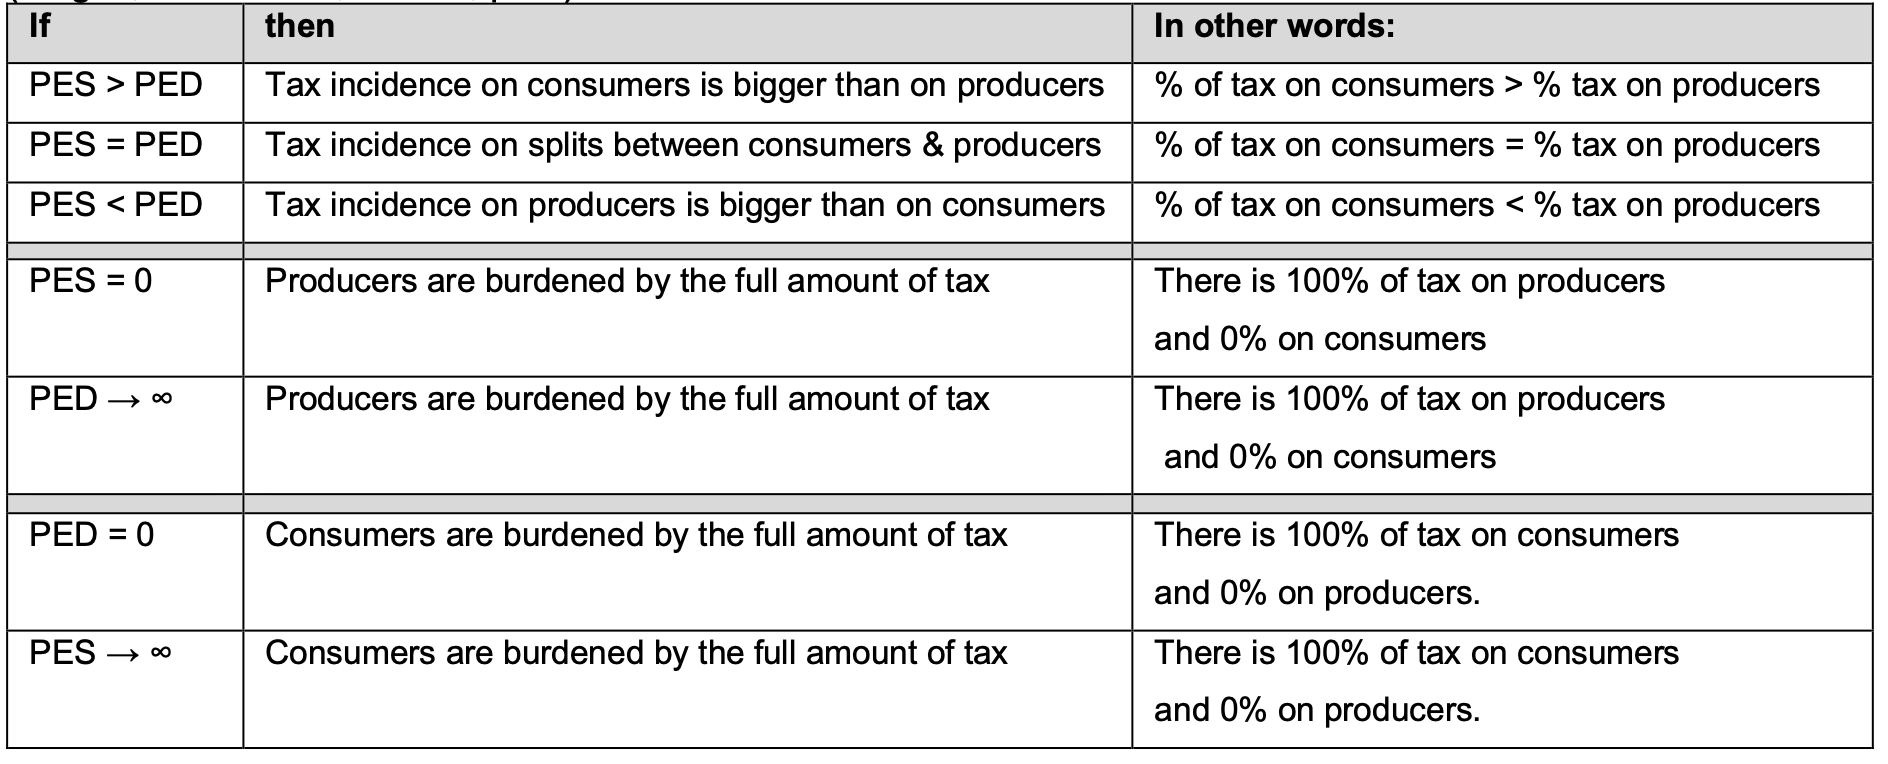
What is the incidence of tax?
How can it be calculated?
The incidence of tax refers to where the burden of an indirect tax is situated, on producers or consumers.
Incidence of tax is related to PED and PES. The more elastic one is relative to the other will pay less tax.
PES/PED = Tax on Producers/Tax on Consumers
How can the incidence of tax be displayed on a graph?
Note the new equilibrium price. The difference between the new price and the old price will be the amount of tax that falls on the consumer.
Take the magnitude of tax and subtract the tax paid by the consumer will give you the tax that falls on the producer.
You can hence see how the incidence of tax relies on the relative gradients of the two curves. You can also see that the producers will ofc try their best to pass the tax on to consumers. But all of this is due to market forces.
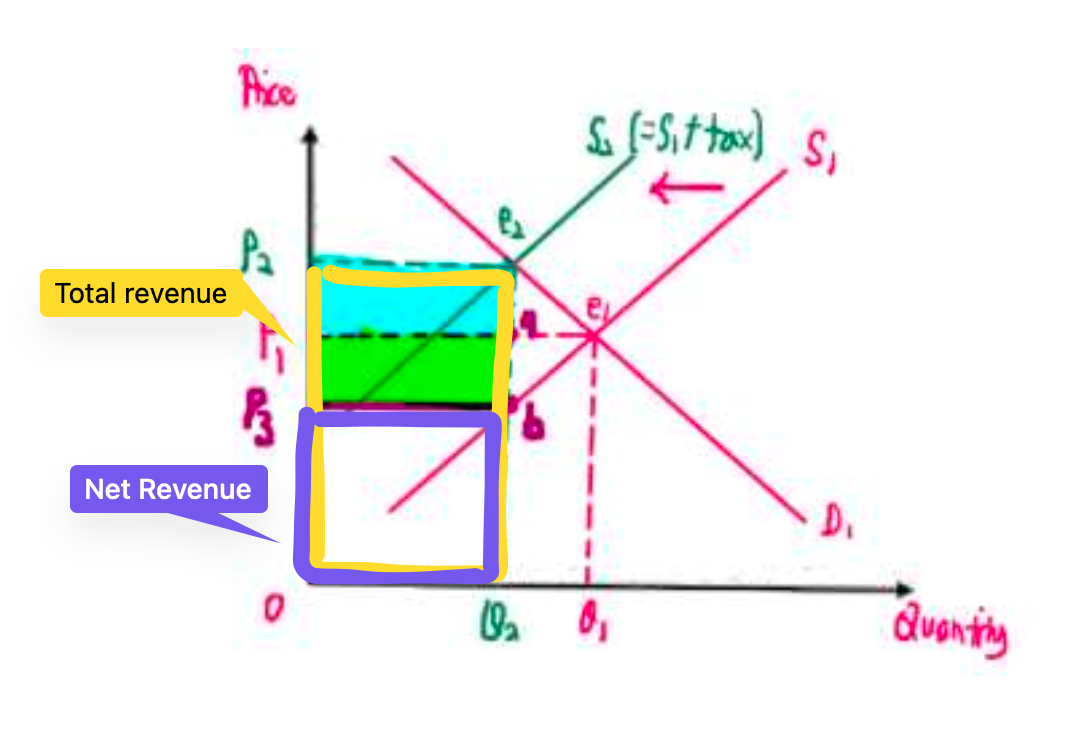
How can we read the tax revenue from a graph?
Multiply the amount of tax (vertical distance between the old and new supply curves) and the new quantity demanded.
You can also see the total incidence of tax as well.
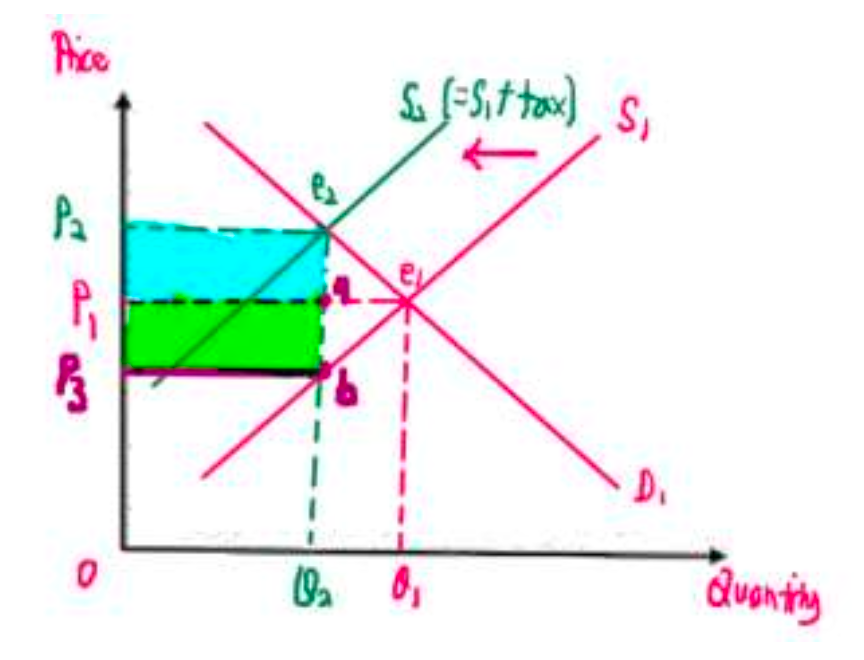
Where are the CS and the PS after taxes?
What is Total Social Surplus before and after tax?
Where is the deadweight loss due to the tax?
After tax, both CS and PS should decrease.
Total social surplus is the sum of the CS, PS, and Government Tax revenue.
Take the total social surplus before taxes and subtract the total social surplus after taxes you get the deadweight loss (Try it yourself!) represented in the little triangle.
What is a deadweight loss?
A loss in total social surplus, social welfare. Market is inefficient and away from optimum due to market distortions
How do you read total revenue and net revenue after tax?
Look at the new price and new quantity demanded. Multiply them to get total revenue.
Net revenue is revenue after taxes. So subtract the area from tax revenue.
If the consumers (PED) are more elastic than producers (PES). Who will pay more of the indirect tax?
Producers.
Think of it as a game of chicken. The more elastic you are, the more quickly you will “chicken out” with price changes, forcing the other person to pay the tax. More elastic, pay less tax. Less elastic, pay more tax.
Also helpful to think about gradients.
When will the consumers take the full burden of tax?
When PED = 0 Consumers super inelastic
Or when PES = ∞ Producers super elastic
Draw graph!
When will producers take full burden of tax?
When PES = 0 Producers super inelastic
Or when PED = ∞ Consumers super elastic
Draw graph!
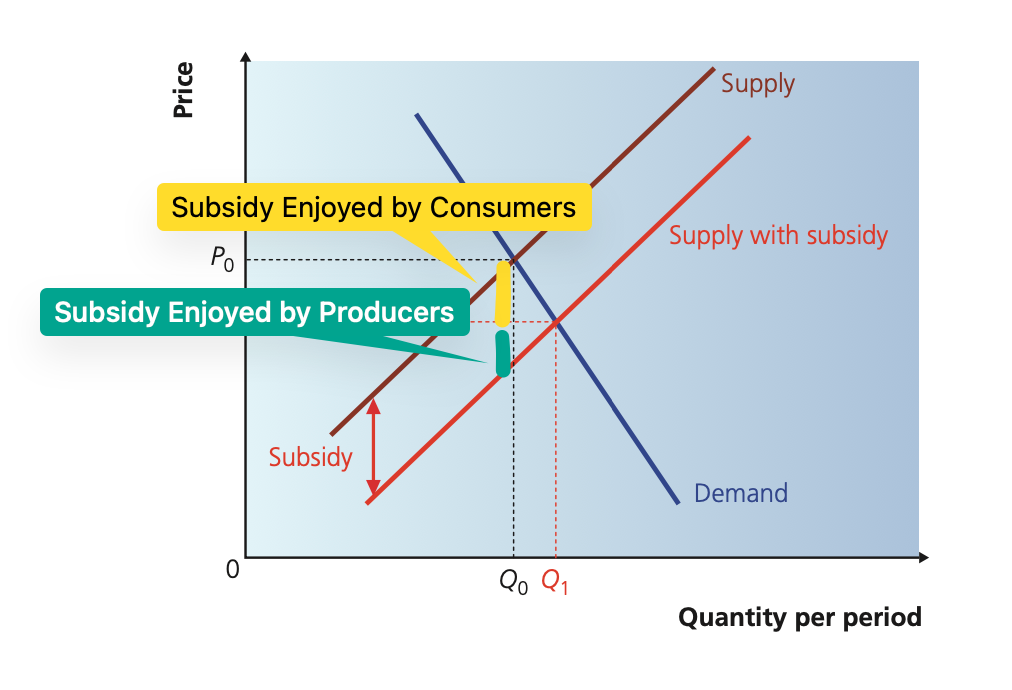
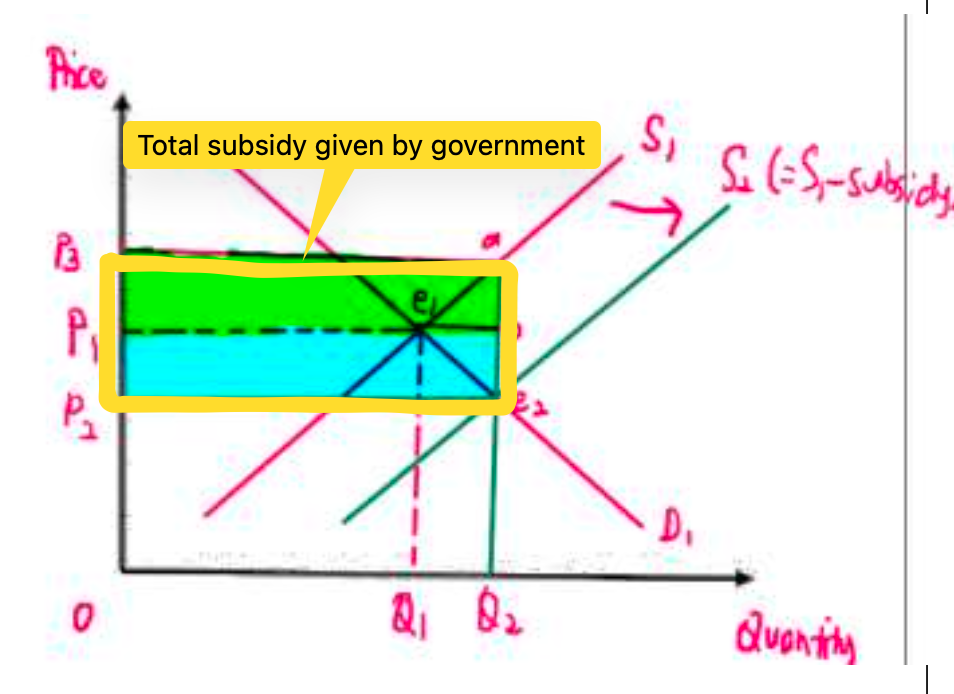
Where can we read the incidence of subsidy on a graph? (Of a single price)
The difference between the old and new price is the subsidy enjoyed by the consumers.
Take that and subtract it from the amount of subsidy given to get the subsidy enjoyed by the producer.
How to read how much the government is spending in subsidies?
Multiply the subsidy per unit with the new quantity demanded.
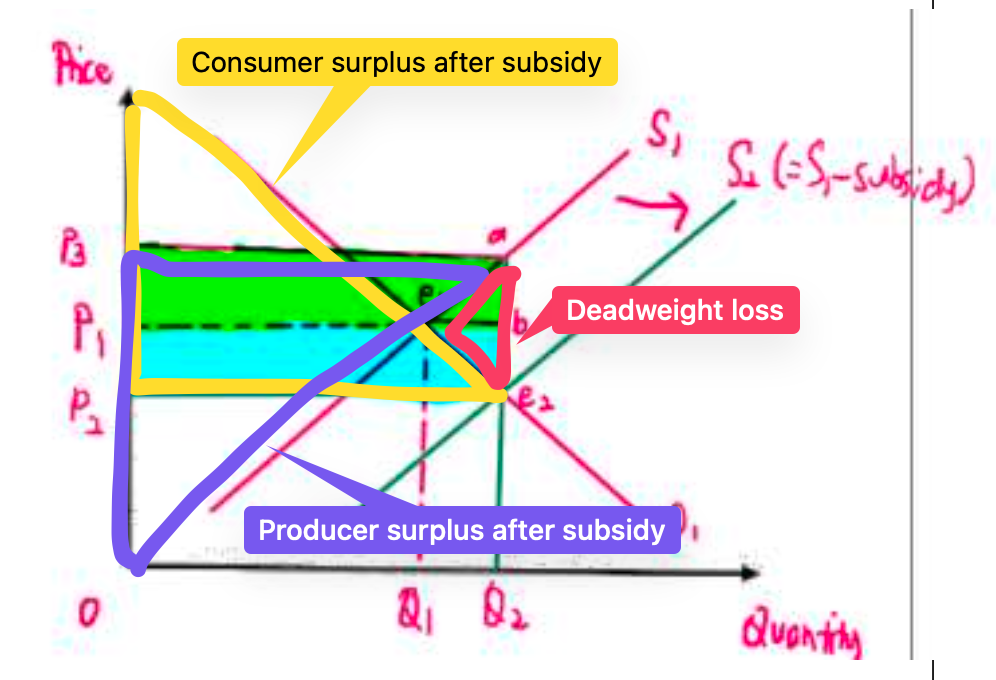
What happens to CS and PS after a subsidy?
What happens to total society surplus after a subsidy?
Where can we read the deadweight loss?
CS and PS will increase
Total Society Surplus will decrease. After you subtract the cost of the subsidy from the new CS + PS you will see that the govern will have to pay extra that is enjoyed by no one, represented by the area of the triangle.
Deadweight loss is the little triangle.
What are the chain of events that will happen when indirect taxes are removed?
Remove taxes, cost of production decreases, supply increases, price drop and quantity increase
What are the chain of events that will happen when subsidies are removed?
Remove subsidies, cost of production increases, supply decreases, prices rise and quantity decreases.
Downsides to indirect taxes
Indirect taxes tend to be regressive, (especially specific taxes) because it affects those with lower income more than those with higher income.
If taxes are used to reduce sale of demerit goods, it may not be completely effect if the good is addictive.
There will be a deadweight loss.
Downsides to subsidies
Subsidies incur an opportunity cost to the government. They cannot subsidise everything.
Subsidies may not be able to encourage the public to consume more of the merit good if the PED is ver inelastic, perhaps due to
there would be a deadweight loss.
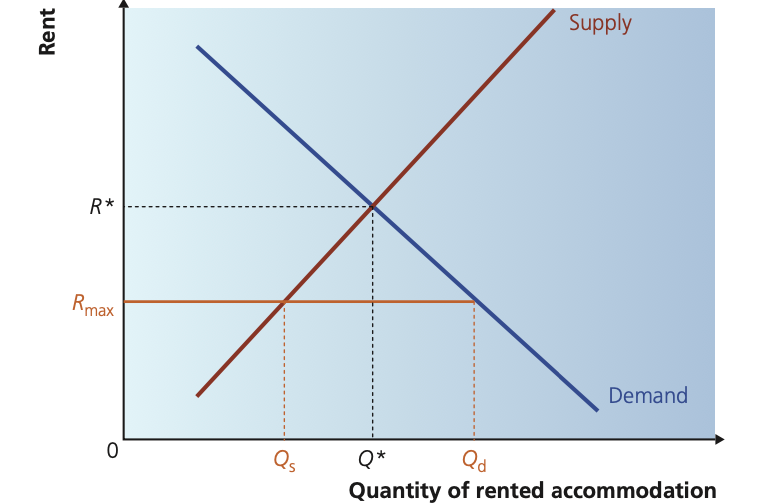
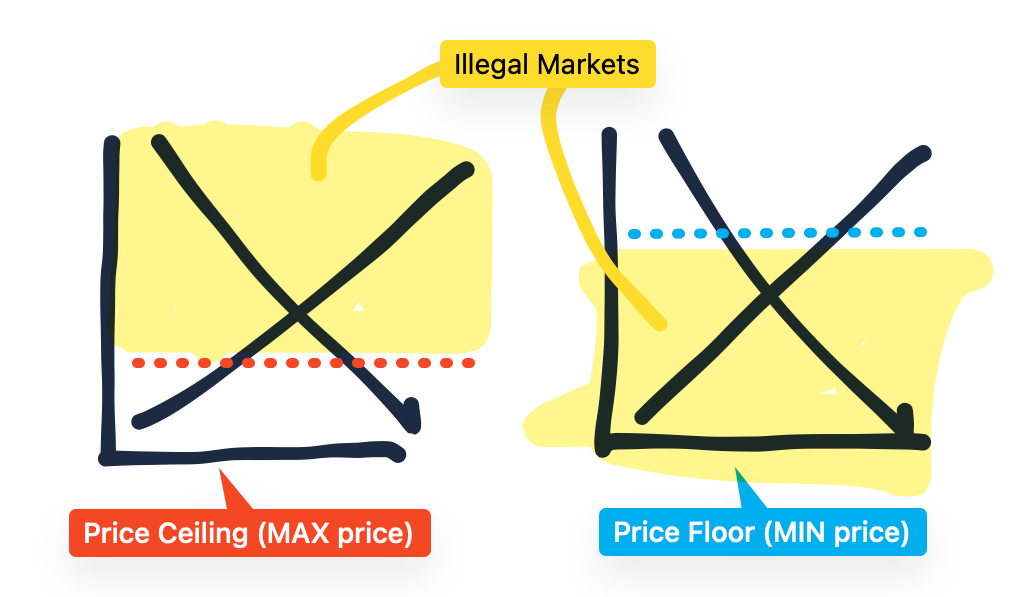
What impacts does a maximum price impose on the market?
A price ceiling will cause a shortage in the market as demand will outstrip supply.
The rationing function of prices will fail, causing some people who are willing and able to buy the good to not be able to buy it because of the shortage. First come first serve or coupons might be used.
As such an illegal market may emerge.
There will be overall welfare loss.
Goods are not efficiently allocated
What are maximum prices for?
They are typically used to protect consumers.
Example: price cap on essential goods and on rental
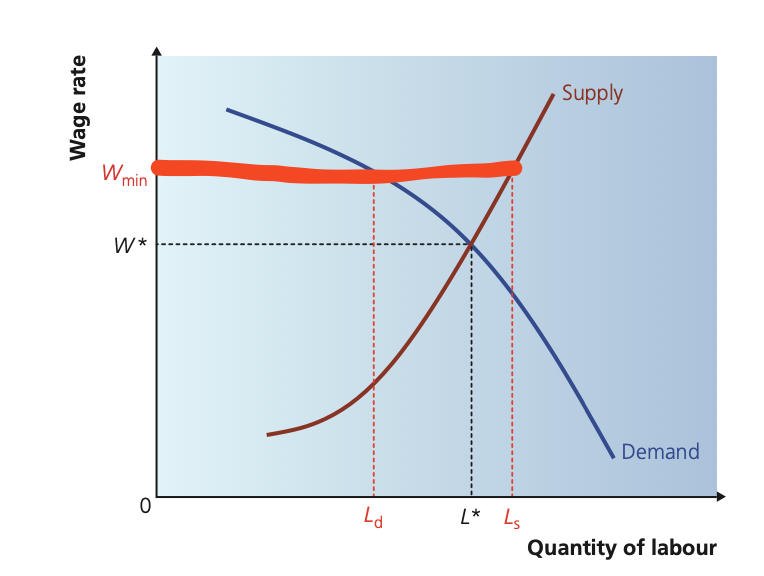
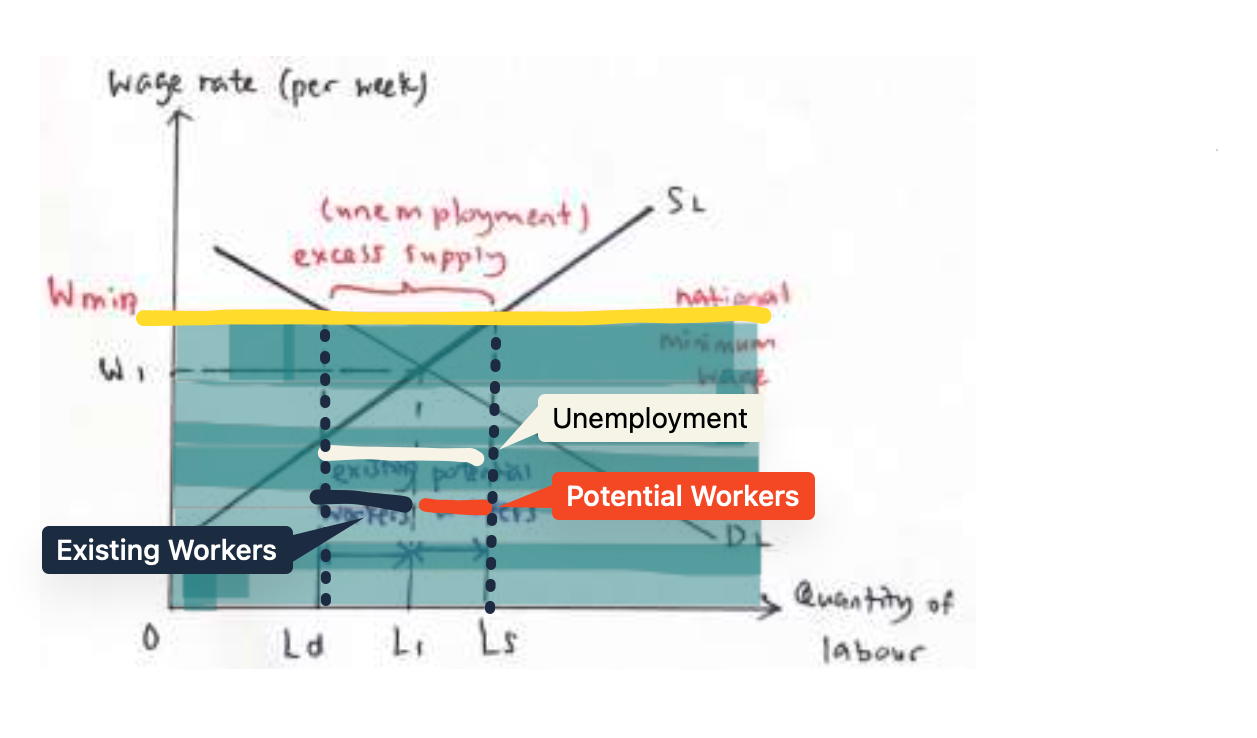
what impacts does a minimum price impose on the market?
A price floor will cause a surplus in the market as supply will become more than demand.
The surplus will have to be dealt with. Either they are destroyed or the governments sells them elsewhere. Such policies can burden the taxpayer.
As such an illegal market may emerge.
There will be overall welfare loss
Scarce resources will be allocated inefficiently.
what are minimum prices for?
To protect the producers.
Example: minimum wage.
How do you represent a ceiling price on a graph?
A line below equilibirum price.
How do you represent a floor price on a graph?
A line above equilibrium price.
Which regions of in a graph that shows a price ceiling or a price floor represent the black/illegal market?
For price ceiling, everything that is above the price ceiling is illegal.
For price floor, everything that is below the price floor is illegal.
What are the downsides of a minimum wage?
Imposing a minimum wage can cause existing workers to be laid off, and an oversupply in the labour market, potentially causing unemployment.
What are the downsides of a rent cap?
Imposing a rent cap can cause the supply of houses to let to drop, leading to shortage on housing, which is not good for the renter.
What is a buffer stock scheme?
A buffer stock scheme is where the government buys up extra stock when there is excess supply and sells the extra stock when there is a shortage. This is to prevent prices from fluctuating from too much due to fluctuations of demand or fluctuation of price.