Psych Stats Ch.3 Frequency Distribution and Percentiles
1/8
There's no tags or description
Looks like no tags are added yet.
Name | Mastery | Learn | Test | Matching | Spaced |
|---|
No study sessions yet.
9 Terms
Relative Frequency
The proportion of the times the score occurs
symbol: rel. f
Tells you how each number relates to the whole set of numbers
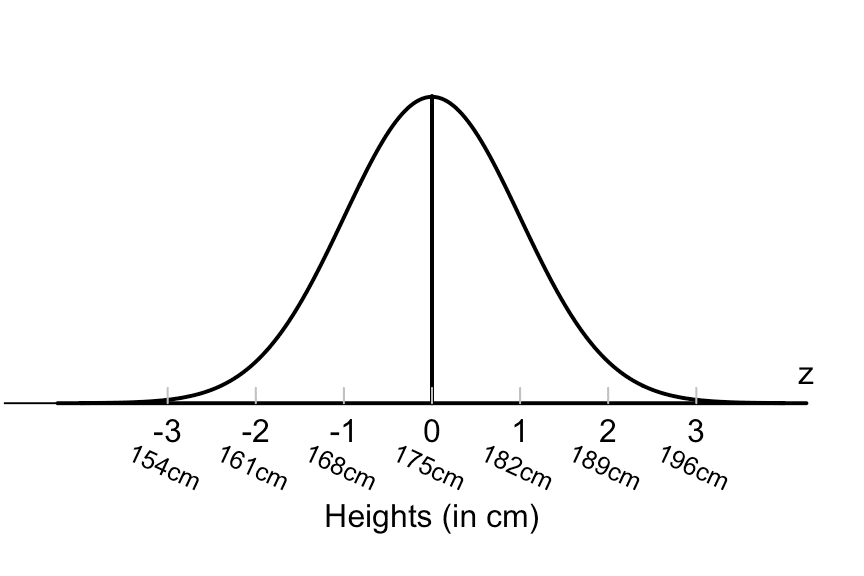
Normal Distribution
Bell-shaped curve
Called the normal curve or a normal distribution
symmetrical
the far left and far right portions containing the low frequency extreme scores are called the tails of distribution
Positively Skewed Distribution
Simple Frequency Bar Graph
Used for nominal and ordinal data
space between the bars show discrete measures
Rectangular Distribution
Symmetrical distribution shaped like a rectangle
Bimodal Distribution
A symmetrical distribution containing two distinct humps
Skewed Distributions
not symmetrical as it only has on pronounced tail
a distribution may be either negatively or positively skewed
Histogram
Used for a small range of different interval or ratio scores
A Frequency Polygon
Used for a large number of different scores