APES 3.6 Age Structure
1/15
There's no tags or description
Looks like no tags are added yet.
Name | Mastery | Learn | Test | Matching | Spaced |
|---|
No study sessions yet.
16 Terms
Why has the human population begun increasing?
Increased agricultural productivity
Improved sanitation and waste treatment
What sociocultural factors influence human populations?
Economic health
Geopolitical conflicts
Healthcare
Education
Birth control
Demographer
Scientist in the field of demography that:
Studies population trends through size, fertility, life expectancy, and migration
Offer insight into why population changes and how humans influence those changes
Crude Birth Rate
# of births / 1000 individuals per year
Crude Death Rate
# of deaths / 1000 individuals per year
Global Population Growth Rate
(CBR - CDR) / 10
Written as %
Net Migration
Positive Net Migration: More immigrants than emigrants
Negative Net Migration: More emigrants than immigrants
National Population % Growth Rate Equation
[(CBR + Immigrants) - (CDR + Emigrants)] / 10
Inputs - Outputs
Life Expectancy
Average # of years an infant born in a particular country and year is expected to live
High expectancy: More developed nation
access to health care
better living conditions
consumerism
environmental impact
Disease
Substantial regulators of human populations
Heart Disease: Leading diseases in developed nations
Infectious Diseases: Leading diseases in developing nations
HIV
Virus that attacks immune system
AIDS
Condition caused by HIV where immune system becomes severely weakened
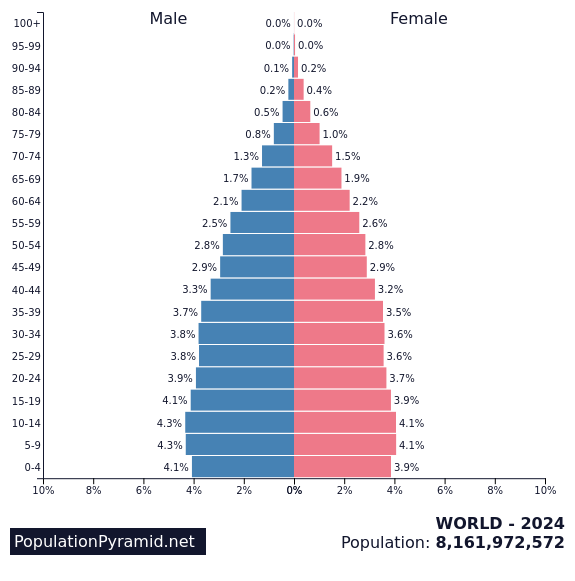
Age Structure Diagram / Population Pyramid
Shows distribution of ages in a certain population based on sex
x-axis: Each side = male or female + population size or %
y-axis (Center): Age groups based on female reproductive ability
Pre-reproductive: 0-14 yrs Tend to not bear children
Reproductive: 15-45 yrs Can bear children
Post-reproductive: 46+ yrs Declining fertility
Shows future pop changes
Majority Pre-Reproductive (Bottom-Heavy)
Population grows quickly
~Developing Nation
High CBR/CDR
Reproducing longer
Agricultural economy: Young workforce
ex. India, Brazil, Nigeria, Mexico
Majority Reproductive (Middle-Heavy)
Stable population growth
Wealthy nation
Industrial economy
Reproduce later: women’s rights + education = reduced fertility rates
Relatively even age groups + CBR/CDR
ex. US, Canada, Australia, Sweden
Majority Post-Reproductive (Top Heavy)
Declining population
Economically/Socially developed / Highly educated
Long-term social services
Little reproductive women to replace aging population
ex. Germany, Japan, Italy, Russia