Ch3 - Bivariate Data
1/25
There's no tags or description
Looks like no tags are added yet.
Name | Mastery | Learn | Test | Matching | Spaced | Call with Kai |
|---|
No analytics yet
Send a link to your students to track their progress
26 Terms
response varaible
measures the outcome of a study (dependent variable)
explanatory variable
attempts to explain the overserved outcomes (the independent variable)
describing a scatterplot
look for the overall pattern & striking outliers
describing/interpreting a scatterplot sentence
1 sentence: There is a [strong/moderate/weak] [positive/negative] [shape] relationship between [x-context] and [y-context]. There [do/do not] appear to be any outliers.
strength (strong/moderate/weak) r-value
dir (pos or neg assoc)
shape (clusters, linear, curved, quadratic, log, etc)
if dir. is pos. r is pos.
state outliers
context
pos association is
between 2 variables: when x axis variable increases, y axis variable increases
neg association
between 2 variables: when x axis variable increases, y axis variable decreases
correlation
r → measures dir & strength of the linear relationship between 2 quantitative variables
not impacted by stretch/shrink (like z its standardized)
impacted by outliers
can only discuss r see data/know linear
interpret/describe correlation
There is a [strength], [direction] linear relationship between [variable1] & [variable2].
facts abt correlation
R
no distinction between explanatory (dependent) and response (independent)
both variables must be quantitative (makes no sense w/ categorical)
r has no units bc its standardized (ie z score doesn’t have units)
the sign of r matches the sign of slope
-1 <= r <= 1
r only measures strength & dir thru linear relation (correlation = 0 does not mean no relation just not linear ie circle)
correlation does not equal causation (only tru when random assignment)
y hat = a +bx
Least Squares Regression Line LSRS
y hat = predicted value
a = y-int (y coordinate)
b = slope
linear relationship
interpret/describe predicted value (y hat)
[y-hat] is the predicted value of [response variable y] when [explanatory variable] is [input amount].
interpretations =
“predicted”
Extrapolation
is the use of a regression line for prediction far outside the domain & range of the data to obtain the line
usual = inaccurate predictions
a residual is
the diff between the observed value & the predicted value (regression line)
residual = y - y hat
actual - predicted value
a good regression line makes residuals as small as possible
interpret/describe residual
The actual/true [y-context] is [higher/lower] than the predicted [y-context] by [residual].
interpret/describe the slope of a regression line
(b): As [explanatory variable] increases by one [unit], the predicted [response variable] [increases/decreases] by [b] [units].
interpret/describe the y-int of a regression line
(a): When [x-context] is zero, the predicted [y-context] is [a] [units].
interpret/describe the standard deviation of the residuals
When using the LSRL, the predicted number of [y-context] is typically [s units] off from the actual number.
A Least Sqaure Regression Line
(LSRL) tries to minimize the sum of the squared residuals (as small as possible)
the mean of the residuals is always 0
the LSRL always goes thru the point (x bar, y bar)
use for summary data
defining y hat
y hat = “predicted __ units”
Calc Steps (LSRL)
Stat → calc → option 8
stat → calc → option 8 → store rest → var → y → 1 (graphs line)
use when given table data
r²
coefficient of determination: the square of the correlation coefficient describes the strength (not dir.) of a linear relationship
measures how closely the points fall to the LSRL
r² =
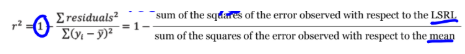
interpret/describe the coefficient of determination
About [r2] % of the variability in [y-context] is accounted for by the least-squares regression line.
residual plot
is a scatterplot of the residuals agaisnt the explanatory variable → if it is linear there will be a random scatter on plot
residual plot on calc
run linear regression!
2nd statplot → 1 → Xlist (list of explanatory, 1) → Ylist → 2nd stat → bottom!