IRT (class 9)
1/51
There's no tags or description
Looks like no tags are added yet.
Name | Mastery | Learn | Test | Matching | Spaced |
|---|
No study sessions yet.
52 Terms
Item Response Theory (IRT): Core Assumptions (3)
Assumption 1 — True Score Exists (defined) on a Latent Trait Dimension (not observed scotes)
Assumption 2 — Items and People Share the Same Latent trait Scale (dimension)
Assumption 3 — Item Properties are Sample-Independent
IRT Assumption 1 — True Score Exists on a Latent Trait Dimension (3)
A person's true score defined on the latent trait dimension (rather than observed score as in CCT)
it is a point on a latent (unobservable) trait continuum
The mathematical model estimates that trait level based on how likely someone is to endorse (e.g., get correct) test items
True score does not depend on the sets/number of items administered the test, so if we change the items, the person’s underlying trait level stays the same
IRT Assumption 2 — Items and People Share the Same Latent Scale (4)
(test) Items have measurable properties placed on the same latent dimension as the person’s trait
ex. hard items are located high on the ability scale, easy items sit lower on that scale
If you correctly answer harder items → model infers you are higher in the trait
If only easy items → lower on the trait
The specific item(s) you endorse tell us how much of the trait you possess
IRT Assumption 3 — Item Properties are Sample-Independent (3)
item properties (difficulty and discrimination) do not change across different groups
ex. Items should function the same whether given to: children vs adults, different cultures or demographics
Tests can be used across many populations while measuring the same trait
No more needing new norms for every group to interpret scores
comapre and contrast IRT benefits with CTT limitations*
Problem in CCT | How IRT Solves It |
Adding/removing items changes true score | True score = stable latent trait estimate |
Items treated as parallel/exchangeable | Items have unique quality and difficulty parameters |
Reliability assumed constant | Reliability can vary depending on ability level |
Scores sample-dependent | Item properties are stable across samples *sample independant |
Summary of IRT Assumptions
True score is a latent trait estimate, not an observed sum score
Items are not parallel and not equally reliable
Knowing an item’s characteristics allows us to:
Infer a person’s true trait level
Mix and match items freely → still measure the same construct
Item functioning stays consistent across diff populations (cultures & demographics)
📌 So the test can change — but the measured trait does not
One-Sentence Takeaway: IRT places both people and items on the same latent scale, allowing us to estimate a person’s true trait level accurately and fairly — no matter the sample or item set.
What is Item Response Theory (IRT)? (3)
A family of mathematical models that describe the probability of a given response to an items as a function of certain item properties and respondent true score
Item Response Theory (IRT) is a family of mathematical models that explains the probability of a person’s response to an items based on:
1⃣ The person’s true score (level) on a latent trait (e.g., ability, anxiety, attachment)
2⃣ The characteristics of the item itself (e.g., difficulty, discrimination)
*How IRT Works in Practice (4)
You can think of an IRT model like: ✅ A regression model that predicts the probability of a response based on latent trait + item characteristics (3)
➡ The model estimates item parameters (e.g., difficulty & discrimination)
➡ and a person parameter (trait level)
📌 So IRT doesn’t rely on raw scores — it uses the pattern of item responses to estimate the trait.
*Types of Items IRT Can Handle (3)
Type of Item | Example | Used in |
Dichotomous (2 options) | yes/no, correct/incorrect | Cognitive ability tests |
Polytomous (3+ options) | Likert scales (1–5), frequency | Personality & attitude questionnaires |
IRT is not limited to IQ or test performance — it is also used for psychological traits such as:
Attachment security, Anxiety or depression symptoms, Self-esteem, Social skills
Item Response Function (IRF) - 3
RE: IRT predicts the probability that a person will endorse (or answer correctly) an item, depending on (‘as a function of’) both: the person’s trait level (true score) and the item’s properties
This relationship is described using an Item Response Function (IRF).
IRF: equation that relates to the theta—the true score defined in the latent dimension—to the probability of endorsing an item
Item Characteristic Curve (ICC) - 3
Item Characteristic Curve (ICC) is the graphed (plotted) version of an Item Response Function (IRF).
It shows how the probability of endorsing an item (e.g., answering correctly or saying “yes”) changes depending on the person’s latent trait level (θ, pronounced “theta”).
IRT VS IRF VS ICC (what it is, role in measurement, key variable used, what is described, what you learn from it)
IRT (Item Response Theory): measurement framework/model (fam of mathematical model), explains how item responses relate to a latent trait, Theta (θ) = latent trait level, describes whole test + item properties, you learn: how items and persons interact across test
IRF (Item Response Function): mathematical function within IRT, expresses the probability of endorsing an item given trait level, Uses θ to compute probability, describes Individual item behavior mathematically, you learn: theoretical performance of an item at all trait levels
ICC (Item Characteristic Curve): graphical representation of the IRF, visualizes the relationship between item endorsement probability and trait level, Plots probability vs. θ on axes, How one item functions across trait levels, you learn: where an item is most informative / how well it discriminates
what the axes of ICC represent (2)
X-axis (Theta, θ) | Person’s level on the latent trait (e.g., ability, anxiety) |
Y-axis | Probability of endorsing the item (0 → 1) |
So each point on the curve answers: “If someone has trait level θ, what is the probability they will endorse this item?”
describing ICC (3)
1)Monotonic/monitonically increasing: probability of item endorsement increases with increase in theta
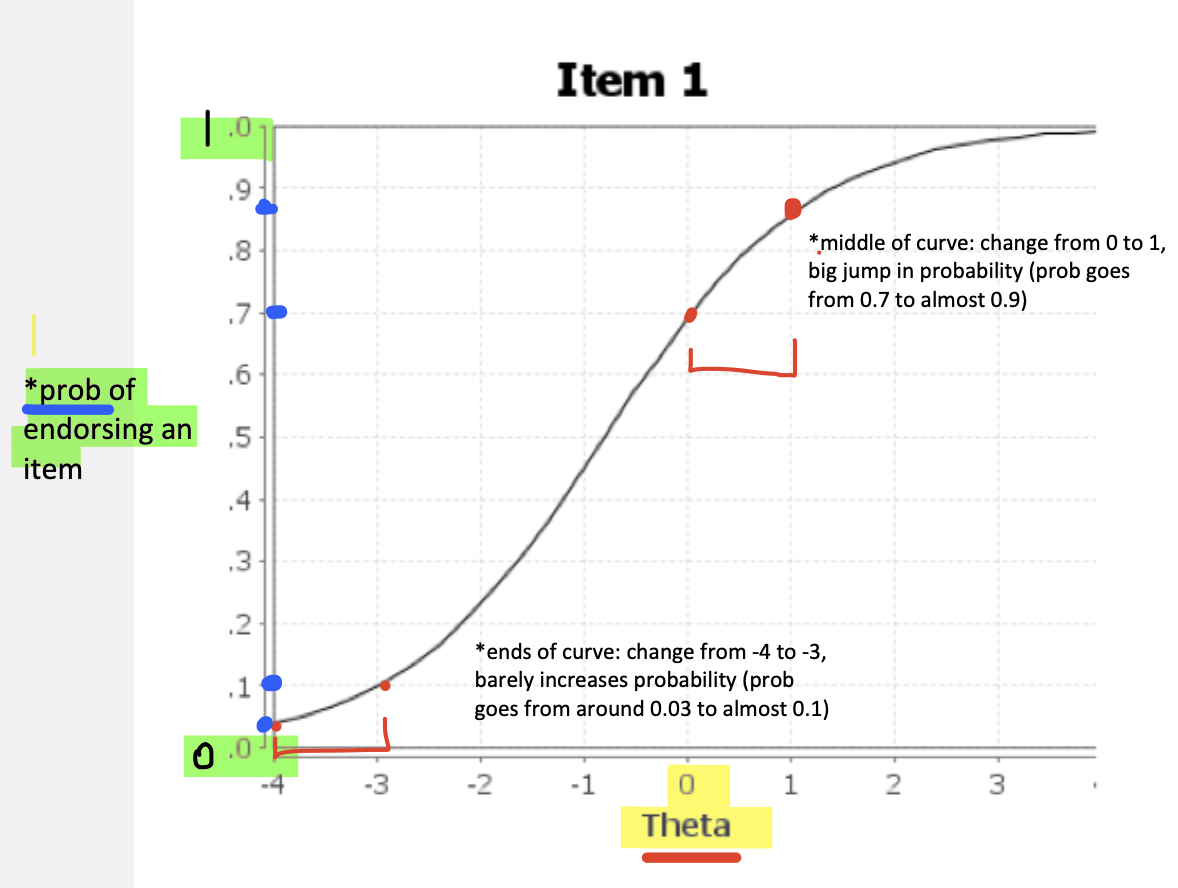
2)steep middle, flatter ends (S-shaped curve): In the middle of the curve, small changes in theta correspond with large changes in probability (relative to the ends of ICC)
3)ICC limited to 0 and 1: this represents probability, which can never be < 0 (no) or > 1 (yes)
1)Monotonically increasing (3)
As θ increases → probability of endorsing the item goes up
Well-constructed items in IRT should show this pattern
If the curve slopes downward → something is wrong (item may be confusing, reverse-coded improperly, etc.)
The steep middle & flatter ends (S-shaped/logistic curve)
Middle of the curve → very steep
Small changes in θ cause big jumps in probability
The item is most sensitive to differences between people here
Ends of the curve → flatter
Changing θ from –4 to –3 barely increases probability
Changing θ from –1 to 0 increases probability much more
This reflects that:
At extremely low or high ability, the item provides less information
In the center, the item discriminates people best
3)describing the axes (numerically): x-axis - 3
X-axis → Theta (θ): the level of the latent construct
Centered at 0, which represents the average trait level in the population
Negative values = lower levels of theta
Positive values = higher levels
RE: ICC is a curve that describes how likely a person is to endorse/get an item correct depending on their level of the underlying latent trait (θ, theta).

3)describing the axes (numerically): y-axis - 3
Y-axis → Probability of endorsing the item (0–1)
0 → impossible
1 → certain
Bound between 0 and 1 because it represents probability, which can never be < 0 or > 1
RE: ICC is a curve that describes how likely a person is to endorse/get an item correct depending on their level of the underlying latent trait (θ, theta).
*What the ICC Shows
It’s a function linking:
the item characteristics (like difficulty)
the respondent’s true trait level
Probability increases as the trait level increases (higher ability → more likely to answer correctly)
➡ The entire curve shows the probability of endorsement at every possible trait level
*What ICC can tell use about items and traits (3)
The ICC tells us:
Feature | What it reveals |
Where the curve rises steeply | Which trait levels the item measures most precisely |
Where the curve shifts left or right | How easy or difficult the item is |
How sharp the curve is | How well the item discriminates between people of different abilities |
Most common case of ICC (3)
Common Case: Dichotomous Items
The ICC is usually a logistic S-shaped curve
Used for items scored: 1 (endorsed/correct) or 0 (not endorsed/incorrect)
Examples of dichotomous responses: Yes / No, True / False, Correct / Incorrect
If items have more than 2 response options, ICCs exist too — just one curve per response category.
item difficulty (b) - 3
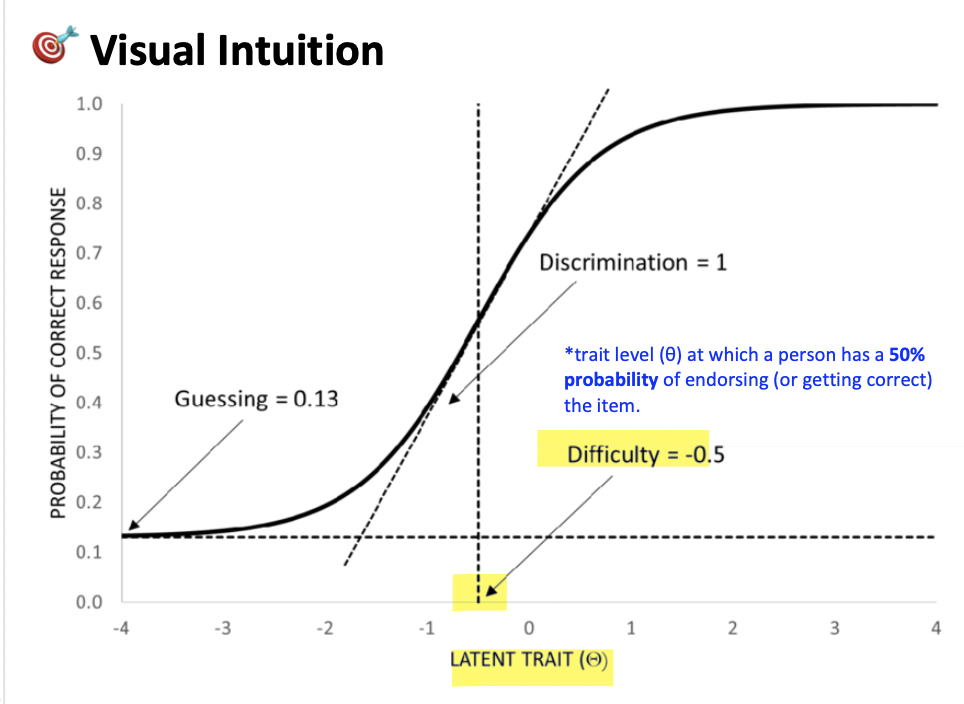
point on the latent (trait) continuum where the probabilty of item endorsment is 50%—espressed on the same scale as theta or latent trait
The trait level (θ) at which a person has a 50% probability of endorsing (or getting correct) the item.
The θ value where endorsement probability = 0.50 (or 50%)
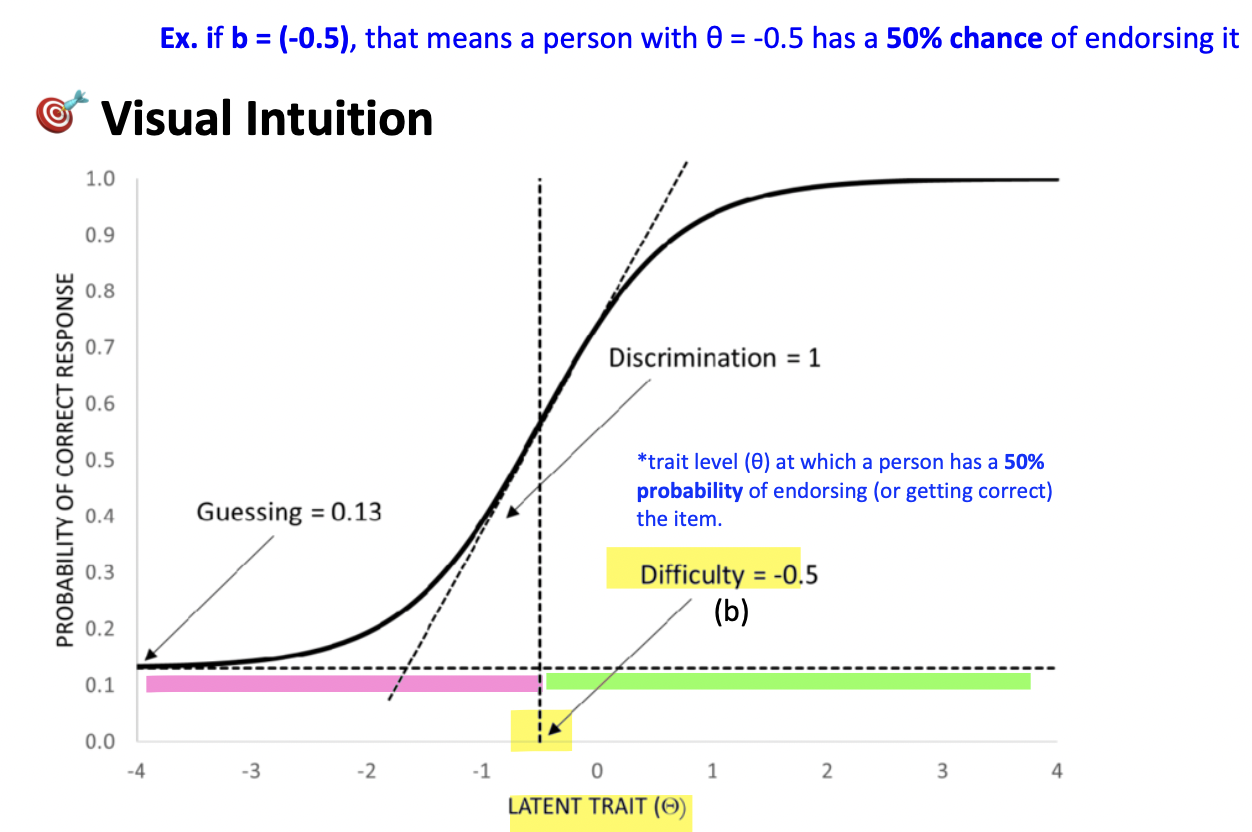
ex. So, if b = 1, that means a person with θ = +1 has a 50% chance of endorsing it.
This is why difficulty is not the probability (.50), but the θ value at which .50 occurs
difficulty typically ranges between -2 and +2
negative difficulties (b < 0) - 3
negative difficulties—items are “easier”, more frequently endorsed
items are easier: even people with below-average θ (θ below 0) have a 50% chance of endorsing (ex. getting correct);
more frequently endorsed; Because it doesn’t require a high level of the trait
ex. b = -1; ppl with θ = -1 have a 50% chance of success → very easy item
*An easy item (negative b) shifts the curve left → people with low θ endorse it
RE: 0 in the x-axis = average trait level in the population

positive difficulties (b > 0) - 3
positive difficulties—items are more “difficult”, less frequently endorsed
Item is more difficult; Needs above-average θ to have a 50% chance of endorsing
Less frequently endorsed; Only those high in the trait can endorse
ex. b = +2; only people with very high θ can endorse → very difficult item
*A hard item (positive b) shifts the curve right→ only high-θ people endorse
theta > b VS theta < b VS theta = b
when:
theta > b → items more likely to be endorsed
theta < b →items less likely to be endorsed
theta = b → item has 50% chance of being endorsed
*item difficulty summary (5)
Concept | Key Point |
What does difficulty represent? | The θ value where endorsement probability = 0.50 |
Range | Often -2 to +2 |
Negative difficulty | Easy item — low θ required |
Positive difficulty | Hard item — high θ required |
Why it matters | Helps match items to trait levels being measured |
item discrimination (a) - 3
item discrimination (a): value of the slope at the steepest point of the curve (i.e. b = 50%)
*Discrimination = the slope of the ICC at its steepest point
Item discrimination tells us how well an item can distinguish between people with slightly different levels of the latent trait (θ).
discrimination typically ranges between 0.5-1.5
*Typical Discrimination (a) Values (3)
discrimination typically ranges between 0.5-1.5
a-value | Interpretation |
< 0.5 | Very poor item — gives little information (*curve almost flat) |
0.5–1.5 | Normal / acceptable range (*moderate) |
> 1.5 | Highly discriminating, strong measurement (*curve almost straight) |
high-discrimination item (3)
highly discriminating items → the steeper the slopes
clearly separates (*discriminates) individuals with slightly higher vs slightly lower θ
provides more useful information about their ability/trait (*theta)
low-discrimination item (3)
poorly discriminating items → the smaller the slopes (*more flat slopes)
doesn’t differentiate (*discriminate btwn) people well
almost everyone behaves the same way on that item
*RE: Why is item difficulty (b) important? (3)
In the middle of the curve (near b): (in center) small changes in θ → big changes in endorsement probability
At the edges of the curve: slope is more flat → item cannot differentiate low vs. high θ people well
Thus: Items are most informative around their difficulty level *center of the curve
Relationship Between Difficulty & Discrimination (3)
RE: item difficulty (b): theta where person had 50% chance of item endorsment
item discrimination (a): how sharply the item distinguishes people around that level (value of slope at steepest point of ICC, *typcially near center of cuve around b)
If we give:
a hard item (high b) to people with low θ (ppl with low skills)→ everyone fails → no discrimination!
a very easy item (low b) to highly skilled people (high θ) → everyone gets it right → no discrimination!
Therefore, items only discriminate well for people whose θ is near the item’s b value.
*item difficulty VS discrimination
Feature | Difficulty (b) | Discrimination (a) |
What it tells us | Where on θ the item works best | How well the item separates similar θ levels |
Graphically | Horizontal shift of ICC | Slope steepness of ICC |
Ideal Range | -2 to +2 | 0.5–1.5 (or higher for strong items) |
Most informative | At b value | Around b value |
item difficulty and discrimination practice question
*use chat for explanation
item information curve (def)
how well an item differentiates among respondents who are at differnt levels of the latent variable
The IIC shows how well a single item can differentiate between people at different levels of the latent trait (e.g., ability, anxiety, depression).
→ Think of it as: “How useful is this question for measuring the trait at each point along the continuum?”
*item difficulty for IIC
Two item parameters shape the IIC: item difficulty and discrimination
1⃣ Item Difficulty (b)
Indicates the location along the latent trait where the item is most informative.
The peak of the IIC occurs exactly at difficulty b → where the curve is highest
Because that’s where responses change most sharply from incorrect (or low endorsement) to correct (or high endorsement)
→ So, difficult items give more information for high-trait respondents, and easier items for low-trait respondents.
*item discrimination for IIC
Two item parameters shape the IIC: item difficulty and discrimination
Controls how steep the curve is around b
Steeper slope → the item is better at telling apart people with slightly different trait levels near b
Flatter slope → provides less information, poorer differentiation
→ High discrimination items give more precise measurement around their difficulty level.
*a + b for IIC
You get the shape of the Item Information Curve
Highest information ALWAYS occurs near b
a makes that peak higher and narrower (more precise)
or lower and wider (less precise)
*Interpretation of the IIC
Peak → where the item measures best
Steepness → how accurately it distinguishes people at that peak
Width → how many nearby trait levels it measures reasonably well
IIC tells us where an item provides the most precise measurement of the latent trait (difficulty) and how well it distinguishes between people around that region (discrimination).
item information curve (summary)
how well an item differentiates among respondents who are at differnt levels of the latent variable
2 item parameters determine the amount of information at what range of the latent trait
item difficulty → location on the latent trait where information is maximized
item discrimination → how much information an item provides
*Test Information Curve (TIC)
relative precision of the scale acorss diff locations on the latent trait continuum
he TIC shows how precisely the entire test (all items together) measures the latent trait across different trait levels.
→ Where on the trait continuum is the whole test giving us the most confidence in people’s scores?
*How do we get the TIC?
Each item has its own Item Information Curve (IIC)
We add up the information from all items across each trait level
TIC = sum of all item information curves
This tells us how well the test works overall, not just one item.
*Axes of the TIC
Axis | Meaning |
X-axis | latent trait (θ) |
Y-axis | amount of test information |
Higher = more precise measurement
Lower = more measurement error
*Relationship Between TIC and SEM
Test Information and Standard Error of Measurement (SEM) are inversely related:
More information → lower SEM (more accuracy)
Less information → higher SEM (less accuracy)
Where the TIC peaks → SEM is lowest
Where TIC is low (usually extremes of θ) → SEM is high
test information curve (TIC) - summary
relative precision of the scale acorss diff locations on the latent trait continuum
the height of the TIC is proportional to the SEM
TIC and SEM are inversely related
standard error of measurement
SEM is lowest in regions of the latent trait continuum where test information is the highest
SEM is the highest in regions where terst information is lowest
SEM is diff for diff latent trait values
*in IRT, SEM changes depending on the person’s latent trait level
There is a different SEM at every point along the θ (trait) continuum
This recognizes that tests are better at measuring some people than others.
summary so far
how does IRT help us improve psychological tests
2 applications of IRT
scale refinement
differential item functioning (DIF)
take home message