Vocab - Unit 4
5.0(5)
Studied by 154 people0%Exam Mastery
Build your Mastery score
Supplemental Materials Call Kai
Card Sorting
1/25
Earn XP
Description and Tags
Last updated 6:24 PM on 1/19/23
Name | Mastery | Learn | Test | Matching | Spaced | Call with Kai | Chat |
|---|
No analytics yet
Send a link to your students to track their progress
26 Terms
1
New cards
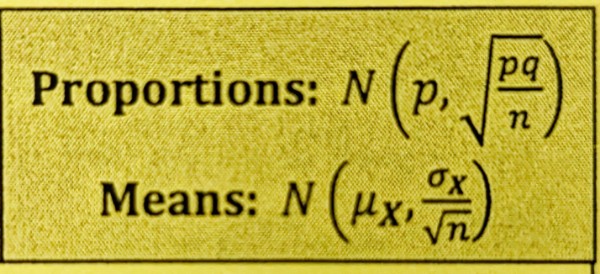
Sampling Distribution Model
The distribution that shows the behavior of a statistic (value from a sample) with its sampling variability over all possible samples of the same sample size n
2
New cards
Central Limit Theorem
The sampling distribution model of means/proportions is approximately Normal for “large enough” sample size n as long as the observations are independent
3
New cards
Law of Diminishing Returns
The standard deviation of a sampling distribution model decreases by the square root of the sample size… e.g. quadruple the sample size → standard deviation cut in half
4
New cards
Large Enough Sample Condition
A “large enough” sample size is necessary to ensure the CLT “kicks in” (Success/Failure Condition for proportions; n ≥ 30 often sufficient for means if data is not severely skewed
5
New cards
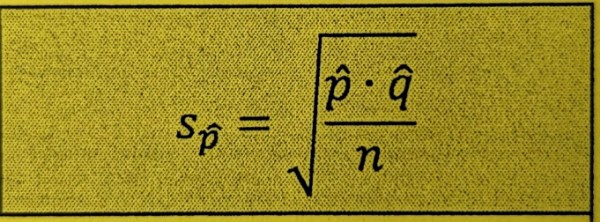
Standard Error of Proportions
An estimate of the unknown standard deviation for sigma sub p-hat for a sampling distribution of proportions using a sample statistic
6
New cards
Confidence Interval
An interval of values found from a sample that has a statistical probability of capturing the true population parameter (which is unknown)
7
New cards
Critical Value
The number of standard errors to move away from the sample statistic in order to determine a confidence interval, denoted as z\* for Normal models and t\* for t-models
8
New cards
Margin of Error
The extent of a confidence interval on either side of the sample statistic (± of a poll, for example)
9
New cards
Hypothesis Test
A statistical procedure that involves comparing a sample statistic to a proposed model in order to infer about the associated population parameter
10
New cards
Null Hypothesis
A baseline hypothesis (H0) that is originally assumed to be true about a population
11
New cards
Alternative Hypothesis
A hypothesis (HA) about a population that a test is trying to provide evidence for in order to reject the null hypothesis
12
New cards
One-Tailed Hypothesis Test
A hypothesis test that is interested in deviations on only one side of the null hypothesis value; involves the sign > or <
13
New cards
Two-Tailed Hypothesis Test
A hypothesis test that is interested in deviations on either side of the null hypothesis value; involved the sign ≠
14
New cards
*p*-Value
The probability that the observed statistic (or a more extreme one) could occur, by chance, if the null hypothesis was true
15
New cards
Significance/Alpha Level
The cutoff *P*-value that determines when to reject the null hypothesis, denoted by the Greek letter alpha (α); the most common levels are 0.10, 0.05, and 0.01
16
New cards
Statistically Significant
If the *P*-value falls below the significance/alpha level, then the test is said to be statistically significant at that level, meaning that there is sufficient evidence to reject the null because the observed difference is too large to believe that it was likely to have occurred naturally
17
New cards
Student’s *t* Model
A family of distributions whose shapes are roughly “bell-shaped” and unimodal/symmetric, but are shorter and wider with fatter tails than Normal models… used when the true population standard deviation for a sampling distribution of means is unknown
18
New cards
Degrees of Freedom
Found by subtracting 1 from the sample size (*df* = *n*-1); defines the specific *t*-distribution to be used as a model, affecting the spread of the curve…. approaches Normal as *df* increases
19
New cards
Standard Error of Means
An estimate of the unknown standard deviation sigma sub x-bar for a sampling distribution of means using a sample statistic s sub x

20
New cards
*t-*Score
Standardized value that identifies how many standard errors a value is from the sampling distribution mean

21
New cards
Paired Data
Observations that are collected in pairs or for which one group is naturally related to the other group, such as before/after treatment
22
New cards
Paired Data Condition
The condition of relationship between the two groups of data that must be met for the use of a paired *t*-test… groups should NOT be independent of each other
23
New cards
Type I Error
Rejecting the null hypothesis when it is in fact true, which has the probability of α (false positive)
24
New cards
Type II Error
Failing to reject the null hypothesis when it is in fact false, which has the probability of β
25
New cards
Power
The probability that a hypothesis test will correctly reject a false null hypothesis; 1-β
26
New cards
Effect Size
The difference between the null hypothesis value (*p*0 or µ0) and the true value (*p* or µ)… how far off from what’s actually true is the null hypothesis? As effect size increases, the likelihood of seeing sufficient evidence to reject the null hypothesis increases; thus, power increases