STATS 2- Distributions, z-scores & p-values
1/8
There's no tags or description
Looks like no tags are added yet.
Name | Mastery | Learn | Test | Matching | Spaced | Call with Kai |
|---|
No analytics yet
Send a link to your students to track their progress
9 Terms
normally distributed data
bell-shaped curve
peak = mean
width = sd
area under curve = 1
2 types of non-normally distributed data
skewed (positive/negative
bimodal (2 modes)
how to work out probability
number of possible outcomes consistent with event/total possible outcomes
what is conditional probability
probability of an event when something else is known/assumed
what do you use z-scores for
normally distributed population
finding probability of selecting a specific variable
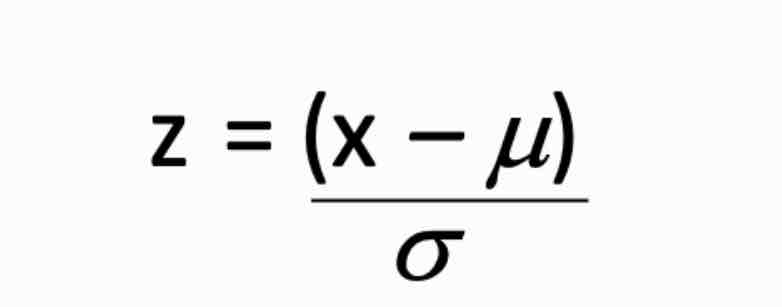
how to calculate z-score
x= number given in question
z= number of sd’s away from the mean
can be positive or negative
what is the standard normal distribution table used for
converting z-scores into probabilities
2 columns proportion/probability above & below
what to do when converting -z scores into probability
ignore the -
what to do when finding probability in between 2 values
calculate z-scores for each value & convert to probabilities
minus probabilities from 1