Chapter 10 Econ Terms
 Call Kai
 Learn
Learn Practice Test
 Spaced Repetition
 Match
Match Flashcards
 Knowt Play
1/43

There's no tags or description
Looks like no tags are added yet.
Name | Mastery | Learn | Test | Matching | Spaced | Call with Kai | Chat |
|---|
No analytics yet
Send a link to your students to track their progress
44 Terms
Unemployment (M)
Refers to all those in the labour force who are willing and able to work, but are unable to find work.
Underemployed (DM)
Refers to people of working age with part-time jobs when they would rather work full time, or with jobs that do not make full use of their skills and education.
Labour Force (M)
Refers to the number of people who are employed plus the number of people of working age who are unemployed.
Unemployment Rate (M)
(Number of unemployed ÷ labour force) × 100
Structural Unemployment (M)
Occurs as a result of changes in demand for particular types of labour skills, changes in the geographical location of industries and therefore jobs, and labour market rigidities. Is part of the NRU.
Structural Unemployment Diagrams (M)

Labour Market Rigidities (M)
Factors that prevent the forces of supply and demand from operating in the labour market. They include:
- Minimum wage legislation
- Labour union activities and wage bargaining with employers
- Employment protection laws
- Generous unemployment benefits
Frictional Unemployment (M)
Occurs when workers are between jobs. Workers may leave their job because they have been fired, are in search of a better job, or may be waiting to start a new job. Is part of the NRU.
Seasonal Unemployment (M)
Occurs when the demand for labour in certain industries changes on a seasonal basis because of variations in needs. Is part of the NRU.
Cyclical Unemployment (Demand-Deficient Unemployment) (M)
Occurs during the downturns of the business cycle, when the economy is in a deflationary/recessionary gap.
Cyclical Unemployment Diagrams (M)
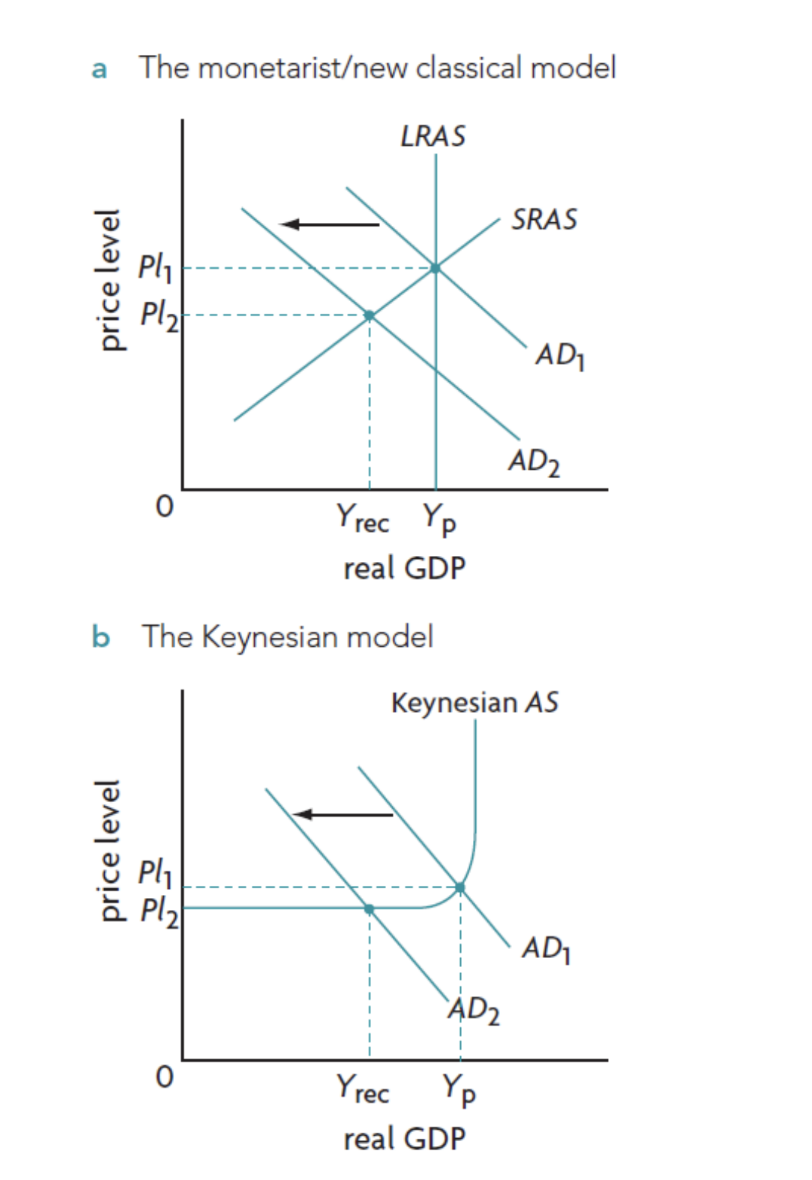
The Four Types of Unemployment in Relation to the AD-AS Model (M)

Inflation (M)
A sustained increase in the price level as measured by the consumer price index (CPI).
General Price Level (M)
Refers to an average of prices of goods and services in the entire economy, not to the price of any one particular good or service.
Deflation (M)
A sustained decrease in the general price level.
Disinflation (M)
Refers to when inflation occurs at a lower rate.
Consumer Price Index (M)
A measure of the cost of living for the typical household, and compares the value of a basket of goods and services in one year with the value of the same basket in a base year.
Weighted Price Index (M)
A price index that ‘weights‘ the various goods and services according to their relative importance in consumer spending.
Price Index for a Specific Year Formula (M)
(Value of basket in a specific year ÷ Value of same basket in base year) × 100
Rate of Inflation Formula (Using the Price Index)
((Final value of CPI - initial value of CPI) ÷ initial value of CPI) × 100
or
((Final value of the basket - initial value of the basket) ÷ initial value of the basket) × 100
Real Income Formula (M)
(Nominal income ÷ CPI) × 100
The Core Rate of Inflation
Is measured by constructing a CPI that does not include food and energy products with highly volatile prices.
Demand-Pull Inflation (M)
Refers to an excess of aggregate demand over aggregate supply at the full employment level of output, and is caused by an increase in aggregate demand.
Demand-Pull Inflation Diagram (M)

Cost-Push Inflation (M)
Caused by a fall in aggregate supply, in turn resulting from increases in wages or prices of other inputs, shown in the AD-AS model as leftward shifts of the AS curve.
Cost-Push Inflation Diagram (M)
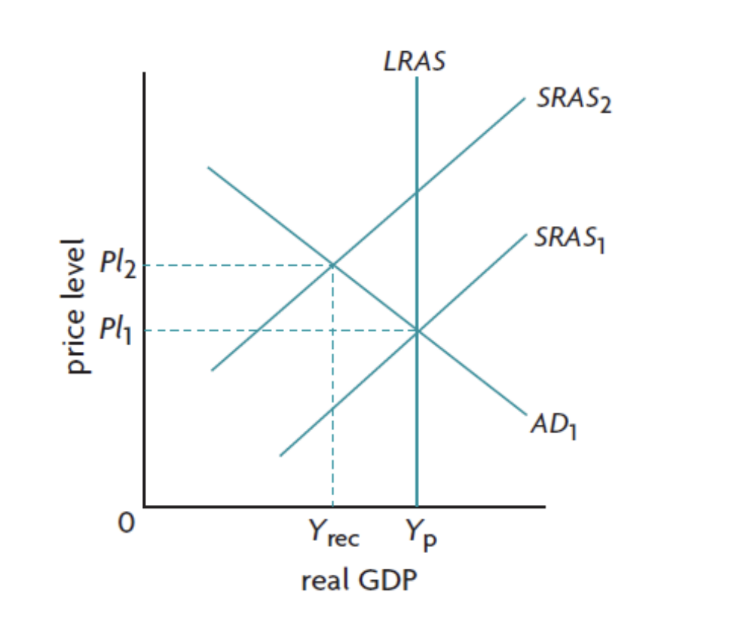
Stagflation
Refers to a rare, harmful combination of stagnant economic growth, high unemployment, and high inflation.
Purchasing Power / Real Income (DM)
Refers to the quantity of goods and services that can be bought with money.
% Change in Real Income Formula (M)
% change in nominal income - % change in the price level (rate of inflation)
Hyperinflation (M)
Consists of very high rates of inflation. It occurs when the price level increases by more than 50% per month.
Inflationary Spiral
A process where inflation sets in motion a series of events that worsen the inflation.
Barter
The direct exchange of goods or services, eliminating the need for money.
Causes of Deflation Diagrams (M)
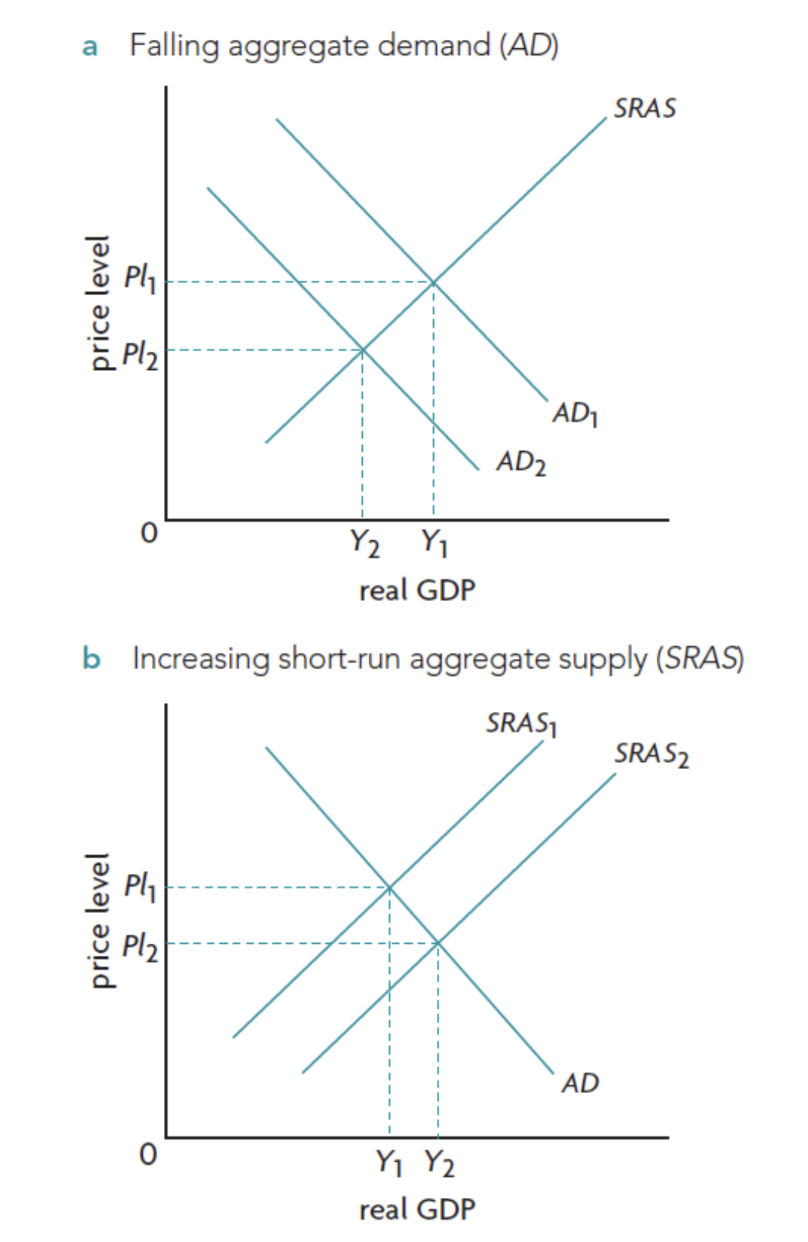
Deferred Consumption (M)
Refers to consumers postponing spending. They do so when they see falling prices as they expect that prices will continue to fall.
Deflationary Spiral
A process where deflation sets in motion a series of events that worsen the deflation.
Misery Index
Consists of the sum of the unemployment rate and the inflation rate of a country.
Phillips Curve (M)
Is concerned with the relationship between unemployment and inflation.
Diagrams on the Short-Run Phillips Curve (M)

Demand-Side Policies
Government and central bank interventions designed to manipulate aggregate demand in an economy.
Stagflation: Outward Shifts of the Short-Run Phillips Curve Due to Decreasing SRAS (M)

The Short-Run and Long-Run Phillips Curves (M)

Equilibrium Unemployment
States that the NRU occurs at long-run equilibrium.
Short-Run Phillips Curve (M)
Shows that there is a negative relationship between the rate of inflation and the unemployment rate, suggesting that in the short run, policy-makers can choose between the competing alternatives of low inflation or low unemployment by using policies that affect aggregate demand.
Long-Run Phillips Curve (M)
Is vertical at the NRU, indicating that unemployment is independent of the rate of inflation, and that policy-makers do not have a choice between the two competing alternatives.