Exam 2
1/37
There's no tags or description
Looks like no tags are added yet.
Name | Mastery | Learn | Test | Matching | Spaced | Call with Kai |
|---|
No analytics yet
Send a link to your students to track their progress
38 Terms
mode
the value of the most common score of the variable
the only and best measure for nominal variables
median
the middle value in a frequency distribution
could be used for ordinal, interval, and ratio scales
best when the shape of the distribution for the interval/ratio variable is skewed
mean
average
best for interval and ratio scales
best when the shape of the distribution for the interval/ratio variable is symmetrical and unimodal
how skewed distribution affect each measure of central tendency
mean: in a right-skewed distribution, the mean is higher than the median and in a left-skewed distribution the mean is lower than the median
median: the median remains a better measure of central tendency in skewed distributions because it is less affected by extreme values
mode: the mode indicates the most frequent value, which can remain unchanged regardless of skewness, but its position relative to the mean and median can indicate the direction of the skew
how outliers affect each measure of central tendency
mean: outliers can pull the mean up or down, making it unrepresentative of the main data
median: the median is less affected by outliers as it is the middle value, so it stays closer to the center of the main data
mode: the mode, being the most common value, is not affected by outliers unless they change what is most frequent
how does measurement scale affect the measure of central tendency you use
the type of data you have decides which average to use
for nominal data, you should use the mode
for ordinal data, you should use the median
for interval or ratio you usually use the mean if it's balanced or the median if it's skewed
what are we describing with the measures of variability
measures of variability tell us how much the numbers in a set are spread out
show how different the values are from the average
most common: range, inter-quartile range, variance, and standard deviation
absolute range
the difference between the smallest and largest observed value
pros:
cons: does not consider distribution shape, highly susceptible to outliers
inter-quartile range
the range of the middle 50% of values, between the 25th and 75th percentile
pros: tells you how variable the observation in the middle of the distribution is without being affected by outliers skewed distributions
cons:
anatomy of box-and-whisker plots
graph the median with IQR and range, which visualizes central tendency and variability together
pros: helpful for comparing distributions
cons:
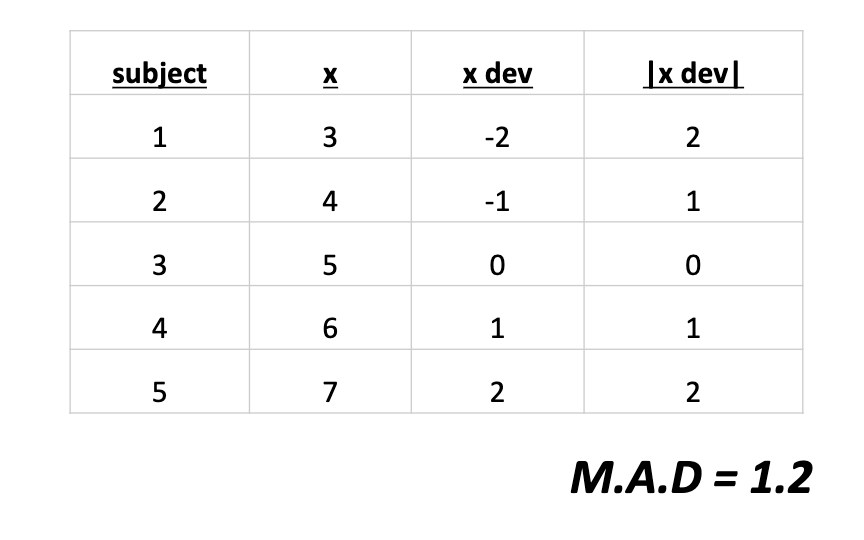
mean absolute deviation
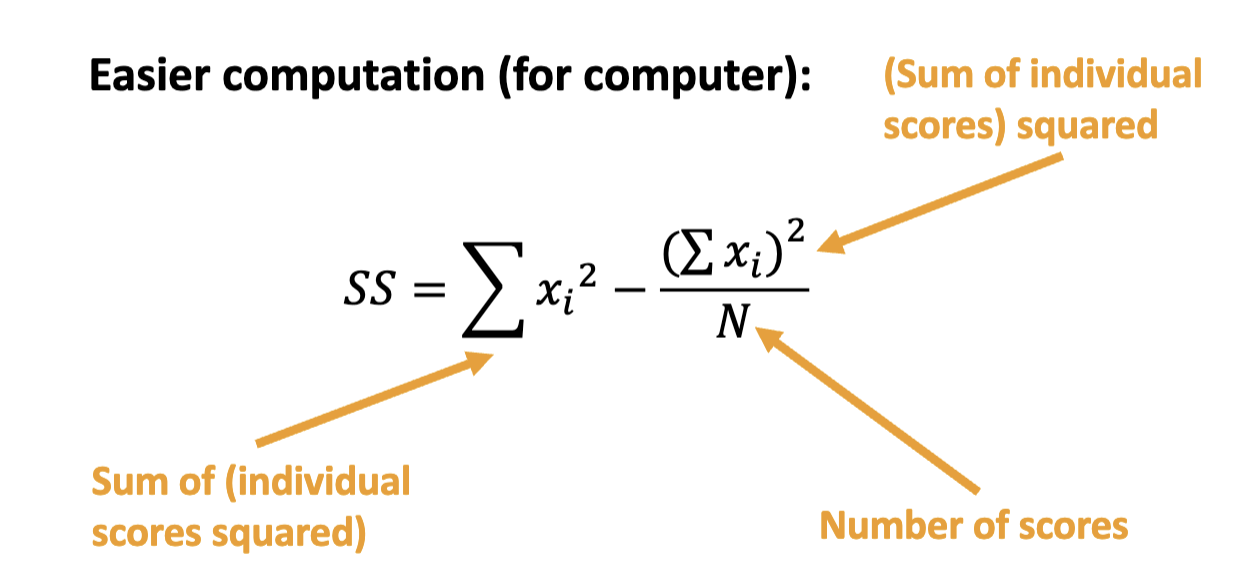
sum of squares
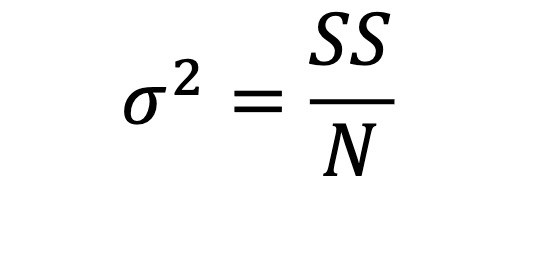
variance
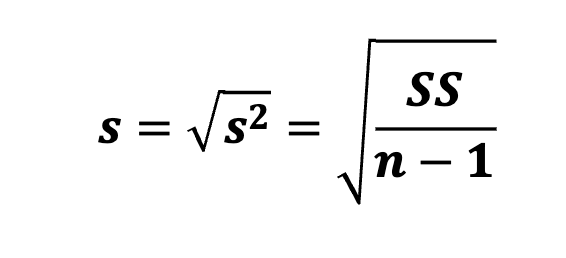
standard deviation
how do outliers and skew affect which measure of variability is used to detect outliers
outliers can distort measures like the range and standard deviation.
when the data is skewed, the inter-quartile range (IQR) is better for identifying outliers because it focuses on the middle 50% of the data and is less influenced by extreme values
degrees of freedom
degrees of freedom refer to the number of independent values or quantities which can be assigned to a statistical distribution
calculated as the sample size minus the number of parameters estimated from the data
how a z score is computed
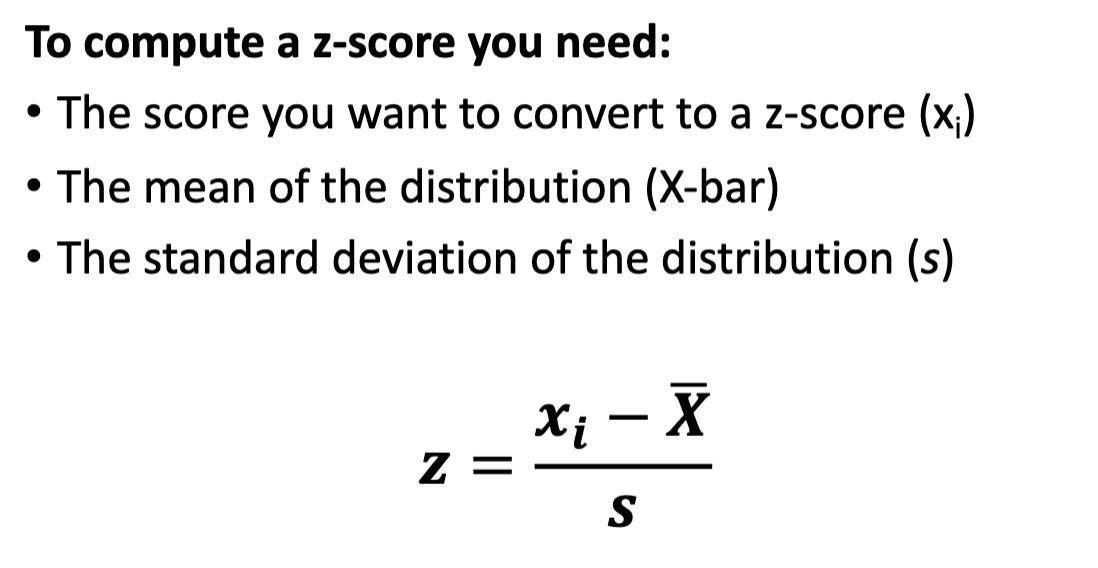
how to interpret a z score in terms of units of standard deviations
a z score indicates how many standard deviations a data point is from the mean
a z score of +2 means the data point is two standard deviations above the mean
a z score of -1.5 means it is one and a half standard deviations below the mean
what does a z score of zero reflect
a z score of zero reflects that a data point is exactly at the mean of the distribution
indicates no deviation from the average value of the dataset
how can z scores compare variables measured with different units
they can be compared directly or used to compute an average "composite score”
how can z scores identify outliers based on a criteria of standard deviation
use benchmark of standard deviation to determine whether a score is an outlier
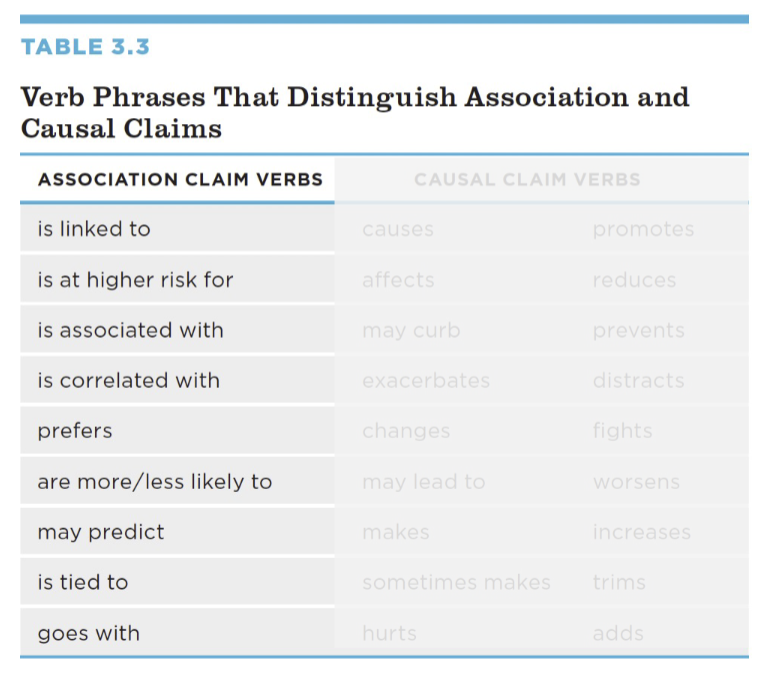
what kind of claim do we use the Pearson r for
association claims
what are the expectations for the data when using the Pearson r
the relationship must be linear
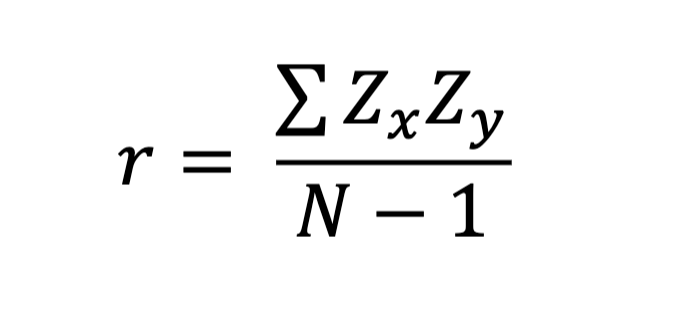
anatomy of the Pearson r equation
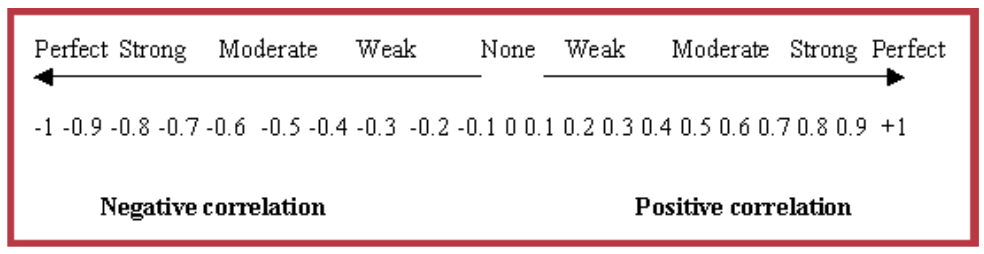
how does the Pearson r indicate strength and direction in the statistic
the strength is -1 to 1 range
the direction is +/-
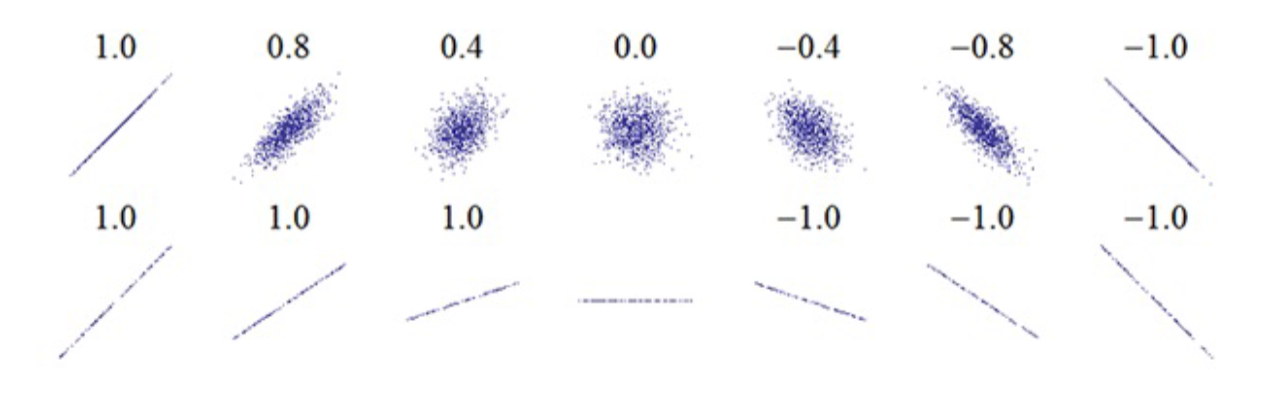
how does the Pearson r indicate strength and direction in the scatter plot
the strength is estimated by how close the points are to a trendline
direction is shown by the slope
impact of different kinds of extreme scores when interpreting the Pearson r
positive extreme scores can inflate the correlation, suggesting a stronger relationship than there actually is
negative extreme scores can deflate it, masking a genuine relationship.
range restriction when interpreting the Pearson r
-1 to 1
describing your result in words when interpreting the Pearson r
what is descriptive statistics
“unitless”
effect size for the strength of the relationship
effect sizes are comparable across different variables and studies
difference between sample statistics and population parameters
sample statistics summarizes the sample of the study (known)
population parameters summarizes the entire population (unknown)
what are the distinct goals of descriptive and inferential statistics
descriptive statistics aim to summarize and describe the characteristics of a dataset, providing an overview of its main features
inferential statistics focus on making predictions or inferences about a population based on a sample, assessing relationships and testing hypotheses
estimation vs. precision
estimation is a single estimate of a population value based on data from a sample
precision is refining statistics by using larger sample sizes and lowering variability
what is a 95% confidence interval, and how does it help us make an inference about a result
a range of how precise our point estimate is by capturing a range that very often contains the true population value
a 95% confidence interval that contains the population value 95% of the time
it helps us make an inference about a result by making a range of realistic values
how to interpret confidence intervals for Pearson correlations
confidence intervals for Pearson correlations provide a range within which the true correlation coefficient is likely to lie
what is null hypothesis significance testing (NHST)
an inferential statistical technique in which a result is compared to a hypothetical population in which there is no relationship or no difference
how are p-values used for interference with this approach
in NHST, the probability of getting the result in a sample or one more extreme, by chance, if there is no relationship or difference in the population
what is an alpha criterion
researchers decide whether the p value obtained from a sample statistic is low enough to reject the null hypothesis or too high, and thus retain the null hypothesis