2.1.1 Economic growth
1/20
There's no tags or description
Looks like no tags are added yet.
Name | Mastery | Learn | Test | Matching | Spaced | Call with Kai |
|---|
No analytics yet
Send a link to your students to track their progress
21 Terms
ECONOMIC GROWTH
economic growth is the rate of change of output
its an increase in the long term productive potential of the country meaning there’s an increase in the amount of g and s that a country produces
typically measured by the % change in real GDP per annum
can also be shown through the shift of PPF
GDP- DEFINITION
the total value of goods and services produced in a country within a year
standard measure of output- allows us to compare countries
GDP
GDP is an indicator of standard of living in a country
total GDP = overall GDP of country
GDP per capita = total GDP/number of people
GDP per capita grows if national output grows faster than population over a given time period, so there are more g and s per person
GDP- REAL VS NOMINAL
real GDP strips out effects of inflation whilst nominal GDP doesn’t
real values can be described as VOLUME of national income i.e. the size of the basket of goods
whilst nominal values represent the VALUE of the national income i.e. the monetary cost of this basket of goods
VALUE = VOLUME x the current price level
VALUE of national income is its monetary value at prices of the day
VOLUME is national income adjusted for inflation and is expressed either as index number or in money terms
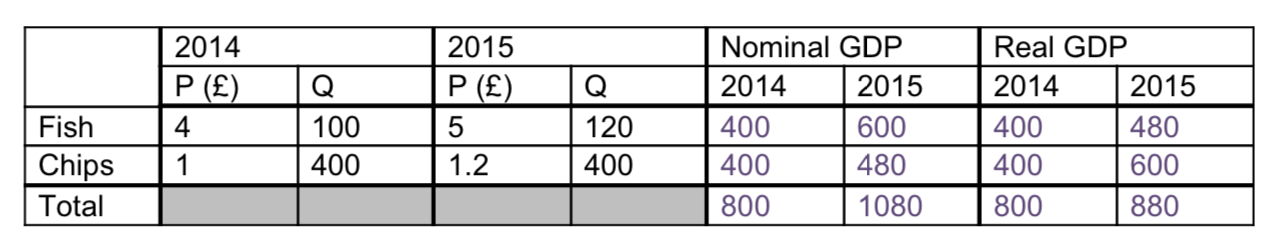
NOMINAL AND REAL GDP- EXAMPLE
To work out nominal GDP: times the price by the quantity for each year e.g. fish in 2014 is 4x100
To work out the total: add the fish and the chips
To work out the real GDP: multiply the quantity by the price in 2014- this will strip out the effects of a rising price e.g. real fish in 2015 is 4x120
GROSS NATIONAL INCOME
value of g and s produced by a country over a period of time + net overseas interest payments and dividends
this means that it adds what a country earns from overseas investments and subtracts what foreigners earn in a country and send back home from the GDP
affected by profits from businesses owned overseas and remittances sent home by migrant workers
is increasingly used rather than GDP because of the growing size of remittances and aid
GROSS NATIONAL PRODUCT
value of g and s over a period of time through labour or property supplied by citizens of a country both domestically (GDP) and overseas
means its the value of all the goods produced by citizens of a country, whether they live there or not, whilst GDP is the value of all goods produced inside the country, whether they were produced by citizens of the country
COMPARISONS ABOUT GROWTH- OVER TIME
changing national income levels will show whether the country has grown or shrunk over a period of time
the figures can make judgements about economic welfare as growth in national income = a rise in living standards as the economy is producing more g and s so people have access to more things
if pop grows over time, then this may cause a rise in GDP without a rise in living standards and so provide inaccurate comparisons
use real GDP in order to strip out the effect of inflation and so can give impression of GDP growing without any more s and g being produced
COMPARISONS ABOUT GROWTH- BETWEEN COUNTRIES
When countries have diffs in pop, a diff in total GDP doesn't always mean a diff in living standards so to make comparisons, find GDP per capita
possible for GDP to increase simply because of an increase in prices in the country and inflation is diff in every country, so real GDP figures need to be calculated
PURCHASING POWER PARITIES
an exchange rate of one currency for another which compares how much a typical basket of goods in the country costs compared to one in another country
provides an alternative to using exchange rates for comparisons of GDP
these are useful when comparing countries as it takes into account the cost of living and will help better compare living standards
diff between the highest and lowest GDPs will be smaller when PPP is used as poorer countries have a much lower cost of living than richer ones
e.g. Big Mac Index
PROBLEMS OF USING GDP TO COMPARE LIVING STANDARDS
inaccuracy of data
inequalities
quality of g and s
comparing diff currencies
spending
other factors
INACCURACY OF DATA 1
some countries are inefficient at collecting or calculating data so comparisons become less effective
black market- people work without declaring their income to avoid tax or claim benefits, so GDP is underestimated- varies between countries and may change overtime
GDP doesn’t include home-produced services- e.g in many LICs people work as subsistence farmers where they grow and consume their own crops without trading, so GDP underestimated
INACCURACY OF DATA 2
errors in calculating inflation rate means inaccurate real GDP
over time, methods used to calculate GDP will change, so difficult to compare countries
important to take away transfer payments, when money is paid to a person without any corresponding increase in output in the economy- e.g. gov taxes people who are employed and gives it to unemployed- also include pocket money and selling of second hand goods
INEQUALITIES
increase in GDP may be bc of growth in income of just one group of people and so therefore a growth in the national income may not increase living standards everywhere
income distribution changes overtime and varies between countries so makes comparisons difficult
QUALITY OF GOODS AND SERVICES
quality of g and s is much higher than those long ago, but its not necessarily reflected in the real price of these g and s
so living standards may have increased more than GDP would suggest since the quality of g and s has improved
improved tech may allow prices to fall, suggesting falling living standards, when its not the case
COMPARING DIFFERENT CURRENCIES
there are issues over which unit should be used to compare figures: usually converted into USD bc of the size of American economy
Some people argue that PPP should be used to take into account the impact of diffs in the cost of living in diff countries
SPENDING
some types of expenditure, such as defence, doesn’t increase standard of living but will increase GDP
e.g GDP of the UK was higher during the WW2 than in 1930s because a lot of money was spent on defence which increased GDP but its difficult to argue that standard of living was higher in WW2
this makes comparisons difficult as spending varies overtime and between countries
OTHER FACTORS
also many other factors which are involved in living standards- e.g. education
NATIONAL HAPPINESS
GDP only measures income but there are other factors affecting welfare
the UN happiness report found 6 key factors: real GDP per capita, health, life expectancy, having someone to count on, perceived freedom to make life choices, freedom from corruption, and generosity
UK NATIONAL WELLBEING
2010- the UK PM launched the Measuring National Wellbeing report to see how lives are improving
found that self-reported health, relationship status and employment status most affect personal well-being
ask 4 questions about life satisfaction, anxiety, happiness and worthwhileness, where people answered 0-10
report is now updated on a quarterly basis, rather than annually
2012-2016- life satisfaction, happiness and worthwhile rose whilst anxiety levels fell but have begun to rise slightly- could be as unemployment is falling/GDP is rising but concerns over global security could be causing anxiety
REAL INCOMES AND SUBJECTIVE HAPPINESS
one finding of psychological research is that happiness and income are positively related at low incomes i.e. if you are poor and your income increases, you will be happier, but higher levels of income aren't associated with increases in happiness-called the Easterlin Paradox
increase in consumption of material goods will increase happiness if basic needs aren't met, but once they’re met, an increase in consumption won't increase long term happiness
another finding is that income and happiness depends on the people around us
income is linked to social status