RMA - Week 10
1/11
There's no tags or description
Looks like no tags are added yet.
Name | Mastery | Learn | Test | Matching | Spaced | Call with Kai |
|---|
No analytics yet
Send a link to your students to track their progress
12 Terms
density curves
useful when many pps
a histogram showing distirubtion of scores of pps
nromal distribution = …
increased data points means better curve
ignores outliers and extreme values
area of 1 underneath them
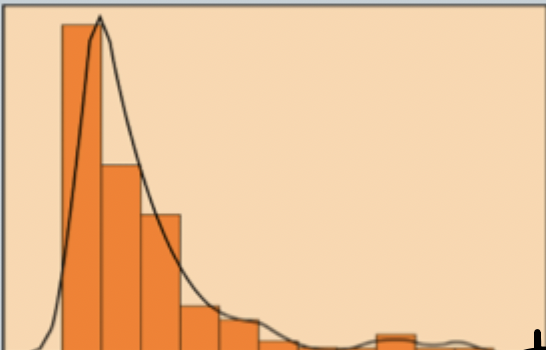
positively skewed
sharp peak then long descent of curve
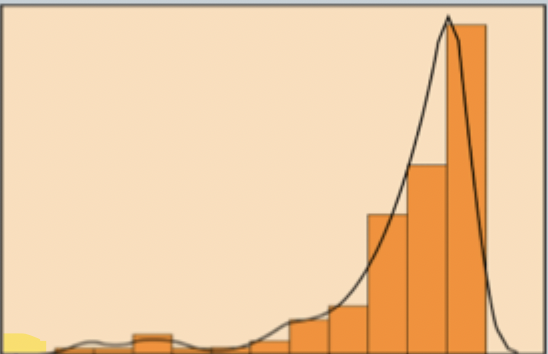
negatively skewed
long ascent then sharp drop
median
point that divides area into equal parts
quartiles
points that divide area under curve into quarters
mode
positions at peak of curve
mean
balancing point of the curve
perfect distribution
mean, median, mode in one place
skewed curves
Mode stays the same
Median and mean - skewed psitively/ negatively
More effect on the mean
usefulness
Because the curve is mathematically defined, you can compare observed data to the normal curve to check how well it fits.
z score
deviation of x from mean / standard deviation
used to standardise data