Lecture 9 + 11 + 12
1/27
There's no tags or description
Looks like no tags are added yet.
Name | Mastery | Learn | Test | Matching | Spaced |
|---|
No study sessions yet.
28 Terms
What does it mean when we say there is a bubble?
when house prices are unreasonably high and keep increasing
cause: faulty credit markets.
6 facts about real estate cycles
Heterogeneity in boom-busts across space
Implies that only some cities grow more astronomically.
Boom bust of 1980s looks a lot like 2000s
Local housing markets have different timing of their cycles
Largest booms and busts are clustered (coastal MSAs + Florida)
Cross-section variation in house price changes is larger in booms than busts
Patterns hold if you control for demand factors (rents, incomes, employment)
Economic boom
Labour market shifts out,
Equilibrium residents/ workers increase
Housing market demand shifts out, house prices up
Economic Bust
Shifts in labour demand
Labour market shifts in
Equilibrium residents and workers down
Housing demand shifts in, prices down
what determines the response of prices to changes in economic activity
elasticity of supply
elastic supply: home prices will not increase as much even if demand shifts out
inelastic supply: home prices will increase a lot due to shift in demand as more pressure on prices.
What happens in a housing bubble?
expected capital gains increase
this decrease the user cost of capital (i + h + d + m - g) —> causes demand to shift out —> prices up —> capital gains up —> cycle again.
if prices are increasing more than rents, there is likely a bubble.

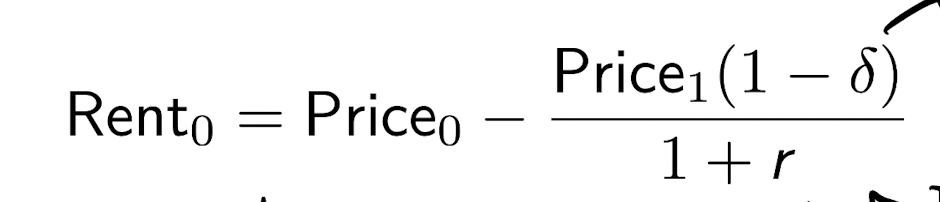
What should rent be?
rent should be the cost of holding a house for 1 year and selling it after.
if prices grow more, rent goes down.
if interest rates go down, rent goes down
if depreciation goes down, rent goes down.
Price-to-rent ratio
represents the value of an asset relative to the income stream it generates, similar to a price-earnings ratio.
if r increase, price rent goes down
if g increases, price rent goes up,
if the ratio is very high, there is likely a bubble.
Issues with price to rent ratios?
tends to be higher in high-cost markets
issue with measuring quality
hard to compare similar owned and rented homes
as such, it is better to look at trends in the ratio as compared to the ratio itself.
Price-to-income ratio
is a measure of bubbliness and affordability
tells how many years of income would take to buy a home.
annual rent is B*income where B is proption of income spent on housing
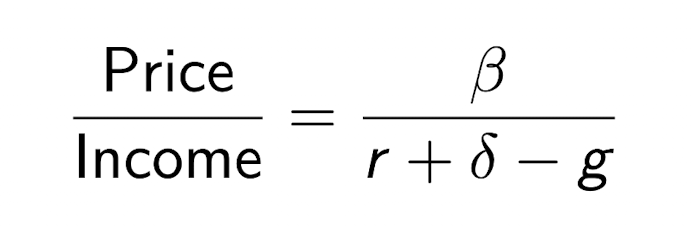
B
Can increase if income decreases or if housing becomes more expensive, causing the price/income ratio to increase
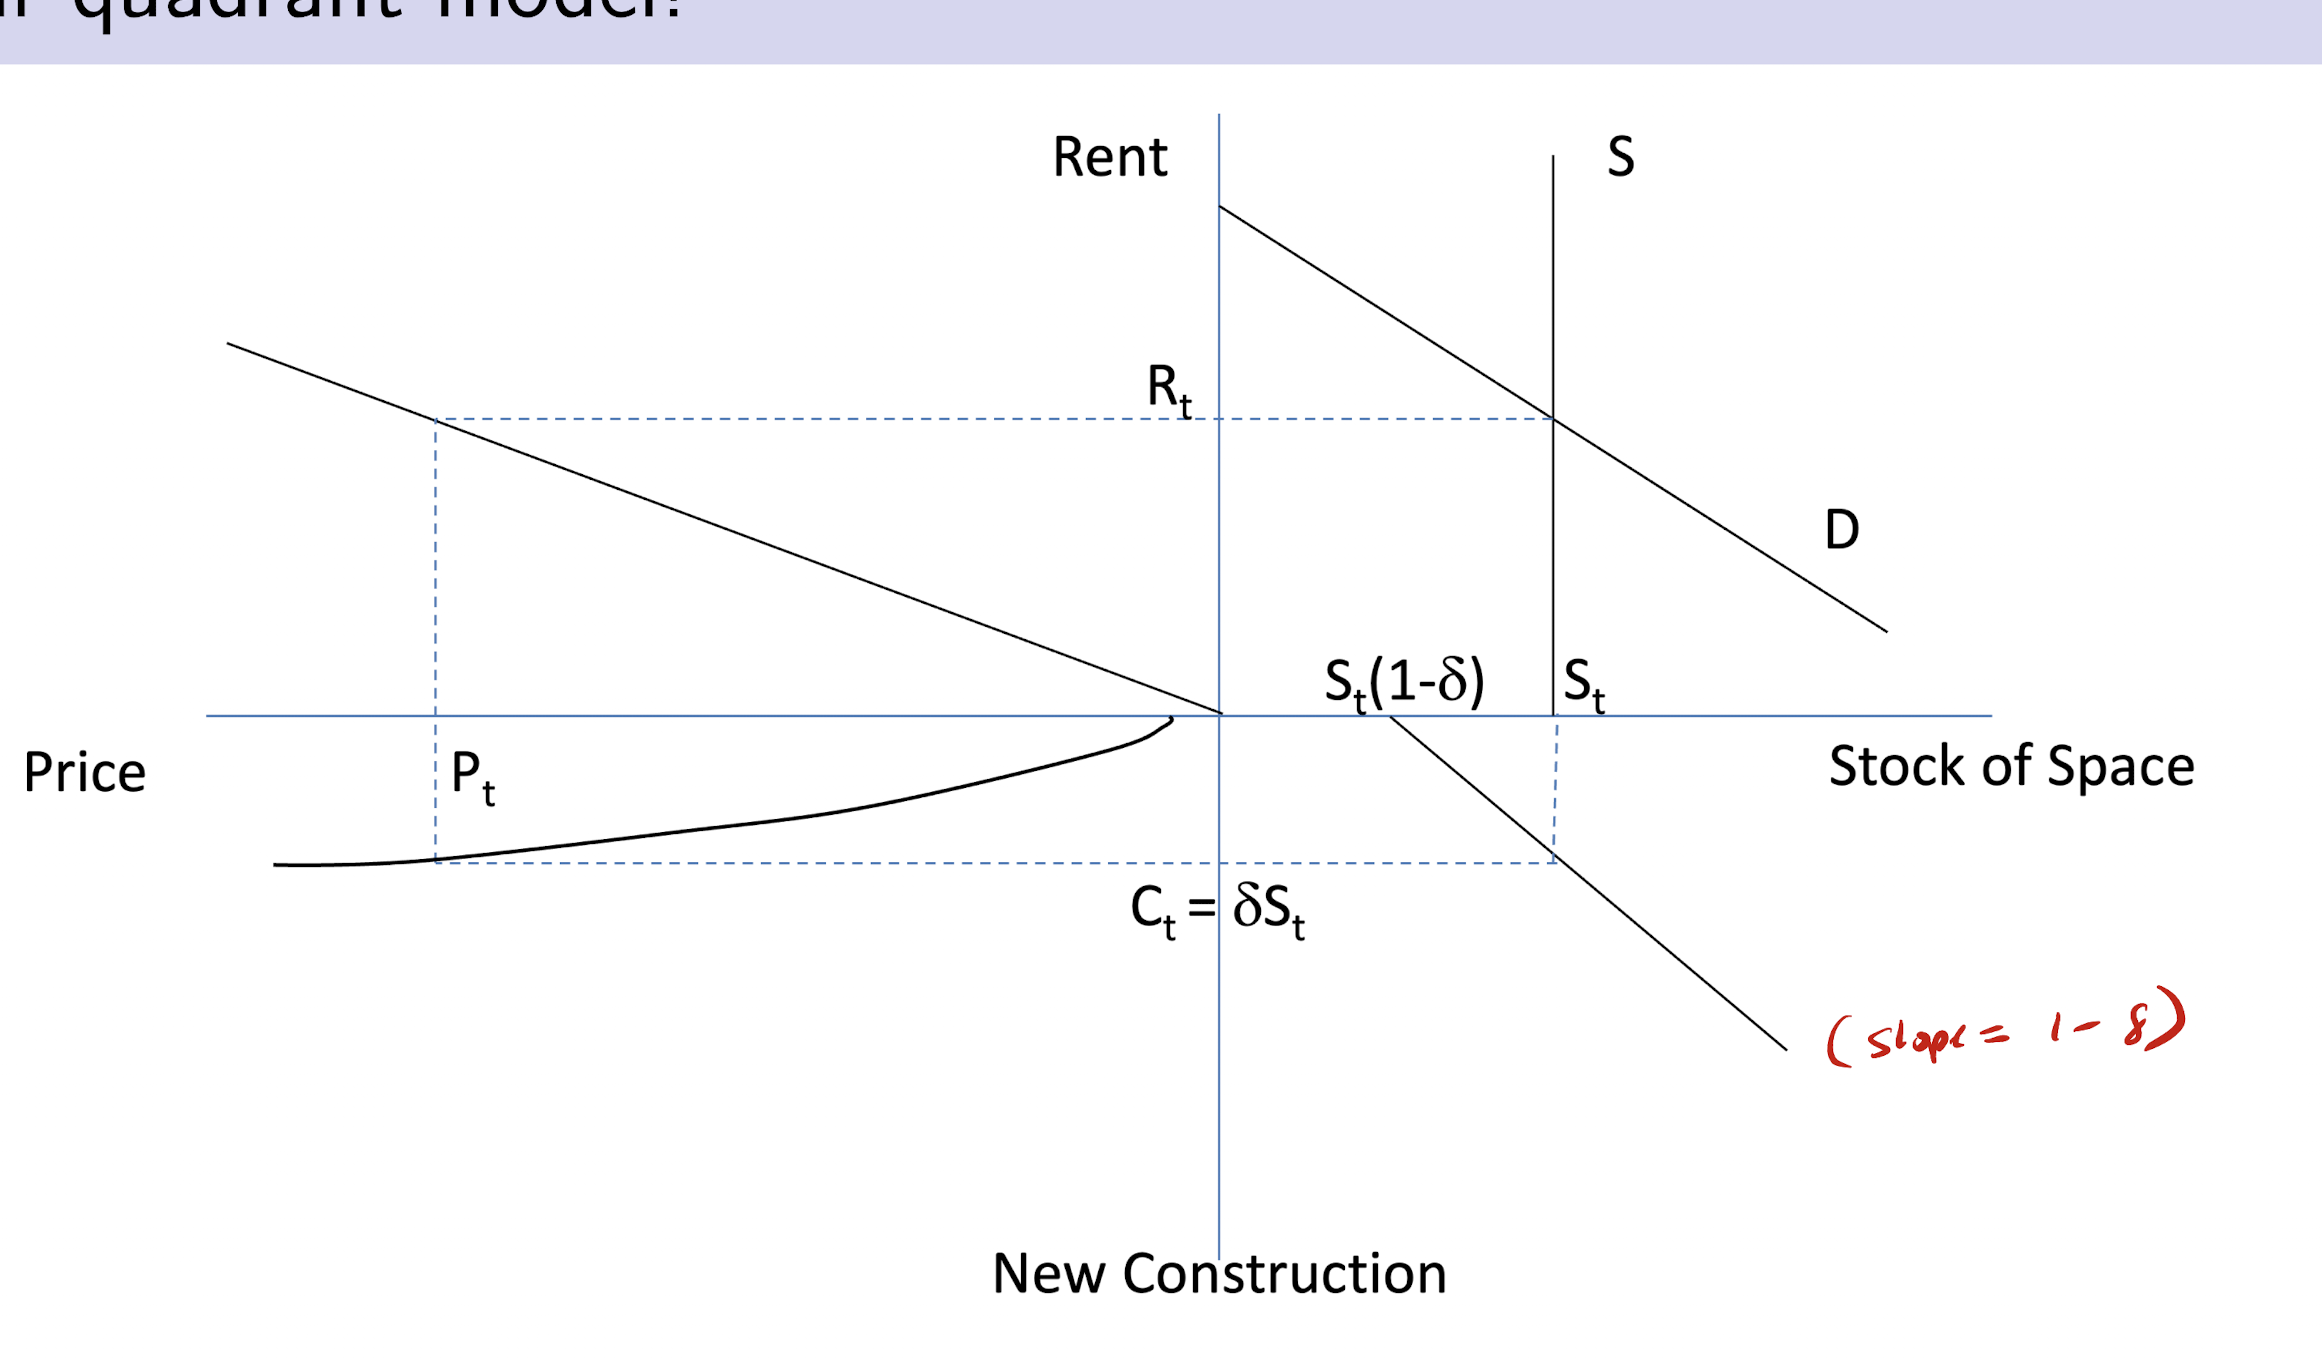
The four quadrant model
shocks have low adjustment because of
1) construction lags
2) slow depreciation of stock
Types of shocks in 4 quad model?
1) demand shocks (impact space market)
2) cap rate shocks (changes to i, g, or d) impact asset market
3) supply/construction costs (impact construction market)
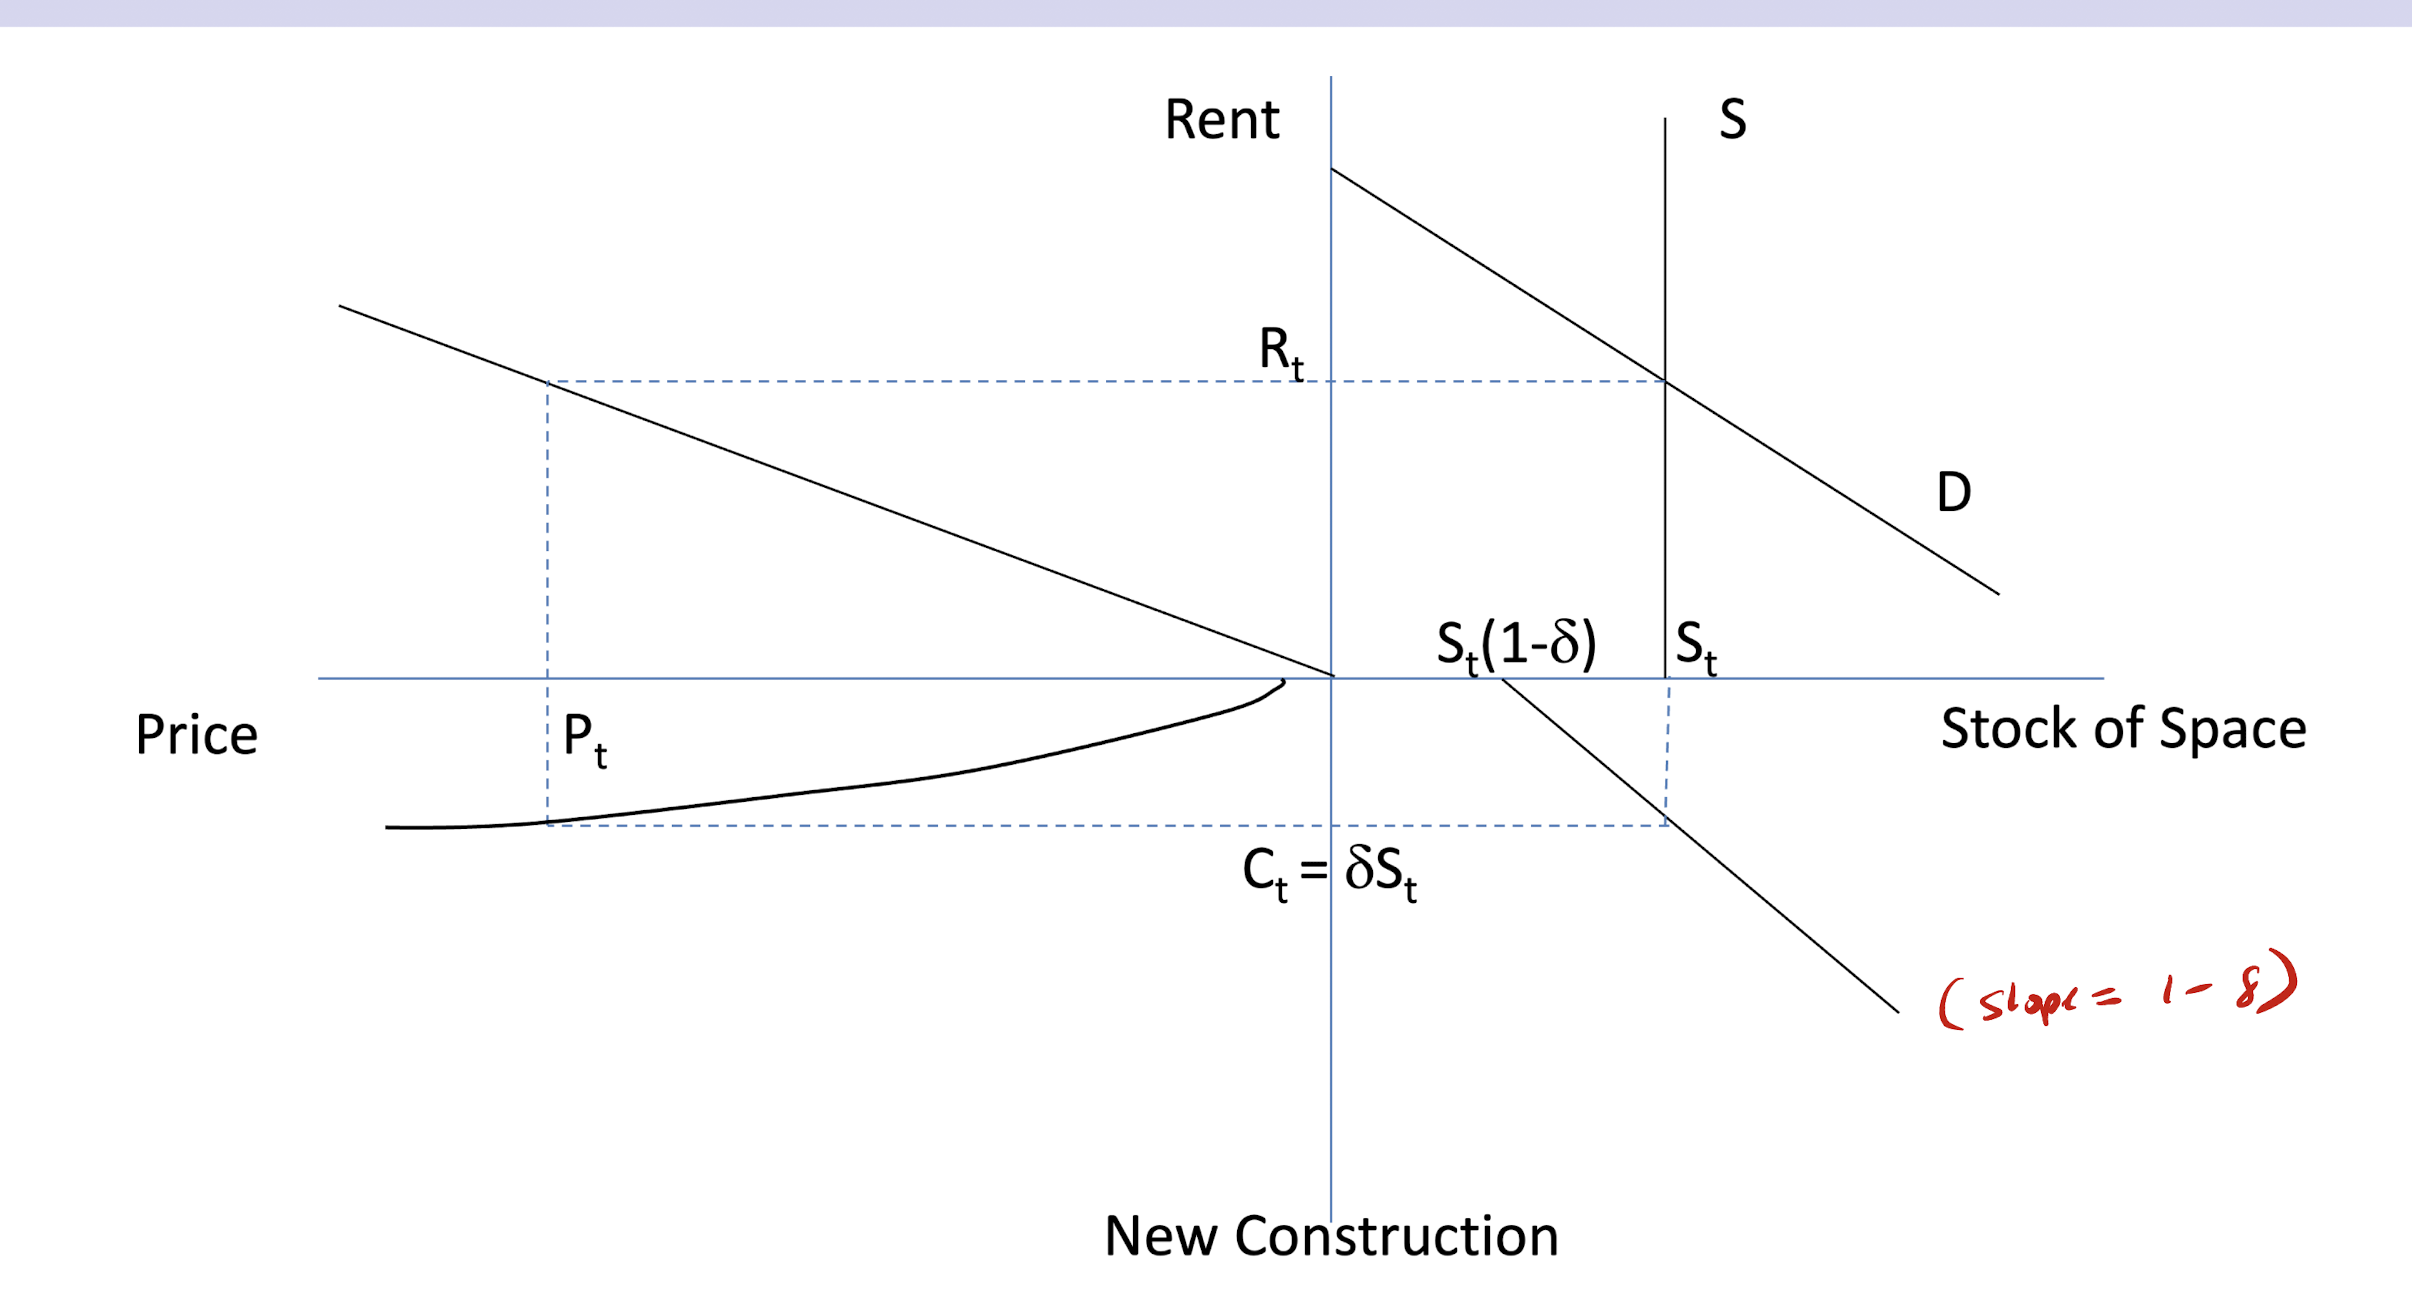
4 markets that determine real estate activity
1) space market clearing (UR
2) asset market clearing (UL)
3) construction market (LL)
4) stock market (LR)
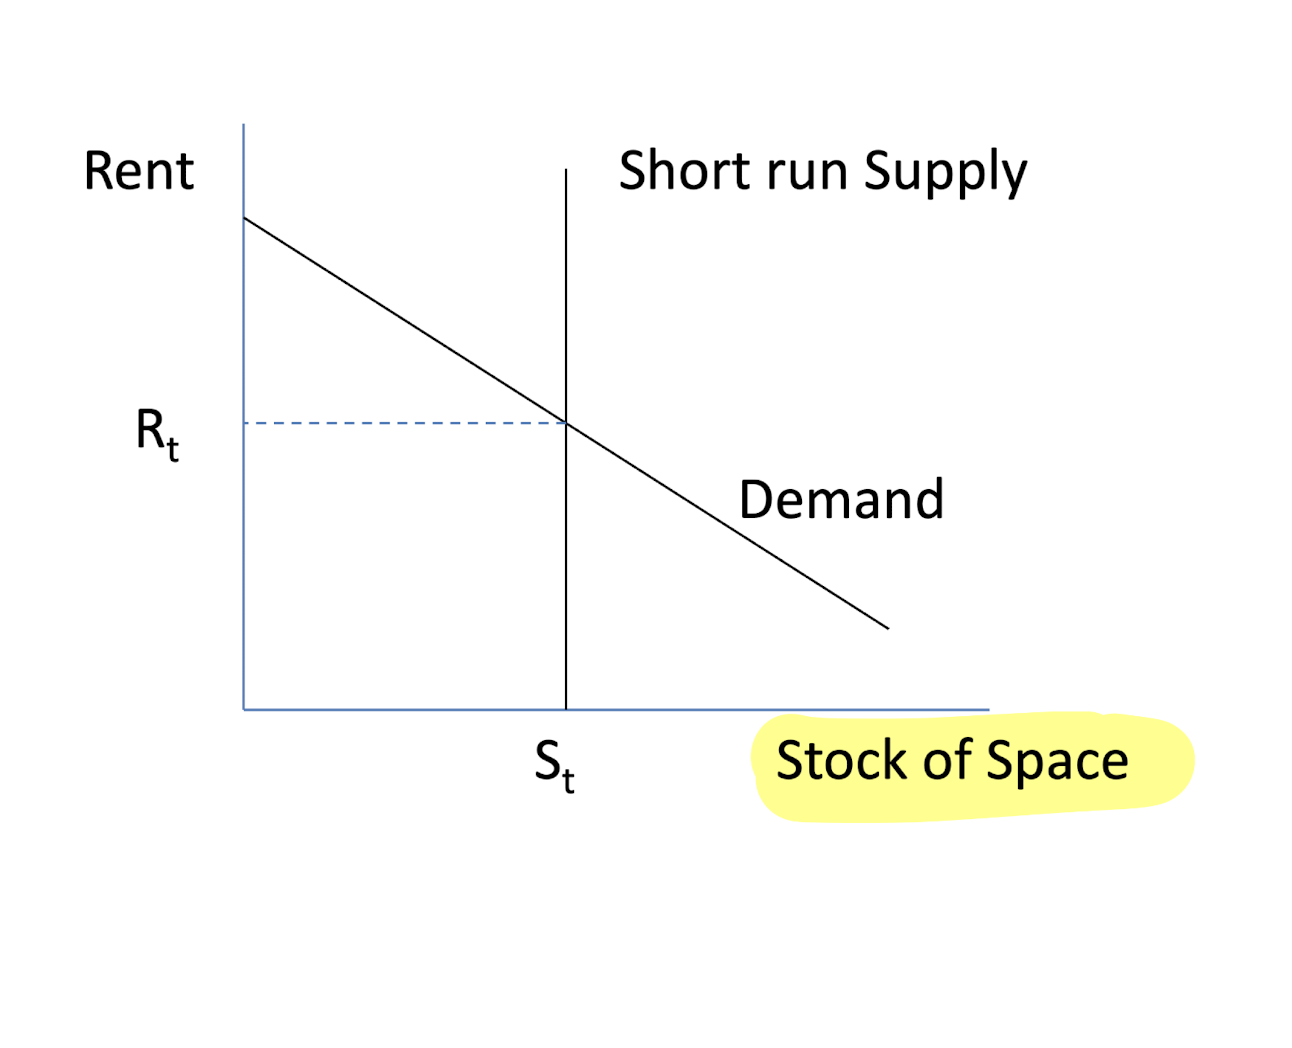
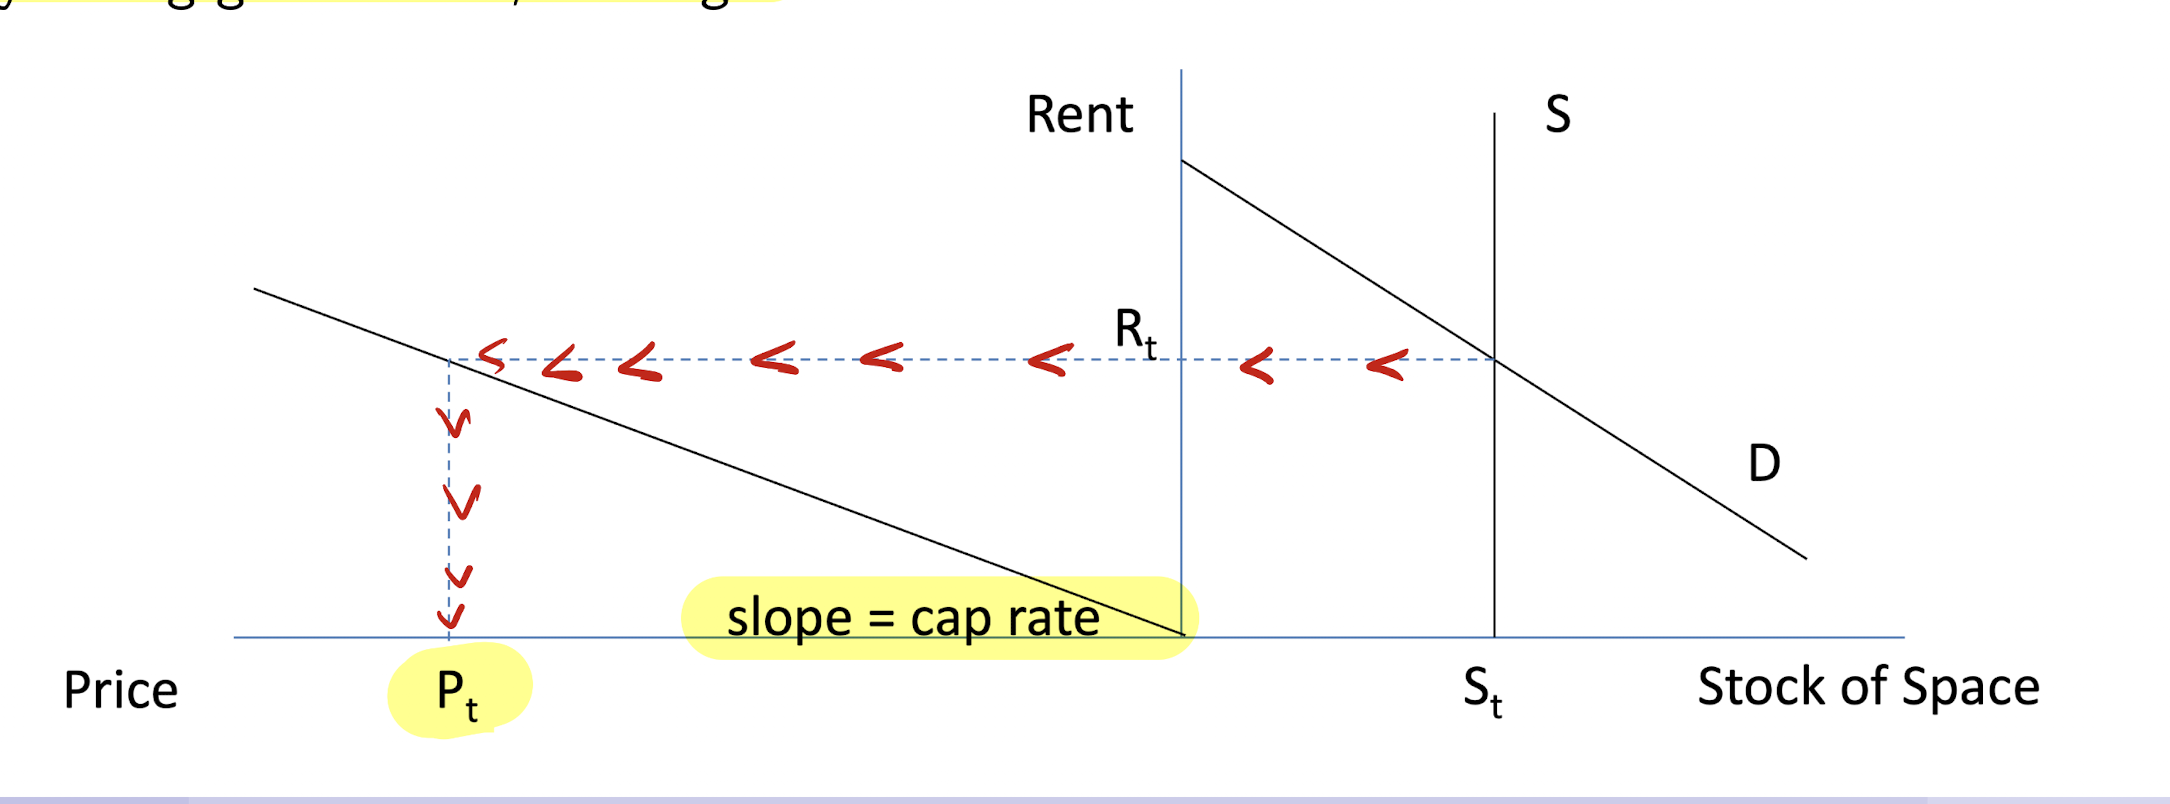
upper right quadrant (space market)
rents are determined by Q(s) = Q(D)
supply is perfectly inelastic in the short run
x-axis: stock of space
y-axis: rent
upper left quadrent (asset market)
developers want to know how much market rent converts into sales price
formula : price = rent/cap rate
X-axis: price
y-axis: rent
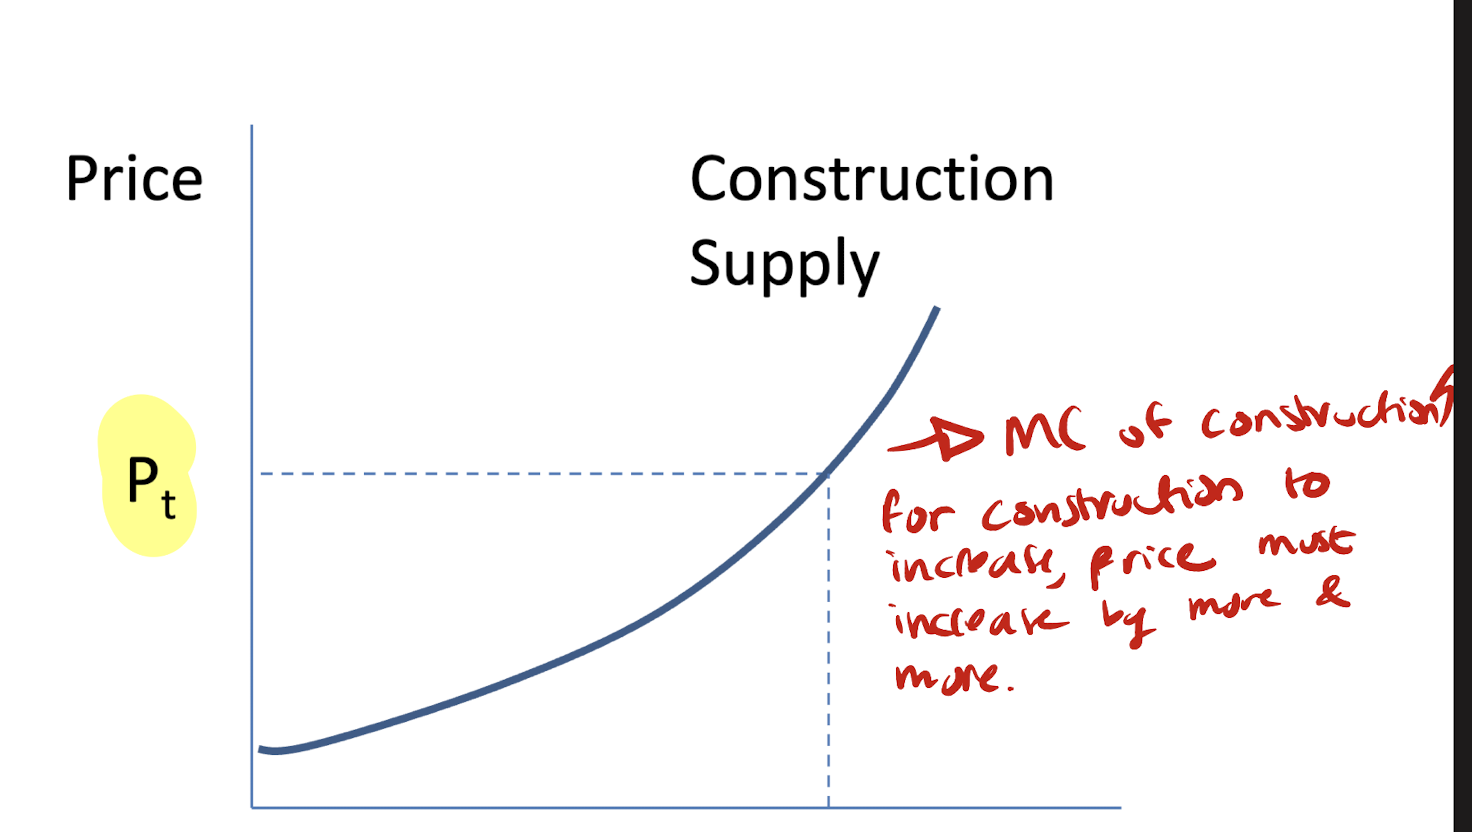
lower left quadrant (construction market)
new construction depends on price — developers build more if price is higher
slope: MC of construction —> increasing due to regulations/limited land availability/ higher tech with building taller buildings
x-axis: price
y-axis: newconstruction
lower right quadrant (stock market)
stable equilirbrium: C = D(s) s.t. change in stock is zero.
x-axis: stock of space
y-axis: new construction
slope : 1-d
Securitization
buying mortgages off bank balance sheets and selling to investors as canada mortage bonds
mortgages in canada terms
25-30 years amortization in 5 -year terms
why did the financial crisis occuer?
before 2000, lending was prime and 20% deposit
in 2000s, lending standards relaxes, lending to subprime with no downpayments or proper income verificiation
as home prices rose, banks believed that even if borrowers defaulted, they could sell the house to recover the money
however, as home prices began to fall, borrowers defaulted and this started the crsis.
Mian and Sufi study
collected equafix data on subprime lending based on zip codes
data showed negative relationship between income growth and subprime mortgages
data showed increase in mortgage debt relative to other non-mortgage debt
data showed increase in default rates
data showed increase in investors buying subprime MBS.
data showed reduction in denial rate for subprime borrowers relative to prime
What is a brokerage system
brokerage system connects buyers with sellers
why are agents needed?
1) connect buyers and sellers
2) have expertise in pricing and valuations
3) manage all the transaction logistics
Issuers of agents
1) market power
2) moral hazad
3) adverse selection
market power
commisions are high in real estate market
entry of more agents has not lowered commisions
listing on MLS requires a broker
brokerage fee is a % while all other selling costs are usually fixed
steering effect: agents can steer buyers towards high-commision homes.
moral hazard
are agents acting in the best interest of their clients
are they acting just as clients would if they were fully informed?
the incentives of both parties are not aligned
agents
agents have an incentive to do more deals rather than get a better price for clients.
adverse selection
can clients tell if agents are good or bad?
the commision structure makes it easy for amatures to enter the market
unobserved agent traits impact the clients experience,