Psych 217 (3rd half of class)
1/70
Earn XP
Description and Tags
Inferential Statistics, Special Research Design,
Name | Mastery | Learn | Test | Matching | Spaced |
|---|
No study sessions yet.
71 Terms
Descriptive Statistics
Summarizes/describes mass of data points
Inferential Statistics
Uses a sample to make generalizations and predictions about a population
inferential statistics
using data collected on a sample to infer what is happening in the population
We’ve studied descriptive stats so far, this allows us to observe main effects and ask whether what you found was due to random chance or not
Null hypothesis significance testing (NHST)
the most common type of inferential statistics
Steps of NHST
1) create a set of hypotheses and assume the null hypothesis is true
2) collect your data
3) calculate the probability of getting such data if the null hypothesis is true
4) Decide whether to reject or accept/keep the null hypothesis.
Null Hypothesis (Ho)
Baseline conservative assumption; no relationship between variables
IV does not affect the DV
no relationship between IV and DV
Research Hypothesis (H1 or Ha)
Often your hypothesis that you hope to be true (the one you are testing against the baseline)
IV affects the DV
There is a relationship between IV and DV
Example of a Research Hypothesis and null hypothesis
Sleep deprivation will have a significant effect on memory test scores
There will be no relationship between sleep deprivation and memory test scores
Requirements for the null and research hypothesis
Mutual exclusive and exhaustive
Mutually Exclusive
no overlap: both cannot be true at the same time
Exhaustive
must account for all possibilities
P-value (probability Value)
The probability of obtaining the data you got (or more extreme data) if the null hypothesis is true
is the difference between the values statistically significant?
No = high P Value
Yes = Low P Value
High P value
not statistically significant
pretty likely the results are by chance
accept null hypothesis
Low P-value
There is significance significance
pretty likely the results are not by chance
reject null hypothesis
there were main effects (there is an effect in your study, IV impacted DV)
0.05
P-value cut off
Reject the Null hypothesis
if the p-value is less then 0.05…
A p-value <= 0.05
means that assuming the null hypothesis is true, the probability of obtaining data as extreme as or more extreme than the data observed in this experiment is less then 5% (your findings are rare and are unlikely to have occurred due to chance)
Why 0.05?
Mathematically convenient, scientific consensus
True state of affairs
Describes the truth about the Null Hypothesis ( is it true or false) if you could sample the whole population (like observed score and true score)
Accurate reflection, undeniable reality of the data based on assumption that you have sampled from the entire pop
Hypothesis testing
estimating the truth/true state of affairs based on observed values
Type 1 error
rejecting the null hypothesis when it is actually true
“False alarm” claiming statistical significance when it isn’t
Type 2 error
retaining the null hypothesis when it is actually false
“miss” not claiming something is statistically significant when it is.
Example of type 1 error
Example of type 2 error
“You assert there is cancer, there is no cancer”
“You assert there is no cancer, there is cancer”
Power
the probability of correctly rejecting the null hypothesis
the ability to detect an effect if one truly exists
statistical power
inverse of type 2 error
lower power = more type 2 errors
Inverse of b
B
risk of committing a type 2 error
1-B
formula for power
Sample size, magnitude of effect (effect size), and alpha level
What are the 3 factors involved in power and type 2 error rate dependent on?
Sample size (N or n)
greater the sample size, greater the power
extra important to have larger sample size if expecting small effect size.
Magnitude of effect (effect size)
The larger the difference is in the population, the easier it is to detect, thus greater power.
Alpha level
The larger our alpha level, the easier it is to find data consistent with research hypothesis (reject null hypothesis) thus greater power.
Directional Hypothesis
Your alternative hypothesis suggests a particular direction
e.g. IV will effect DV positively
Non directional hypothesis
Your alternative hypothesis does not suggest a particular direction (ie. any change or difference is sufficient)
e.g. IV will lead to some change in DV
T-test
comparing two means
How do we obtain p-value when comparing means?
How likely is the difference we are observing between these means due to chance?
Obtained value
A statistic that captures the effect observed in your study
T-obt
Difference between conditions/variability in the data
What is the formula (conceptual) for t-obt?
Larger t-obt
What do you need to reject the null hypothesis in regards to t-obt?
How big the difference between the means are
what does the numerator of the t-obt equation tell us?
How much variation exists around the means
What does the denominator of t-obt equation tell us?
larger t-obt
Bigger mean difference, bigger numerator equals?
Smaller t-obt
More variance, bigger denominator equals?
signal and noise
Numerator and denominator can also be seen as?
small sample size, poorly worded questions, confounding variables.
What things increase noise/variance in t-test?
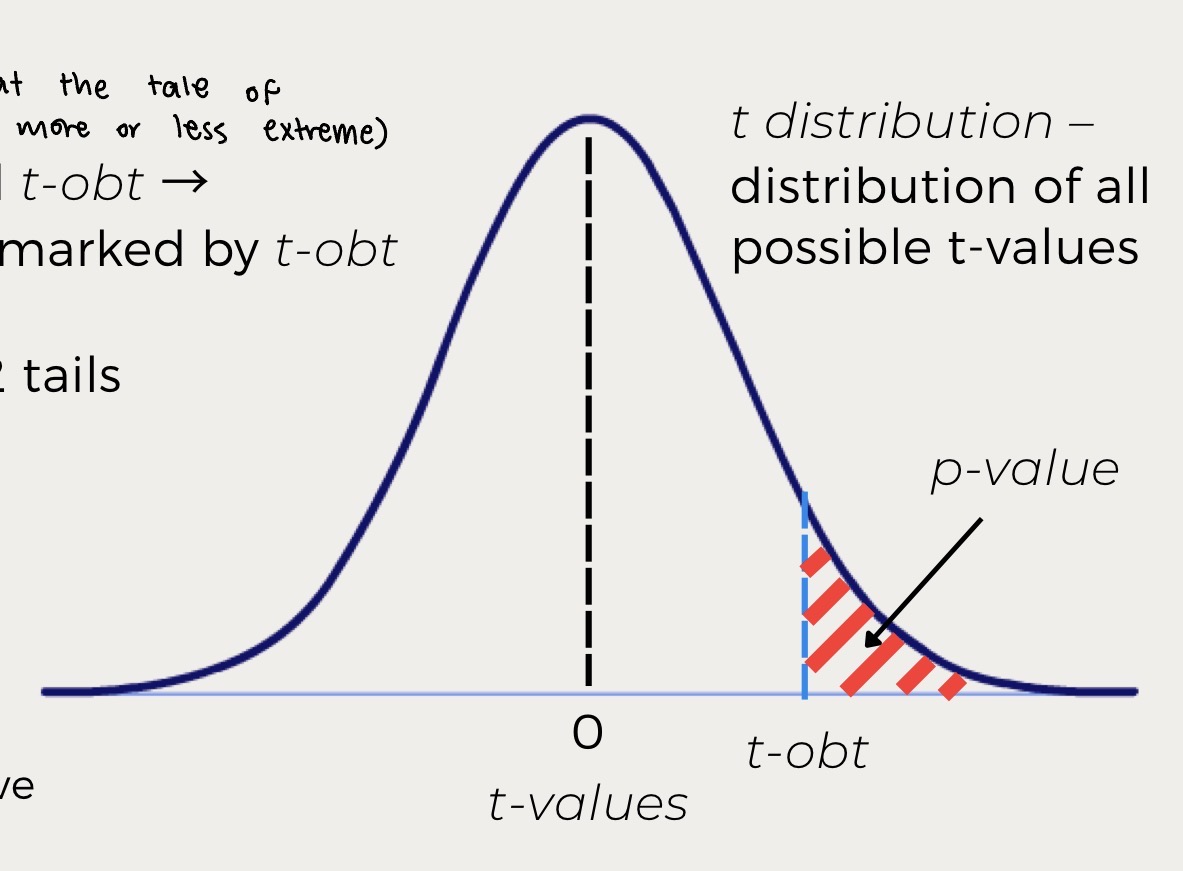
T distribution
distribution of all possible t-values
relationship between p value and t-obt
P value is the are under the tails marked by t-obt
the probability of observing a score that is equal to or more extreme than our observed score
P value
obtained t value (t-obt) is equal to?
Alpha
Critical t value is equal to?
Retain null
if t-obt is less then t-crit then we?
reject null
if t-obt is greater or equal to t-crit, we?
P hacking
A set of ethically questionable practices researchers use to get significant results
e.g. changing the size of your sample in order to obtain a p value that is significantly significant.
P-hacking
tossing out participants data that disagree with your hypothesis is a form of what?
P-hacking
Using multiple measures of same construct, only reporting results of one that shows significance is an example of?
P-hacking
if a researcher finds no significance and finds and reports random interactions that are significant as though you predicted them is an example of what?
Ethics and Unrealistic/impossible
What are the limitations of experimental design?
Quasi-experimental design
Experiments that have most, but not all, of the elements of a true experiment
no randomization
uses pre-existing or self-assigned groups
Randomization is not possible or realistic
No randomization and outcome variables measured
What are the similarities between quasi experimental and correlational
there is manipulation, but researchers can’t truly manipulate it
what is the difference between quasi experimental and correlation?
One group post test only, one group pre test/post test, non-equivalent control group post test only, and non equivalent control group pretest posttest
what are the 4 types of quasi-experimental design?
No baseline to compare results too
What is the limitation of one group post test only design?
There is no control group
What is the limitation of one group pre-test/post test design?
selection bias and having no baseline equivalent
What are the limitations of non-equivalent group post test only design?
Criteria for claiming causality
Covariation of cause and effect (X changes, Y also changes)
Temporal precedence (Changes in X come before changes in Y)
Ruling out alternative explanations (Changes in Y are caused by X and not other variables)
Interrupted time series
Similar to one-group posttest design, but with many more pretest and posttest
type of multiple-repeated measures design
often used to measure the effect of a natural manipulation