Lec 8: Chapter 10 & 11
1/21
Earn XP
Description and Tags
Repeated measures T test and ANOVA (ANALYSIS OF VARIANCE)
Name | Mastery | Learn | Test | Matching | Spaced |
|---|
No study sessions yet.
22 Terms
What are dependent-samples t test?
This is a sample where participants are related.
What is an independent sample and a dependent sample?
An independent sample is one in which different participants are observed in one time in each group.
A dependent sample is one in which participants are observed in more than one treatment or matched on common characteristics.
What are the two types of research designs used when selecting dependent samples?
Repeated measures design: the same participants are observed in more than one group or treatment. For examples, a pre-post design and within-subjects design.
Matched-pairs design: participants are matched experimentally or naturally, based on common characteristics or traits (gender or iq score). Scores from each matched pair of participants are compared.
Why are difference scores found before computing the test statistic for dependent samples t test?
It eliminates the source of error associated with observing different participants in each group or treatment. This reduces the standard error and increases the power to detect an effect.
What are the advantages and disadvantages for selecting dependent samples?
Places focus on the change due to the manipulation
Yields more power: Levels out individual differences, removes subject differences, influences the size of the standard error
More practical for researchers
Repeated testing might result in changes in other unpredictable ways: patient fatigue or annoyance, drug carry over effects
Might also result in measurement problems: memory of previous test (confounding variable)
How do you calculate the degrees of freedom for a dependent-samples t test? How do you locate the critical values in the t table?
Sample size (number of differences) minus 1: n-1
Alpha level, degrees of freedom, one or two tailed test
What are the assumptions made for the dependent-samples t test?
Normality: assume that the data in the population of difference scores are normally distributed. But with larger samples (n>30) this is less important.
Independence within groups: although the samples are related or matched between groups, assume that the difference scores are obtained from different individuals within each group or treatment.
How do you calculate a dependent-samples t test? How do you interpret the results?
Set up the hypotheses (null and alternative): testing the null hypothesis that the mean difference is zero
Determine the critical region: alpha, one or two tailed test, degrees of freedom
Calculate the test statistic: mean difference, sample standard deviation, standard error of the mean difference, observed t value
Make a statistical difference: reject or retain null hypothesis, then relate to the research
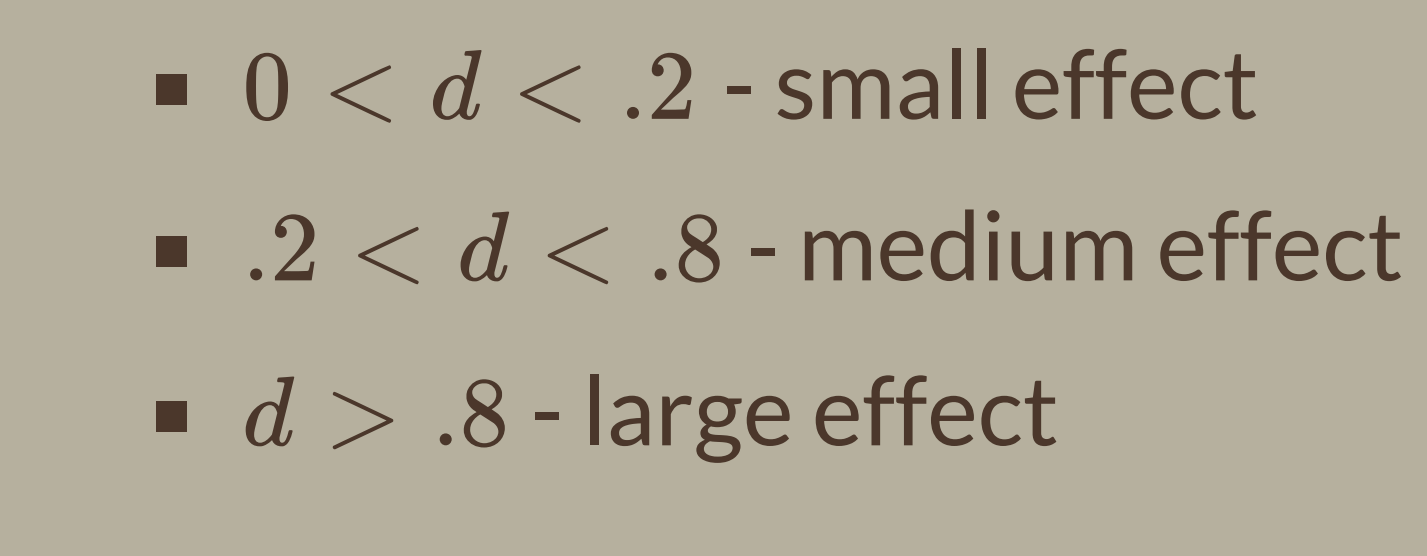
How do you compute and interpret the effect size for a dependent-samples t test?
Cohen’s d: mean difference over the standard deviation of difference scores.
How do you compute and interpret the confidence intervals for a dependent-samples t test?
Choose the level of confidence based on the alpha level (95% or 99 %)
Find the critical values at the level of confidence
Calculate: mean difference plus/minus Tcrit multiplied by the standard error for difference scores
How do you summarize the results of a dependent-samples t test in APA format?
Report the test statistic, degrees of freedom, p value, whether the statistic is significant or not, effect size.
Relate it to the research
What is the analysis of variance test?
ANOVA is a statistical procedure used that measures the variance among two or more groups where the variance of one or more populations is unknown.
What is ‘k’ in ANOVA?
The number of groups or different ways in which an independent or quasi-independent variables can be observed.
When are analysis of variance test used for tests of a single factor?
When different participants are observed in each group or at each level of a treatment with two or more levels
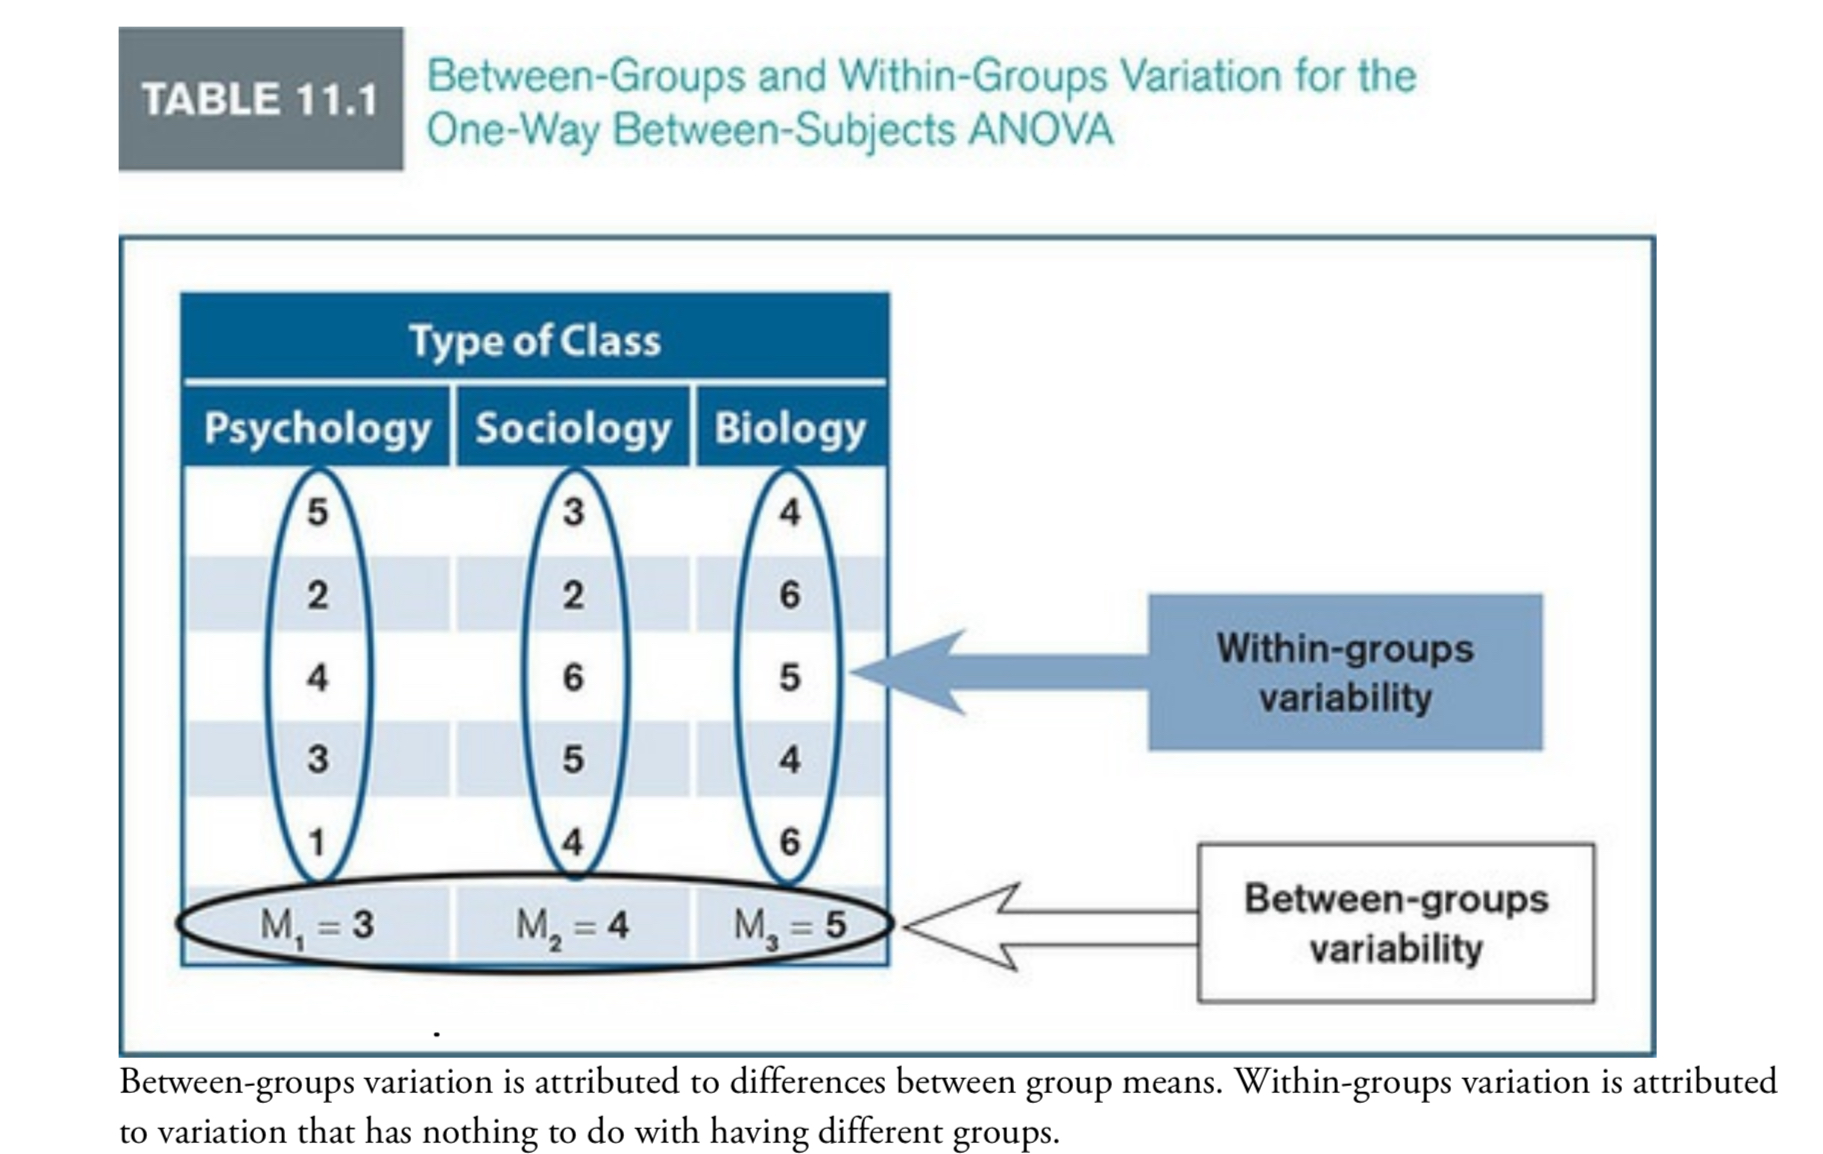
What are the sources of variation for in a one way between subjects ANOVA?
Between-groups: the variation attributed to difference between group means
Within-groups (Error variation) : variation attributed to the mean differences within each group
Are the terms mean square and variance different?
No, they mean the same thing
How do you compute the test statistic for ANOVA?
The F obtained is the test statistic for ANOVA. It is computed as the mean square between groups over the mean square error.
What does the F obtatined for ANOVA determine?
It determines how large or disproportionate the differences are between group means compared to the variance expected to occur by chance.
the larger the differences between the group means the larger the F ratio becomes
What is the null hypothesis for the F statistic?
Because the F statistic evaluates how much variance is due to groups and how much is due to error. When the variance attributed to the groups is equal 1, it means both are the same value.
If the null hypothesis is true: F will equal to 1.0, meaning the groups do not differ. Or F=0, if variance of group means is 0.
How do you calculate the degrees of freedom for ANOVA?
Because there are two sources of variation for the one-way-between-subjects ANOVA:
Degrees of freedom between groups: number of groups (k) - 1
Degrees of freedom error: total sample size (N) - 1
How does the degrees of freedom affect the F distribution?
As the value for k, N or n increases, the total degrees of freedom increases. As the total degrees of freedom increases, the F distribution becomes less skewed.
The tail of the F distribution is pulled closer to the y axis
How do yo locate the critical values for ANOVA?
Using the F table: locater the degrees of freedom numerator, the degree of freedom denominator.
As the degrees of freedom increase the critical values get smaller. Smaller critical values are associated with greater power to detect an effect.