Community Diversity and Structure in Ecology
1/68
There's no tags or description
Looks like no tags are added yet.
Name | Mastery | Learn | Test | Matching | Spaced |
|---|
No study sessions yet.
69 Terms
Community
An association of interacting species in an area.
Community Ecology
Study of species interactions and abiotic factors.
Community Structure
Composition and abundance of species in a community.
Guild
Group of species sharing similar resource use.
Species Richness
Total number of species in a community.
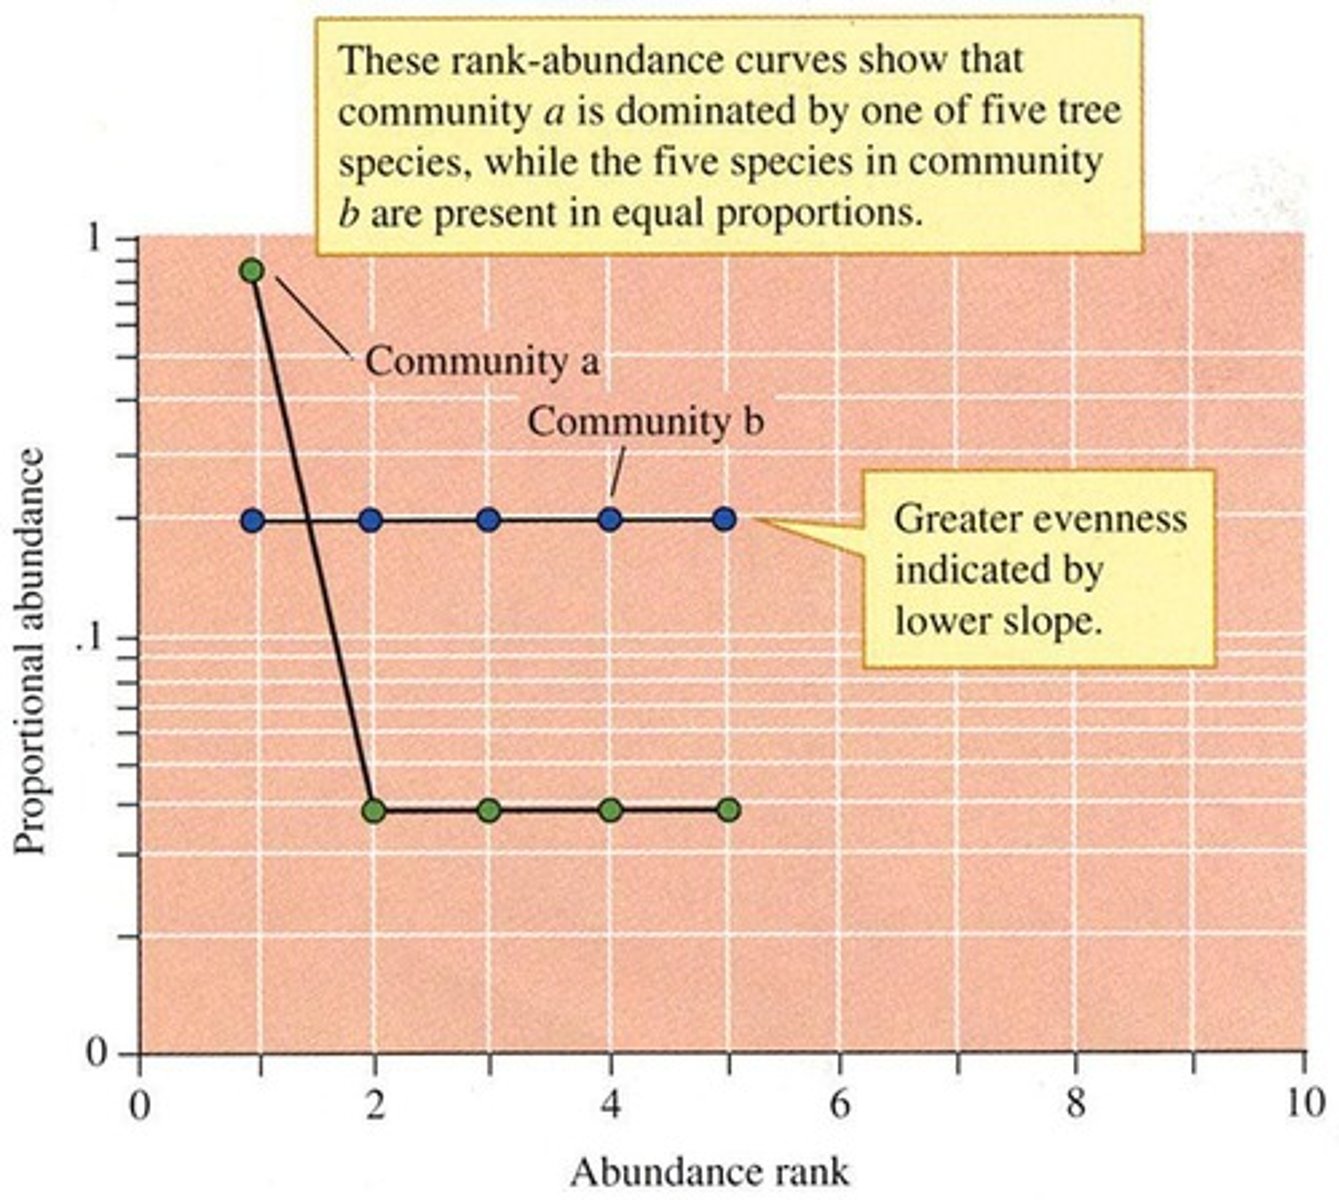
Species Evenness
Relative abundance of different species in a community.
Lognormal Distribution
Species abundance typically follows this distribution.
Shannon-Wiener Index
Measures diversity considering species richness and evenness.
Simpson Index
Probability that two individuals are of the same species.
Rank-Abundance Curve
Graph showing species abundance against rank.

Environmental Complexity
Variety of habitats leading to increased species diversity.
Species Interactions
Relationships between species affecting community dynamics.
Disturbances
Events that disrupt community structure and dynamics.
Heterogeneity
Variation in habitat complexity influencing species diversity.
Niches
Specific roles or positions of species in an ecosystem.
Predation
Interaction where one species consumes another.
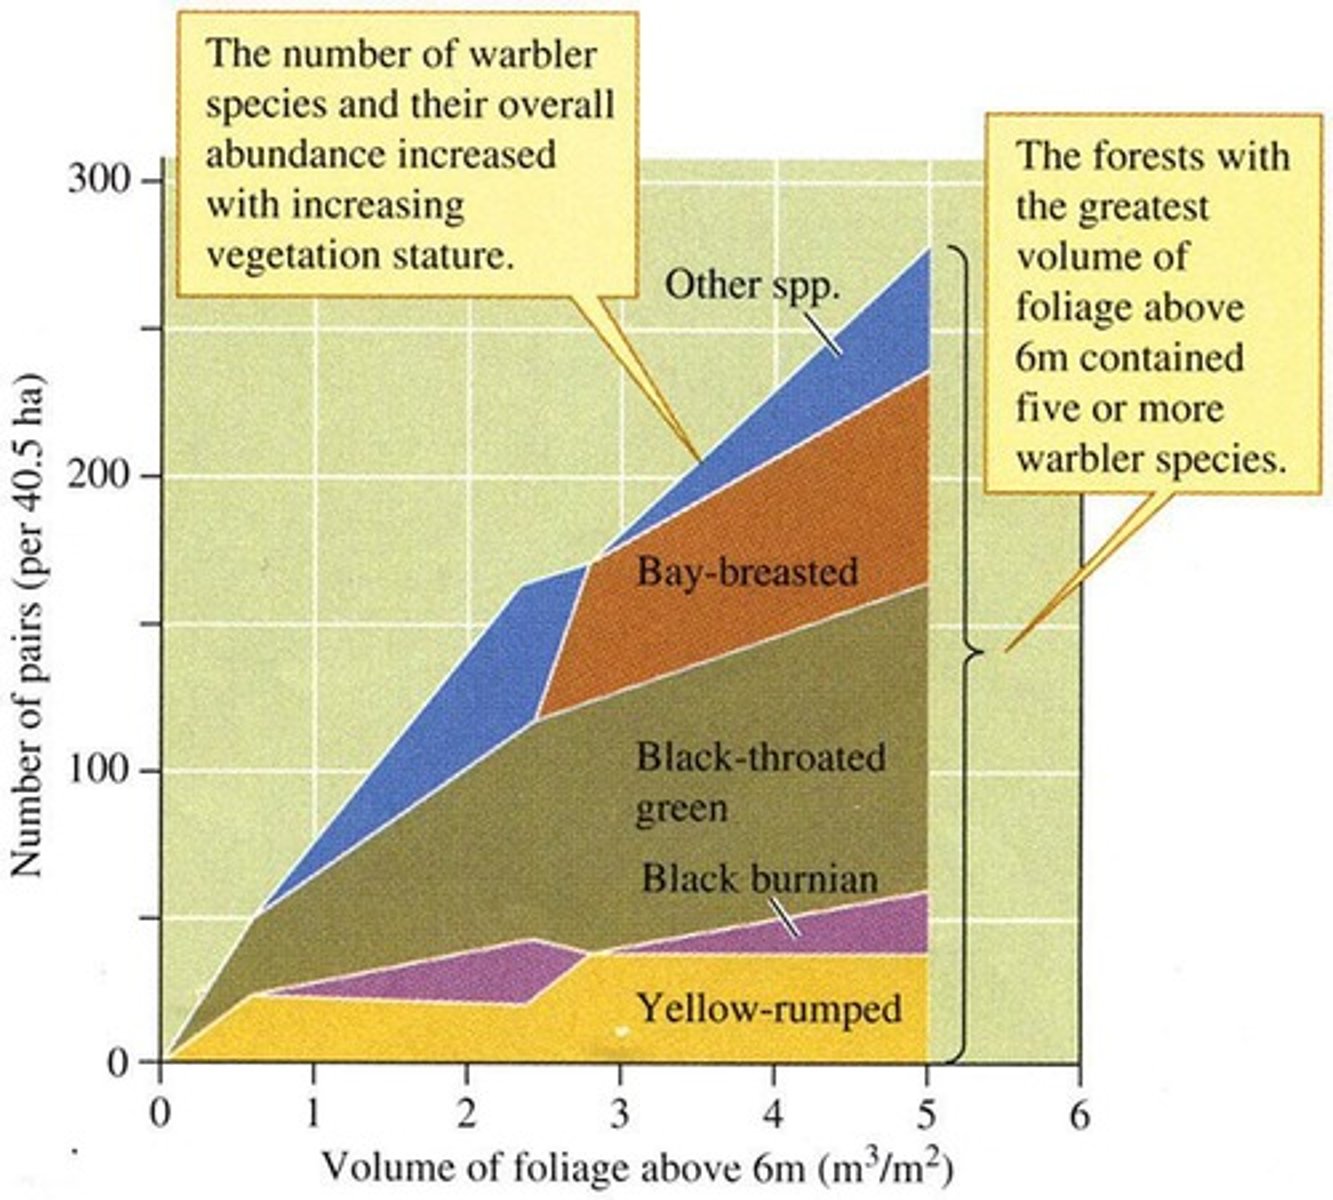
MacArthur's Warblers
Study of species relying on foliage complexity.

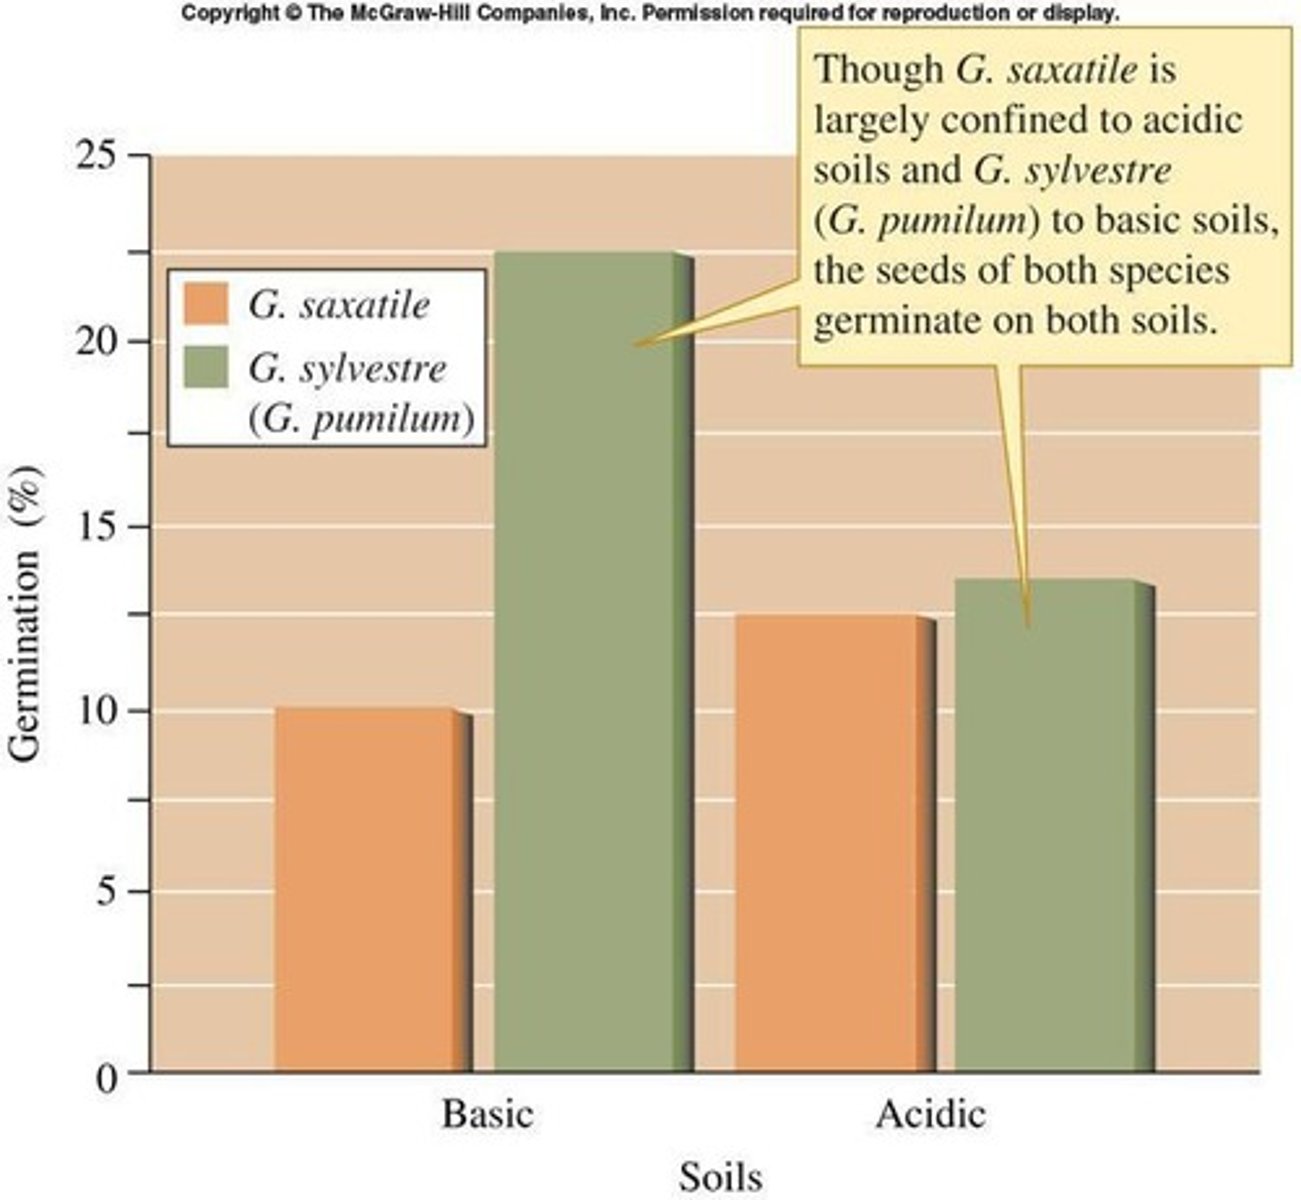
Galium saxatile
Plant species influencing habitat and competition.

Galium sylvestre
Another plant species affecting community composition.
Mathematical Metrics
Quantitative measures used to assess community diversity.
Community Functioning
How community characteristics influence ecosystem processes.
Abundance
Total number of individuals of a species.
Community Diversity
Number of different species in a community.
Community Structure
Interactions of all species in a community.
Species Interactions
Relationships between different species affecting diversity.
Predation
Predator suppresses dominant competitors, increasing diversity.
Competition
Resource partitioning increases community diversity.
Environmental Complexity
Variety of habitats and niches in an ecosystem.
Area of Refuge
Safe space for species to avoid competition.
Area of Overlap
Regions where species share resources.
Center of Accumulation
Location where species gather due to favorable conditions.
Center of Origin
Geographic area where a species first evolved.
Primary Producers
Chemo- or photoautotrophs that generate energy.
Primary Consumers
Herbivores that consume primary producers.
Secondary Consumers
Carnivores that eat primary consumers.
Tertiary Consumers
Carnivores that eat other carnivores.
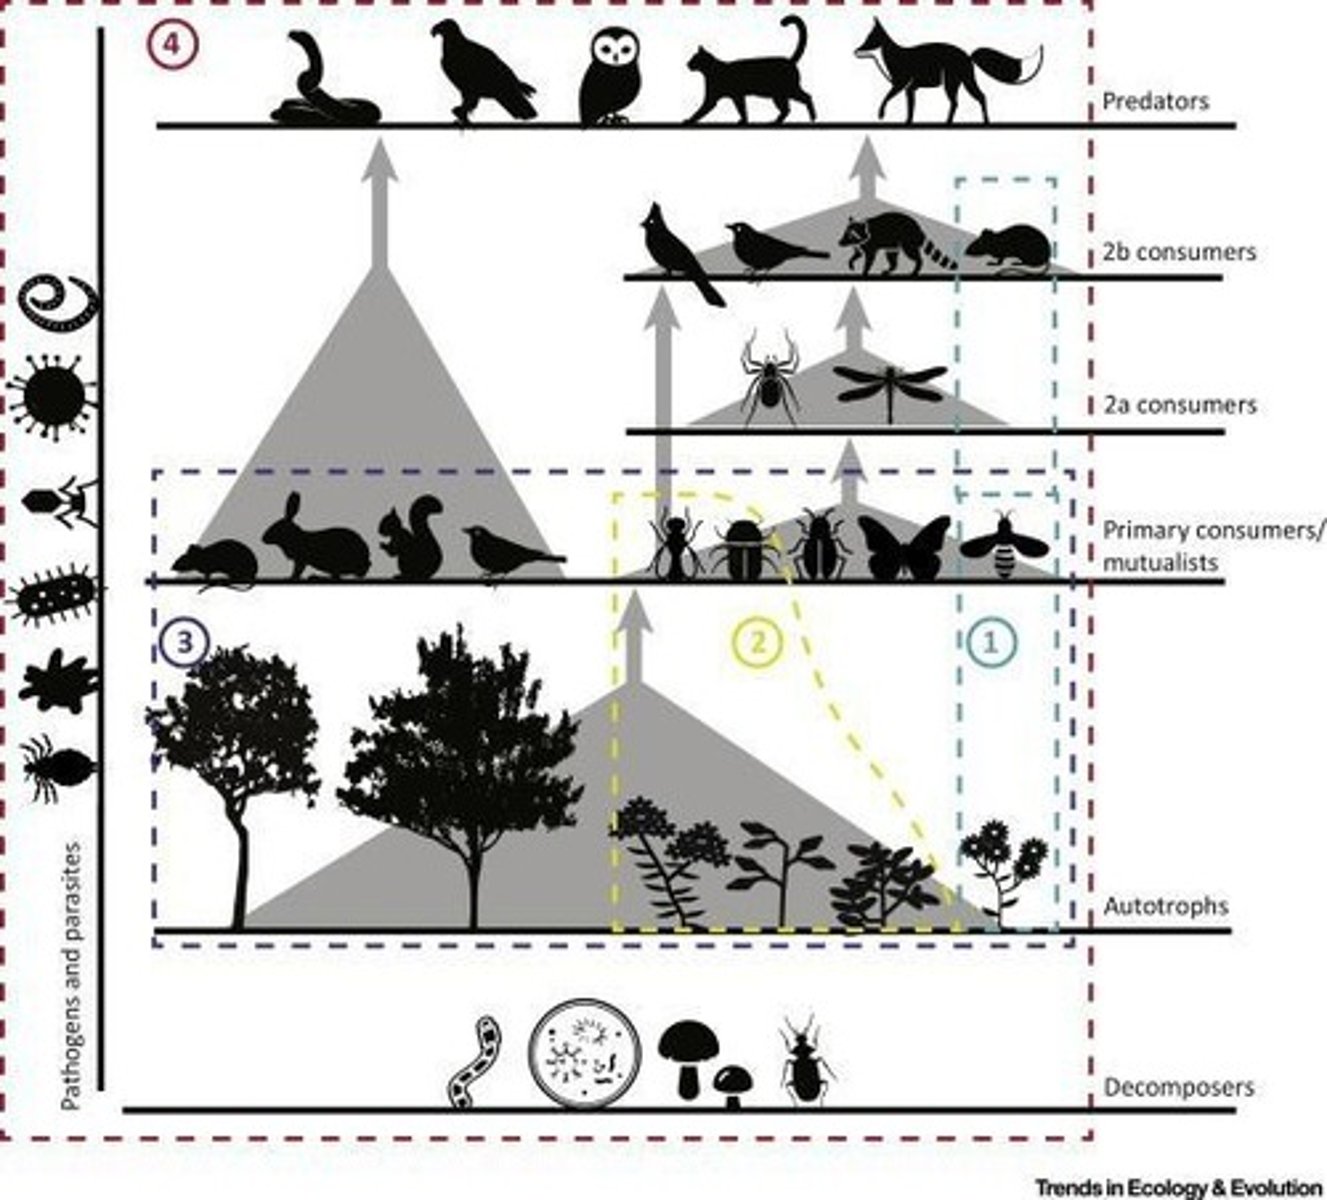
Food Web
Diagram showing feeding relationships in an ecosystem.

Trophic Levels
Hierarchical levels in a food web based on energy flow.
Feeding Interactions
Connections between species based on consumption.
Strong Interactions
Influential feeding relationships affecting community structure.
Weak Interactions
Less significant feeding relationships in a community.
Indirect Commensalism
One species benefits another indirectly without harm.
Apparent Competition
Negative impacts due to shared predators among species.
Species Richness
Variety of species present in a community.
Disturbances
Events that disrupt community structure and diversity.
Trophic Cascade
Indirect interactions affecting food web dynamics.
Bottom-up Control
Ecosystem regulation starting from primary producers.
Top-down Control
Ecosystem regulation starting from top predators.
Keystone Species
Species with large impact on community structure.
Community Structure
Arrangement and organization of species in an ecosystem.
Altered Stable State
Shift from established community to a new one.
Ecosystem Engineer
Species that modify habitats for other organisms.
Consumer-Resource Interaction
Relationship where consumers feed on resources.
Introduced Species
Non-native species affecting local ecosystems.
Invasive Species
Introduced species that disrupt local biodiversity.
α-diversity
Number of species in a specific location.
β-diversity
Variation in species between different sites.
Energy Flow
Transfer of energy through trophic levels.
Trophic Level
Position in food chain, from producers to consumers.
Primary Producer
Organisms that produce energy via photosynthesis.
Primary Consumer
Herbivores that consume primary producers.
Secondary Consumer
Carnivores that eat primary consumers.
Tertiary Consumer
Top predators in a food web.
Assimilation Efficiency
Percentage of consumed energy used for growth.
Ecological Efficiency
Energy transfer efficiency between trophic levels.
Ecological Pyramid
Graphical representation of energy distribution.
Extinction Events
Loss of species, often at top trophic levels.
Invasion Events
Introduction of species, often at lower trophic levels.
Biomass Loss
Energy loss during transfer between trophic levels.