Biology Data Test
1/34
There's no tags or description
Looks like no tags are added yet.
Name | Mastery | Learn | Test | Matching | Spaced |
|---|
No study sessions yet.
35 Terms
p value for significantly different
<0.05
p value for highly significantly different
<0.01
species richness
the number of species in a given area
ways of calculating species richness
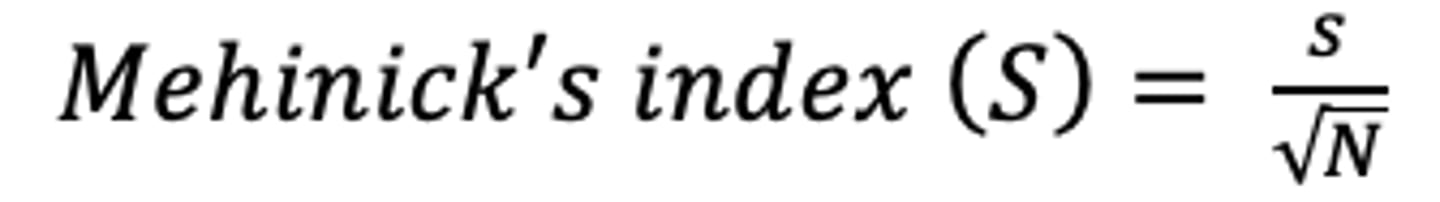
Menhinick's index
Counting number of species
Menhinick's index formula
number of species in a sample/square root of number of individuals in sample
Higher Menhinick's index
higher species richness (not evenness)
species evenness
relative abundance of each species
percentage frequency
the percentage of the total quadrat number that the species was present in
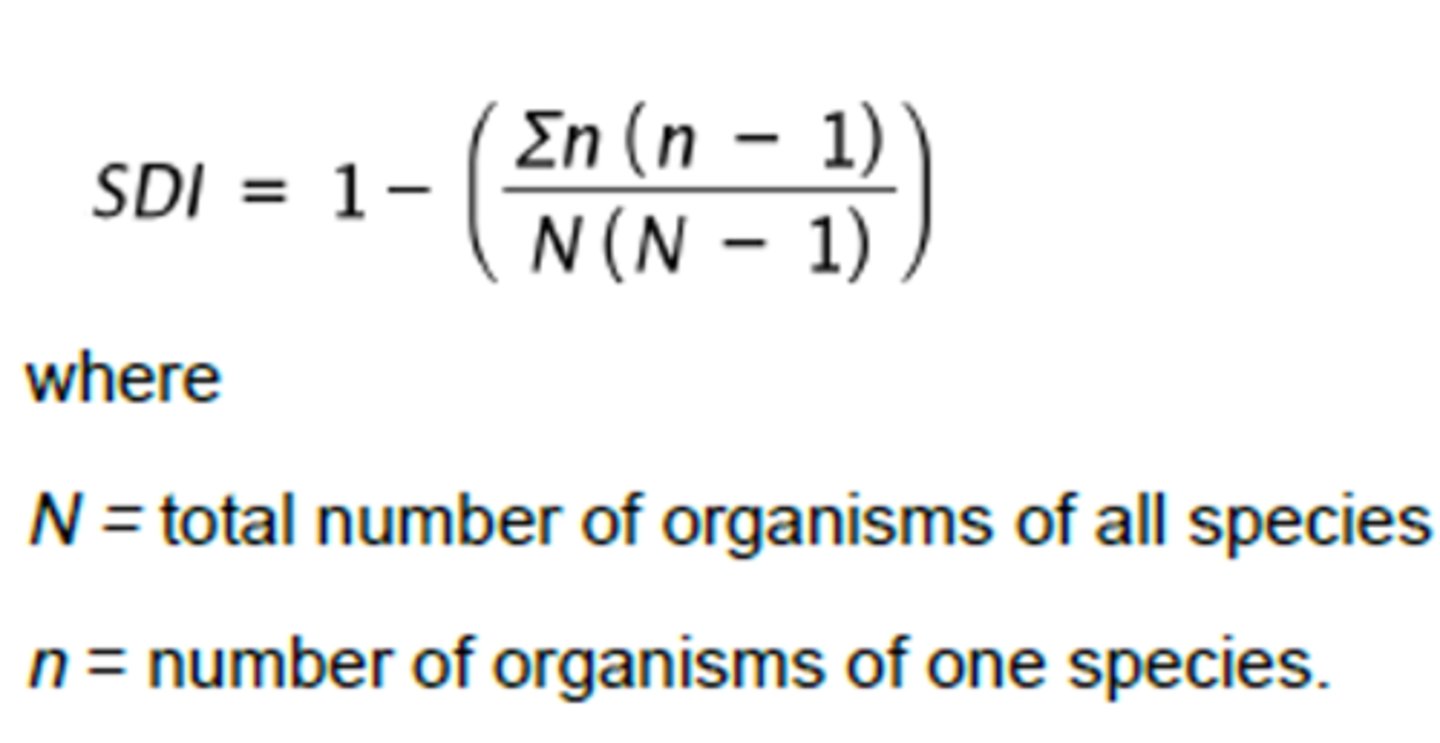
Simpson's diversity index measures
species diversity (richness and evenness)
SDI = probability that two organisms are from the _____ species
different
SDI formula
Population change
(births + immigration) - (deaths + emigration)
negative change = decrease in population
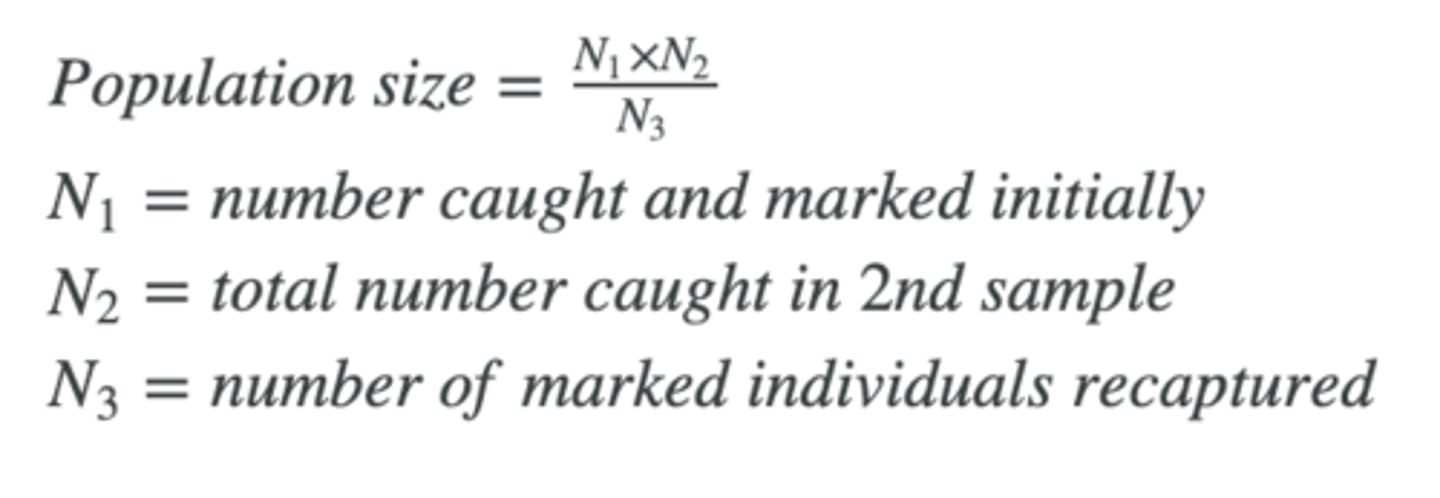
Lincoln index estimates
size of population for moving animals
Lincoln index formula
r selected organisms
rapid reproduction, less time to reach reproductive maturity
exhibit little parental care
lichens
Pioneer species
Shorter lifespan
Produce offspring quickly and many offspring at a time
Fix nitrogen from the air
Photosynthesise
Tolerate extreme abiotic conditions
Disperse seeds quickly
r selected
Climax community has _____ biomass
higher
Types of density independent factors
regular abiotic conditions (eg. salinity, light levels)
irregular disturbances (eg. flood, fire, drought)
sum of limiting factors
environmental resistance
k selected organisms
very competitive for resources
live in stable environments
exhibit extensive parental care
float around
planktonic
swim around eg. fish
nektonic
can move but move slowly
sedentary
don't move
sessile
above mean high tide
supralittoral zone
slash zone
between mean high tide and mean low tide
littoral/intertidal/eulittoral
below mean low tide
sublittoral
rarely exposed to air
Percentage abundance formula
no. of individuals in a species / total number of individuals for all species
range of abiotic factors where species can best survive
optimal range
range of abiotic factors where species can tolerate conditions but suffer physiological stress
tolerance range
community
a group of populations
population
group of individuals of the same species living in the same area at the same time
Why does biodiversity increase during primary succession? Why does the height and density of plants change?
hummus and organic matter increases
Soil becomes more suitable for vegetation other than pioneer species
increase in microhabitats and immigration
as density of vegetation increases, temperature levels
decrease
shell
protects from higher temp and lack of water