L03 - Exploratory Data Analysis
1/18
Earn XP
Description and Tags
1. What is data? 2. Data Collection 3. Data Quality 4. Use Case: Aircraft Engines 5. Exploratory Data Analysis
Name | Mastery | Learn | Test | Matching | Spaced | Call with Kai |
|---|
No analytics yet
Send a link to your students to track their progress
19 Terms
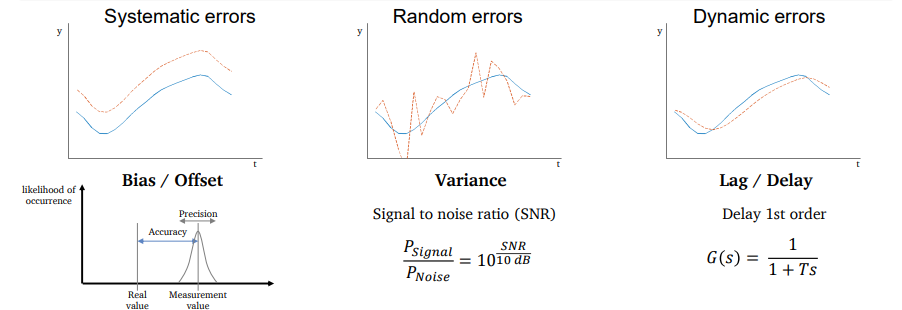
Illustration of measurement errors
Errors can be classified into three types that can overlap.
What are the measurement errors?
Measurement errors are samples that do not represent the real physical value. However, only having the sensor’s information creates a difficulty for measurement error classification.
What is data quality and meta data?
Data quality
Short: Data that is fit for purpose.
Long: Data are of high quality if they can be used effectively for operations, decision-making, and planning.
Metadata
Short: Data about data.
Long: Structured information that describes or explains how data can be used, found, or managed.
What is the maintenance?
Maintenance is the combination of all technical, administrative and managerial actions during the life cycle of an item intended to retain it in, or restore it to, a state in which it can perform the required function.
Short: Actions to keep or restore an item so it works.
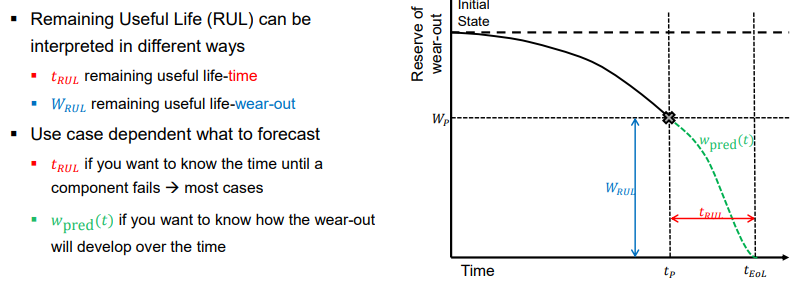
What is remaining useful life-time?
Remaining useful life-time describes the time difference between the forecast start point and the time where the item/component/system is expected to fail.
Short: Time left before failure.
Data Understanding - Purposes
Getting to know the data
What attributes make up the data?
What kind of values does each attribute have?
How are the values distributed?
Useful and inevitable step for data preprocessing and modeling
GIGO: garbage in – garbage out
Attribute Types
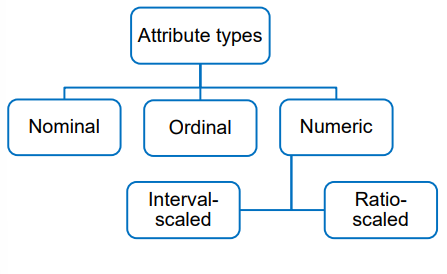
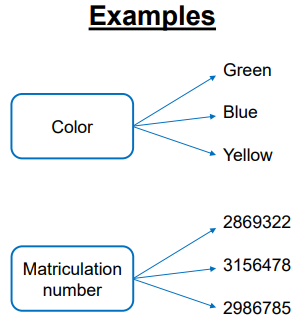
Nominal Attributes
Categorical data
No meaningful order
Not quantitative
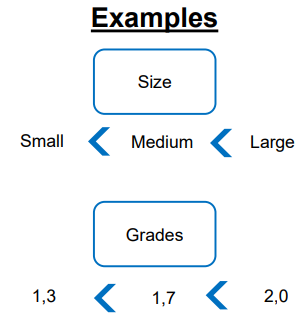
Ordinal Attributes
Values have a meaningful order
Difference between successive values not known
Numeric Attributes
Quantitative values
Values have a meaningful order
Differences between values can be quantified
Values can be discrete or continuous
Interval-scaled attributes:
Arbitrary zero-point
Ratios and multiples not meaningful
Ratio-scaled attributes:
Inherent zero-point
Ratios and multiples can be quantified

Basic statistical descriptions
Central Tendency
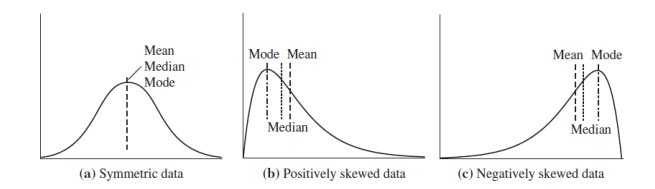
Mean, median and mode are different measures of the center of a data distribution.
Mean: average value
For numeric data
Median: middle value, separates the data into two equal-sized halfs
For numeric and ordinal data
Mode: value that occurs most frequently
For numeric, ordinal and nominal data
Basic statistical descriptions Central Tendency
Which measure should be used?
Mean value is more sensitive to outliers
Median is a better measure for skewed data
Basic statistical descriptions Dispersion of the data
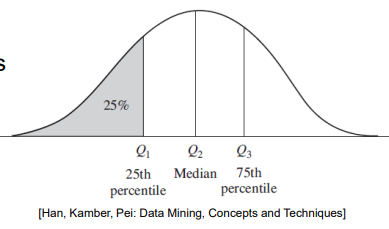
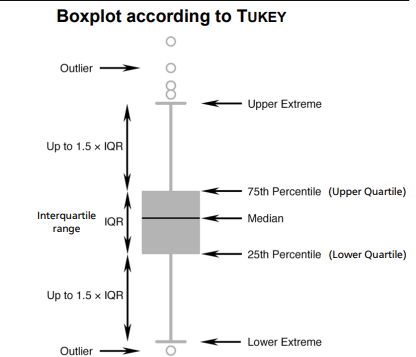
Range, Quantiles
Range = maximum – minimum
Quantiles: split the data into equal-size sets
Quartiles Q1, Q2 (= median) and Q3
Percentiles
Basic Statistical Descriptions Visualization of a Data Distribution
5-point descriptions
Minimum
Lower quartile Q1
Median Q2
Upper quartile Q3
Maximum
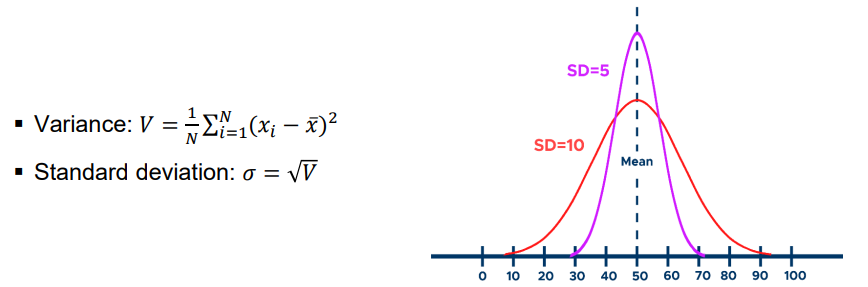
Definition for variance and standard deviation measure how much a data distribution spreads around the aritmetic mean.
Variance and standard deviation measure how much a data distribution spreads around the arithmetic mean.
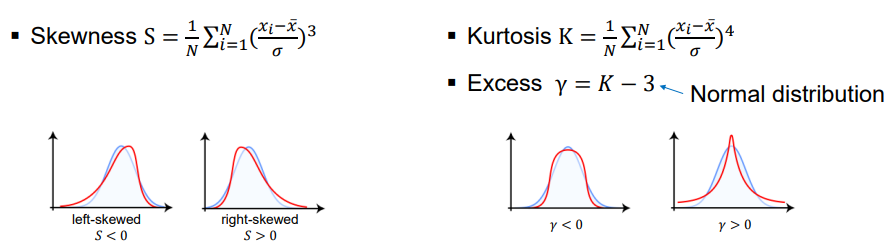
Definition of Skewness and Kurtosis
The skewness is a measure for the asimmetry of a data distribution.
The kurtosis is a measure for the tailedness of a data distribution.
EXPLORATIVE STATISTICS
Correlation, Signal Processing
Cross-correlation and Auto-correlation
Cross correlation is a measure of similarity between a random signal 𝑥(𝑡) and a time-shifted random signal 𝑦(𝑡).
Auto-correlation is a measure of similarity of a random signal 𝑥(𝑡) with its shifted version.
Correlation Statistical Correlation
Pearson correlation coefficient
The Pearson correlation coefficient is a statistical measure of the strength of a linear relationship between paired data.
Correlation
Pearson correlation coefficient
Prerequisites:
Linearity
Attributes must be numeric or binary.
The Spearman rank correlation
The Spearman rank correlation coefficient or Spearman’s rho is a statistical measure of the monotonic relationship between two variables.