RMM 6: Single Sample t-Test
1/16
There's no tags or description
Looks like no tags are added yet.
Name | Mastery | Learn | Test | Matching | Spaced | Call with Kai |
|---|
No study sessions yet.
17 Terms
What is the single sample t-test used for?
Similar as the single sample z-test, but is used when the population standard deviation is not known
Results tell us if the same findings could be expected in the population as a whole
Which is more common: the single sample t-test, or single sample z-test? Why?
Single sample t-test is more common
Need population standard deviation to determine z-scores BUT it is very rare to actually know the population standard deviation → use a t-test & t-distribution instead of a z-test & normal distribution
Because the population standard deviation is not known when performing a single sample t-test, what is used instead, to replace this unknown value?
Use the sample standard deviation as an estimate of the population standard deviation
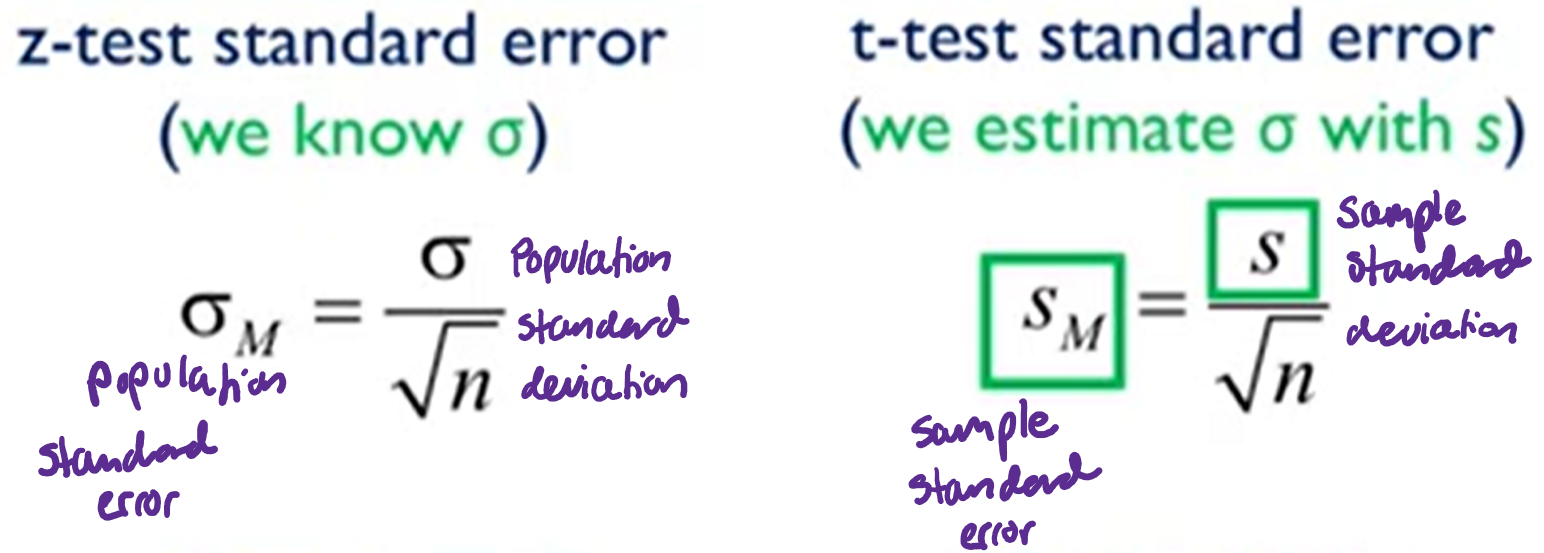
Compare the equations for the determining the standard error between the single sample z-test & single sample t-test
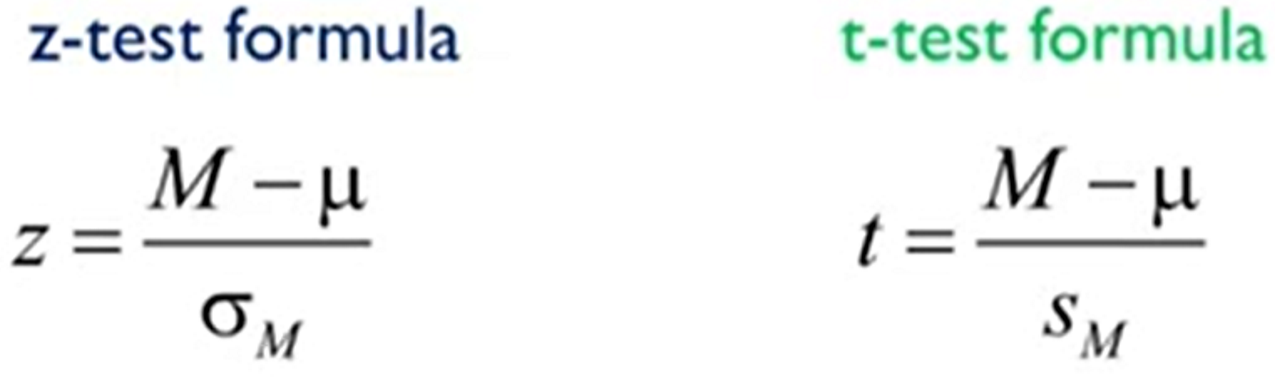
Compare the overall equations between the single sample z-test & single sample t-test
What are some similarities between the single sample t-test & single sample z-test?
Still use NHST
Still assign a valuate that indicated no effect --> assume H0 is true
Still apply a-level = 5% to determine probability of mean occurring --> determined whether H- is rejected or not
What are some differences between the single sample z-test & single sample t-test??
Different standard error (sample vs population)
Critical limit for a-level of 5% in t-distribution is not fixed @ +/- 1.96
t-distribution requires consideration of sample size & degrees of freedom (df) to determine probability of sample mean
Degree of Freedom (n-1): one less than the sample size for a single sample t-test
Critical limit varies along w/ df
When determining the t-statistic, what happens if you need to find critical values but the exact degrees of freedom is not listed?
round down to the next smallest number
E.g. 48 people in sample, degrees of freedom is 48 - 1 = 47 BUT 47 isn't on table --> round down & use critical values for df = 40 (avoids inflating Type 1 error - false positives
What is Coehn’s d & how is it calculated?
Choen's d: indicated the magnitude of the difference
d = (M - μ)/s
(Mean of sample - mean of population)/sample standard deviation
Why will the value for sample means change depending on the people in the sample? What can we do to counter this effect?
all statistics have sampling error; random chance changes the value of the sample mean
Take error into account rather that just relying on the 1-point estimate
What is a confidence interval?
starts with the point estimate & then creates a range of scores considered plausible based on standard deviation, sample size, & the level of confidence with which is desirable to estimate the parameter
What is the margin of error, how is it calculated, & when can it be used?
Margin of error: range of confidence interval that extends equally in both directions
MOE: t* x (s/sqrt(n))
Multiply 2-tailed critical value (t) by sample standard error (sample standard deviation/sqrt(sample size))
What is the 2-tailed t-test critical value based on?
The chosen level of confidence; 1 - α
How are the upper & lower boundaries of the confidence interval determined?
By adding/subtracting the margin of error from the point estimate
CI = M ± margin of error
Sample mean ± (t* x (s/sqrt(n)))
What does the range of a confidence interval represent?
The values of the mean that are considered reasonable or plausible based on the observed data
"We are 95% confident that the range (x, y) brackets the true population mean"
Can confidence intervals only be constructed using the t-statistic? What is another way they could be calculated?
Use z-score criteria if population standard deviation is known
Replace t-statistic (t*) w/ z-value (z*) & sample standard error (sM) w/ population standard error (σM)
How do confidence intervals help us reject or fail to reject the null hypothesis?
Range of CI brackets the null hypothesis value → fail to reject the null hypothesis
Range of CI does not bracket the null hypothesis value → reject the null hypothesis