Exam 2 - Materials Characterization - Part 2 (spectroscopy)
1/76
There's no tags or description
Looks like no tags are added yet.
Name | Mastery | Learn | Test | Matching | Spaced |
|---|
No study sessions yet.
77 Terms
Important parts of a UV-VIS spectrometer
Source, entrance slit, monochromator, exit slit, sample, dispersion device, detector
What do optical spectrophotometers measure?
Optical Density (OD)
Absorbance (A)
Transmittance (T)
What law is UV-VIS based on?
Beer Lambert’s Law
How does UV-Vis work?
Passes UV/VIS light through sample and see how much is absorbed - molecules absorb certain wavelengths of light
Applications for UV-Vis spectroscopy
Measure various concentrations of a material and their absorption
Quantified metal speciation (ppb)
Looking at conjugated systems
Comparing sugars/salts/organics with nucleic acids, proteins (size difference)
First derivative UV-Vis
Shows slope, emphasizes changes
Second derivative UV-Vis
Emohasizes changes more strongly, shows curvature
Which derivative for Uv-Vis gives the best data in terms of peak sharpness
2nd derivative
What region in wavelength is vibrational spectroscopy?
10-4 nm to 10-6 nm
What region in wavenumber is vibrational spectroscopy?
10²-104 cm-1
For stretching vibrations, what is the maximum number of bonds?
1
For bending vibrations (in-plane), what is the maximum number of bonds?
2
For bending vibrations (out of plane), what is the maximum number of bonds?
3
For torsion vibrations, what is the maximum number of bonds?
3
What model determines molecular vibrations by quantum mechanics?
Harmonic Oscillator
Rate the size of energy gaps of each degree of freedom from smallest to largest
Translation, Rotation, Vibration, Electronic
General FTIR schematic
Incident beam split into 2 by beam splitter, interferogram can be interpreted based on its Fourier Component
What kind of molecules are good to look at with FTIR?
Molecules with changing dipole moments
Look at bond changes (such as polymers, liquids, NOT SALTS)
Stokes Scattering
Go from v=0 to virtual state back down to state right above v=0
Rayleigh Scattering
Go from v=0 to virtual state back down to v=0
Ant-stokes scattering
Go from state right above v=0 to virtual state and then down to v=0
What does Raman measure?
Stokes, Anti-Stokes, Rayleigh from E0 to E1
Raman and IR do/do not see the same features
Can see the same but can also not
Raman - polarizability
Molecule must undergo change in polarizability during vibration, meaning that is it easy or difficult to distort electrons from their original positions?
Polarizability of a molecule decreases with:
increasing e- density
increasing bond strength
decreasing bond length
Symmetrical stretching, Raman/IR active? CO2
Raman - Yes
IR - no
Asymmetrical stretching, Raman/IR active? CO2
Raman - no
IR - Yes
Bending, Raman/IR active? CO2
Raman - no
IR - yes
Raman Microscopy Applications in Materials Science
Composition analysis
Strain/stretch of materials will shift their peaks and intensities
Examine materials with microscopy - geological samples
Pros of Using Raman (over FTIR)
Low frequency modes
Easy sampling
Resonance and surface enhancements possible
Water compatible
FTIR Advantages
Good fingerprint libraries abailable
Fundamental vibrations
FTIR and Raman both have _______ linewidths
narrow
Electron spectroscopy general technique
Analytical technique that detects emitted electrons from atoms and solids, can provide chemical and electronic information from surface
Electron spectroscopy is complementary to these two materials characterization methods
XRD
Vibrational Spectroscopy
X-Ray Photoelectron Spectroscopy (XPS) does what?
Measures binding energies of core electrons ejected by X-rays
What can XPS measure
Element ID (Z>3), near-surface composition
Peaks on an XPS occur when
Excitation occurs (energy excited core level)A
Auger lines
Outer shell electron fills inner hole vacancy, energy from that can result in emission of Auger electron
XPS is surface-specific because
inelastic mean free path can differ based on the material, so the sampling depth can change between 1-10 nm
How can XPS perform elemental composition
Wide scan at modest energy and label all peaks
Chemical shifts XPS
Oxidation/bonding modifies local potential
Peak width XPS
Reflects state distribution, inhomogeneity, relaxation effects
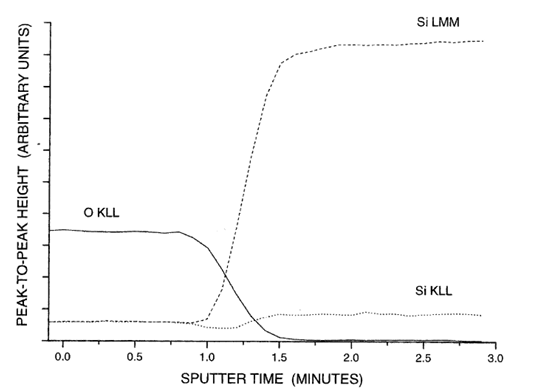
Splutter XPS
Analyze chemical composition of material at different depths
Auger Process
create core hole by electron beam or x ray
upper electron drops to fill hole and transfer energy to another electron
second electron emitted as auger electron
KLL
LMM
MNN
KLL - initial
LMM - final hole
MNN - final hole
Auger Electron Spectroscopy
Surface analytical technique detecting element specific Auger electrons after core-level ionization and non-radiative relaxation
AES used for
extreme surface sensitivity
elemental mapping (Z >= 3)
depth profiling with sputtering
AES does not measure _______ composition well
bulk
KLL
Electron in K shell removed (hole)
Electron in L shell drops to K to fill hole
Energy released from dropping used to eject electron from L shell
LMM
Hole in L shell
M to L drop
Energy to M electron
Direct mode AES
Auger peaks on large secondary-electron background
Derivative mode AES
Peaks become zero crossings, improve visibility/Auger structure
Each element has distinct these three lines AES
KLL
LMM
MNN
Auger yield is _______ at low Z
high
X-ray yield is ________- at high Z
high
AES excellent for _______ elements, Xray good for __________ elements
light;heavy
Depth profiling AES
Sputter thin layer with inert ions, measure Auger windows sequentially
“Fake” Auger peaks
Plasmon loss peaks
Ionization loss peaks
Secondary electrons
Checks
Scanning Auger Microscopy (SAM)
Scan a focused e- beam, at each pixel measure elements Auger intensity (higher intensity = brighter pixel)
Limitations of AES
charging (contamination)
beam damage
topography
sputtering/mixing
interferences
Size of AES samples
Wafers, cut carefully to avoid contamination
PES
Photoemission from solids/molecules
Measures binding energy distribution of occupied states
Photoemission model
optical excitation of electron
transport electron to surface
electron can escape across surface barrier into vacuum —> analyzer
UPS
UV-Photoelectron Spectroscopy
Why is UPS surface-sensitive?
Valence electrons sample first top players, sensitive to overlayers
UPS Method
Apply small negative sample bias to separate cutoff
Electron Energy Loss Spectroscopy
Measures energy lost by fast electrons transmitted through thin specimens
What kind of samples does Electron Energy Loss Spectroscopy work for?
Light elements, bonding
Singal from EELS
Incident electrons undergo inelastic scattering, lose energy, can track and sort electrons by energy on detector
Low-Loss EELS
1-50 eV
Plasmons, interband, bandgap
Core loss EELS
>50 eV, element-specific (KLM)
X-ray Photons
Can penetrate deeper and closer to the nuclei
EDS detector
Specific number of electron-hole pairs generated, dependent on X-ray energy
EDS or WDS have higher StN ratio
WDS
EDS lightest element detected
Oxygen (Z=8)
XRF analysis goal
Understand elemental composition, can find weight fraction and compare against intensity
X-ray absorption spectroscopy source
table top X ray emitter
Synchrotron