CHI-SQUARED TESTS - CH6
1/18
There's no tags or description
Looks like no tags are added yet.
Name | Mastery | Learn | Test | Matching | Spaced |
|---|
No study sessions yet.
19 Terms
what is the null hypothesis in a goodness of fit test
H0: there is no difference between the observed and the theoretical distribution
what is the alternate hypothesis in a goodness of fit test
H1: there is a difference between the observed and the theoretical distribution
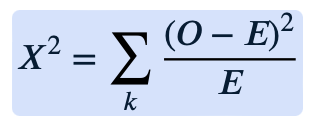
measure of goodness of fit formula:
where Oi = observed value
Ei = expected value
what does a lager goodness of fit mean?
the less similar the distributions are
number of degrees of freedom =
number of columns - number of constraints (e.g always take a way one, but also when estimating parameters)
what must you make sure of when looking at expected values
if an expected value is less than 5, you must combine it with another cell in the table until they’re greater than 5
to find critical values…
use the test statistic and the degrees of freedom and then go to the tables
if the X² from the tables is less than you’re calculated value…
reject H0
if discrete random variable X is defined over k values, p=
1/k
for testing the goodness of fit of a binomial distribution, what’s the first step?
find the probability of each value of x by just subbing into calculator, i.e. P(X=0), P(X=1)…
then calculate expected frequencies for each
hypotheses for a goodness of fit test for a distribution
H0: binomial, poisson etc is suitable model
H1: it isn’t
how to calulate p for a binomial test if it isn’t given
p = Σ r•f / Nn
where:
Σ r•f = the sum of multiplying the columns in the table up, i.e a score of 6 ( r ) occurred 4 times (f)
N = the number of observations, or total frequency
n = the number of trials, or maximum value of r
how to approximate λ for a Poisson goodness of fit calculation
|
what are contingency tables
a scenario in which there are multiple events, i.e. what grade a student got and whether they’re a boy or a girl
hypotheses for a contingency table test
H0: event 1 and event 2 are independent
H1: event 1 and event 2 are not independent
expected frequency for a contingency table
row total • column total / grand total
degrees of freedom for a contingency table
(number of columns -1)(number of rows -1)
approximate p for a geometric distribution goodness of fit test
N / Σr•f
where N is the total number of successes
expected frequency for geometric
p•(1-p)^n multiplied by the total frequency