Econ 2105 practice Midterm 1
1/24
There's no tags or description
Looks like no tags are added yet.
Name | Mastery | Learn | Test | Matching | Spaced | Call with Kai |
|---|
No analytics yet
Send a link to your students to track their progress
25 Terms
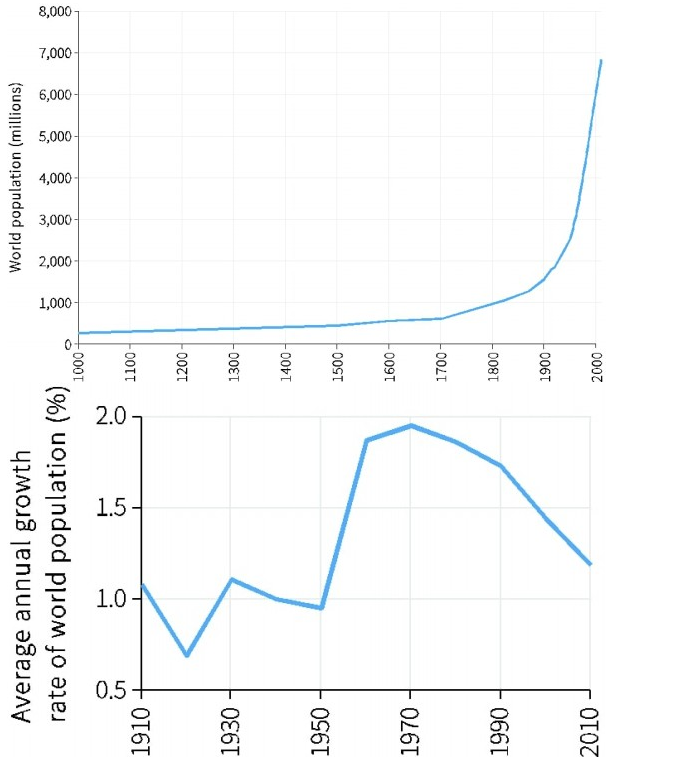
The following graphs show the world population in millions from 1000 to 2010 and the world population growth rate in the 20th century. Based on this information, which of the following statements is correct?
The world population did not grow much from 1000-1700, after which the growth rate increased sharply.
The world population continues to grow at an increasing rate.
The graphs suggest that the world population will start shrinking in near-term.
There has been a 600% increase in the world population over the past 200 years.
There has been a 600% increase in the world population over the past 200 years.
Which of the following are classified as firms?
Companies employing unpaid student interns as well as paid workers.
Nationalised railways.
Non-profit organisations.
Employee-owned cooperatives.
Companies employing unpaid student interns as well as paid workers.
Which of the following statements regarding democracy as a political system is always true?
The head of the state is elected directly by voters.
Virtually all adults are eligible to vote in an election.
Necessary for a capitalist economic system to succeed.
Individuals cannot influence elections or public policy through their financial contributions.
Virtually all adults are eligible to vote in an election.
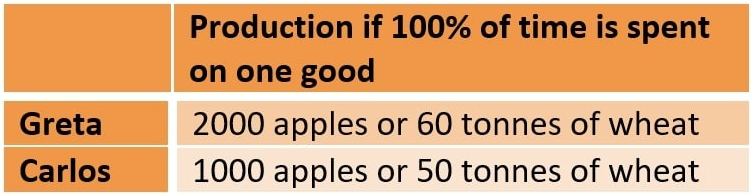
Consider a world of just two individuals, Greta and Carlos, who each need both of two goods, apples and wheat, to survive. They differ in how productive they are in growing apples and wheat. Based on this information, which of the following statements is correct?
Greta has an absolute disadvantage in both crops.
Greta has a comparative advantage in both crops.
Greta has a comparative advantage in producing wheat.
Carlos has a comparative disadvantage in producing apples.
Carlos has a comparative disadvantage in producing apples.
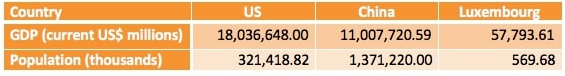
The following table shows the nominal GDP (in current millions of US dollars) and the population (in thousands) of the US, China, and Luxemburg in 2015 (source: The World Bank). Based on this information which of the following statements is correct?
China's GDP per capita was $8,027,684.
Luxembourg's GDP per capita was 12.6 times that of China's.
The US had the highest GDP per capita of the three countries.
The US's GDP per capita was 81% less than Luxembourg's.
Luxembourg's GDP per capita was 12.6 times that of China's.
Which of the following statements regarding Malthusianism are correct?
Malthus held that a sustained increase in income per capita would be impossible.
According to Malthusianism, the rise in productivity of labour would be offset by population growth.
The predictions of Malthus were correct throughout 19th century Britain.
Malthusianism provided an explanation of why income would stay constant over centuries without trending upwards.
Malthus held that a sustained increase in income per capita would be impossible.
According to Malthusianism, the rise in productivity of labour would be offset by population growth.

The following table describes the production function of cloth. Based on this information, which of the following statements is correct?
The production function exhibits diminishing average product of labour at all levels of labour input.
The average product of labour when the number of workers is 400 is 10 metres.
When 300 workers are employed, the first 200 workers produce 12.5m each while the next 100 workers produce 11m each.
As the number of workers is increased from 100 to 500, the average product of labour falls by 20%.
As the number of workers is increased from 100 to 500, the average product of labour falls by 20%.
Which of the following statements regarding the Malthusian model are correct when there is a positive one-off technological shock (such as an improved seed)?
There is an immediate and permanent rise in the average product of labour.
The population initially rises but then falls to the pre-technological shock level.
Income initially rises but then falls to the subsistence level in equilibrium.
Malthus' Law states that an increase in productivity will result in both increased population and wages in the long run.
Income initially rises but then falls to the subsistence level in equilibrium.
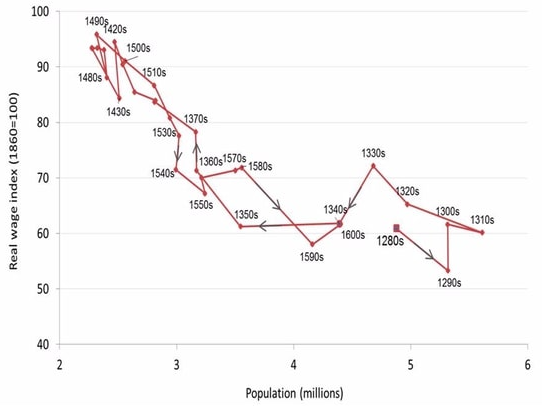
The following diagram plots the path of the UK's real wage index against its population over the years 1280- 1600. Based on this information, which of the following statements are correct?
The graph shows a negative correlation between the real wage index and the UK population.
The UK population consistently shrunk during the 14th century.
The graph shows that the population rises when the real wage is low, and the population falls when the real wage is high.
The graph is consistent with the Malthusian trap story that high real wages encourage population growth, while a larger population forces real wages to fall back to subsistence level.
The graph shows a negative correlation between the real wage index and the UK population.
The UK population consistently shrunk during the 14th century.
The graph is consistent with the Malthusian trap story that high real wages encourage population growth, while a larger population forces real wages to fall back to subsistence level.
Which of the following statements is correct?
A model is an exact representation of what goes on in the economy.
A model is an economic relationship that is only represented by mathematics.
Equilibrium is a self-perpetuating situation that does not change, unless a force for change is introduced from the outside and alters the basic data describing the situation.
Equilibrium in GDP growth rate is when the growth rate is zero.
Equilibrium is a self-perpetuating situation that does not change, unless a force for change is introduced from the outside and alters the basic data describing the situation.
Which of the following statements is correct?
You are investigating the effect of a rise in oil price on commuters' use of bicycles. Ceteris paribus means that you keep the number of commutes by car constant.
If you are paid a fixed salary independent of your output, then you may be tempted to put in less effort. This is an example of an economic incentive.
You are thirsty and are choosing between two drinks to buy. Given that both drinks are affordable to you, the main factor that affects your choice is the absolute price of each drink.
You are currently unemployed but are being interviewed for a job. Your reservation position is your position in the interview queue.
If you are paid a fixed salary independent of your output, then you may be tempted to put in less effort. This is an example of an economic incentive.
Production of cloth requires two inputs: L workers and R tonnes of coal. The isocosts are given by the equation: c = wL + pR for different total costs c, where w is the wage rate and p is the price of coal. If w = 10, p = $20 and the cost associated with a particular isocost is c = $40, which of the following statements are correct? (Assume that the number of workers is on the horizontal (x) axis and the tonnes of coal is on the vertical (y) axis).
The intercept of the isocost on the y-axis is 2.
The intercept of the isocost on the x-axis is 3.
The slope of the isocost is 1/2.
The isocost goes through the point (L, R) = (2, 1).
The intercept of the isocost on the y-axis is 2.
The isocost goes through the point (L, R) = (2, 1).
Consider indifference curves for consumption of milk and chocolates (you may assume that both are 'goods'.) The indifference curves are drawn with number of chocolate bars on the horizontal axis and pints of milk on the vertical axis. Consumer A has a much stronger preference for chocolates relative to milk than consumer B. Compared to B's indifference curves, A's indifference curves are:
Higher.
Flatter.
Steeper.
More convex.
Steeper.
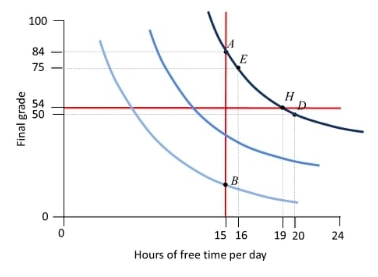
The diagram shows a student's indifference curves for hours of free time per day and final grade. Based on this graph, which of the following statements is correct?
The marginal rate of substitution at H is 0.25.
The marginal rate of substitution is higher at D than at A.
For a given final grade, the student's marginal rate of substitution between free time and final grade is the same on all three indifference curves.
The marginal rate of substitution at B is smaller than 9.
The marginal rate of substitution at B is smaller than 9.
You have two choices for how you are going to spend Saturday evening. You can go to the pub with your friends, which will cost you GBP 30 for the evening. The pleasure you anticipate from this experience is worth GBP 50 to you. Or, you can go to the theatre. The ticket will cost you GBP 50, but you value the experience at GBP 60. Based on this information, which of the following statements is correct?
The opportunity cost of an evening at the pub is GBP 60.
The economic cost of going to the pub is GBP 40.
The economic rent of going to the pub is GBP 0.
Based on economic rent alone, you would definitely choose to go to the theatre.
The economic cost of going to the pub is GBP 40.
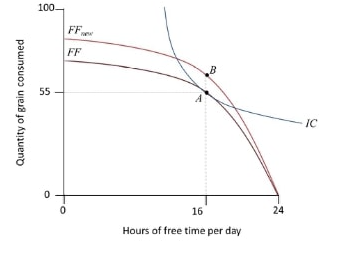
The following diagram shows a farmer's choice between free time and grain before (A) and after (B) an improvement in technology. Based on this information, which of the following statements are correct?
The MRT of the new feasible frontier at B is larger than the MRT of the old feasible frontier at A. This gives the farmer an incentive to take more free time after the technology improvement.
If the MRS of the indifference curve at B is larger than the MRS of the indifference curve at A, then this gives the farmer an incentive to take more free time after the technology improvement.
The farmer will definitely choose a point to the right of B after the technology improvement.
The farmer may choose a point on either side of B after the technology improvement.
If the MRS of the indifference curve at B is larger than the MRS of the indifference curve at A, then this gives the farmer an incentive to take more free time after the technology improvement.
The farmer may choose a point on either side of B after the technology improvement.
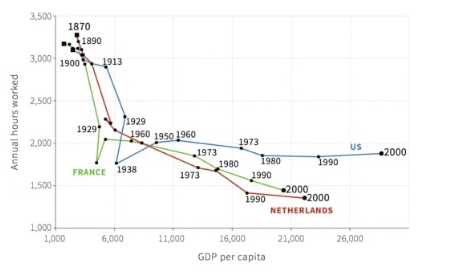
The figure depicts the annual number of hours worked against GDP per capita in the US, France, and the Netherlands between 1870 and 2000. Which of the following is true?
The graph proves that workers in the US produce higher outputs than their counterparts in France or the Netherlands because they work longer hours.
US workers have always worked longer hours than French or Dutch workers have.
The Great Depression in 1929 had the effect of reducing both hours worked and output in both the US and France.
As GDP per capita increases, the number of hours worked continues to fall in all countries shown.
The Great Depression in 1929 had the effect of reducing both hours worked and output in both the US and France.
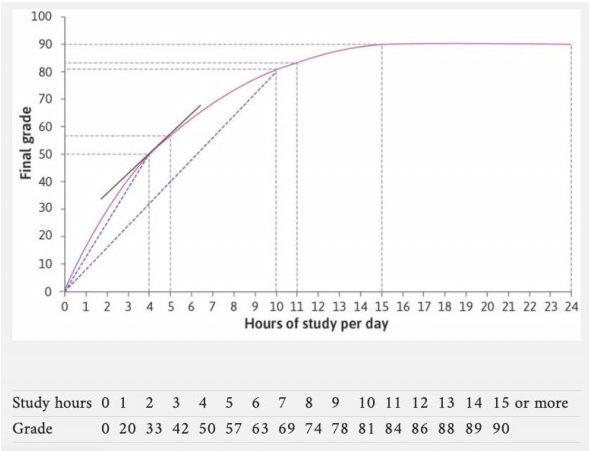
The figure shows a student's production function with the final grade (the output) related to the number of hours spent studying (the input). Which of the following statements regarding marginal product of labour (MPL) are correct?
The MPL is decreasing beyond 15 hours of study.
The MPL at 4 hours is 12.5.
The MPL is the slope of the tangent line.
Beyond the first hour, the MPL is strictly less than the average product of labour.
The MPL is the slope of the tangent line.
Beyond the first hour, the MPL is strictly less than the average product of labour.
Currently, you work for 40 hours per week for a wage of GBP 20 an hour. Your free hours are defined as the number of hours per week not spent working, which in this case is (24 hours x 7 days) - 40 hours = 128 hours per week. Suppose now that your wage rate has increased by 25%. If you are happy to keep your total weekly income constant, then:
Your total number of working hours per week will fall by 25%.
Your total number of working hours per week will be 30 hours.
Your total number of free hours per week will increase by 25%.
Your total number of free hours per week will increase by 6.25%.
Your total number of free hours per week will increase by 6.25%.
Consider an individual's indifference curves for the consumption of two goods (things you would like to have more of). In this case, which of the following statements are true?
The indifference curves are downward-sloping.
The indifference curves can sometimes cross.
The indifference curves cannot have sections that are straight lines.
The indifference curves cannot have kinks.
The indifference curves are downward-sloping.
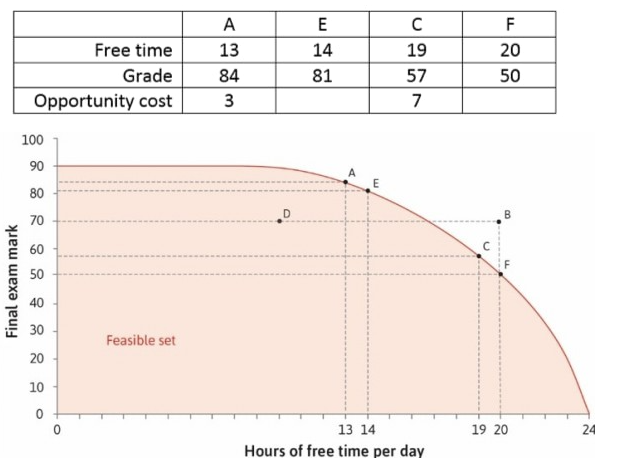
The following diagram is the feasible set of a student, showing the combinations of her final grade and the hours of free time per day. Based on this information, we can say that:
Points A and C are on the same feasible frontier, while at B she can get a higher grade for the same hours of free time compared to C. Therefore the student will choose B.
At D, the student is able to attain a higher grade but has less free time compared to C. Whether she would choose C or D then depends on her preferences.
The marginal rate of transformation at A is 3, meaning that the student can 'transform' one hour of free time into 3 extra points on her grade.
At C, the student can study an extra hour and attain the grade of 50 for 20 hours of free time. Therefore for one extra hour of studying, she can increase her grade by 2.5 points.
The marginal rate of transformation at A is 3, meaning that the student can 'transform' one hour of free time into 3 extra points on her grade.
After finishing university, Rani has three choices, listed in order of preference: (1) study for a MSc at UCL, (2) work at Barclays, or (3) take a gap year. Her opportunity cost of studying at UCL includes which of the following:
The income she would have earned on her gap year.
The cost of a gap year.
The income she would have earned at Barclays.
The income she would have earned at Barclays.
Which of the following characterise capitalism as an economic system?
Many forms of production are organized by and take place in firms.
Production is undertaken for the purposes of making a profit.
Owners do not manage their firms; this is done by managers.
Many forms of production are organized by and take place in firms.
Production is undertaken for the purposes of making a profit.
The country of Eden produces just two goods, apples and snake-skin handbags. In 2014 the prices of apples and handbags were 10 and 24, respectively. In 2015, the prices increased to 12 and 25. The quantities produced of the two goods were unchanged in both 2014 and 2015, at 100 and 20. From this information, we can conclude that:
The nominal GDP in 2014 is 1,480.
The real GDP is unchanged between 2014 and 2015.
The nominal GDP growth rate between 2014 and 2015 is 14.9%.
The nominal GDP in 2014 is 1,480.
The real GDP is unchanged between 2014 and 2015.
The nominal GDP growth rate between 2014 and 2015 is 14.9%.
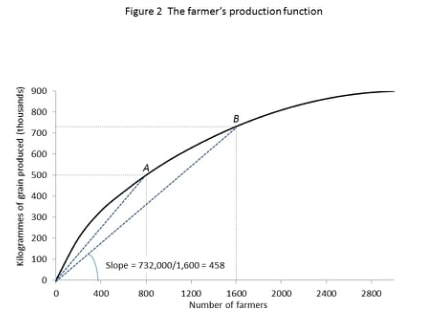
The following diagram depicts the production function of the farmers, where diminishing average product of labour is assumed. If you know that that for 2,800 farmers, the grain output is 894,000 kilos, then.
The average product of labour when the labour input is 2,800 is 300.
The decreasing slopes of the rays from the origin to the production function along the curve indicate the decreasing average product of labour.
If the production function curve is an upward-sloping straight line, then there is no diminishing average product of labour.
The decreasing slopes of the rays from the origin to the production function along the curve indicate the decreasing average product of labour.
If the production function curve is an upward-sloping straight line, then there is no diminishing average product of labour.