Unit 1: Basic Economic Concepts
1/68
There's no tags or description
Looks like no tags are added yet.
Name | Mastery | Learn | Test | Matching | Spaced | Call with Kai |
|---|
No analytics yet
Send a link to your students to track their progress
69 Terms
Equilibrium
When supply = demand, there is equilibrium in the market
Equilibrium creates a single price and quantity for a good/service for that market
Requirements for a supply & demand graph
Label ACES
Axis
Curves
Equilibrium
Shifts
Changes in Equilibrium
When supply or demand changes, the equilibrium price & quantity change
Increase in Demand graph
D →
P increase
Q increase
Decrease in Demand graph
D ←
P decrease
Q decrease
Increase in Supply graph
S →
P decrease
Q increase
Decrease in Supply graph
S ←
P increase
Q decrease
Simultaneous Increase in Supply and Demand
P ? indeterminate
Q increase
Simultaneous Decrease in Supply and Demand
P ? indeterminate
Q decrease
Simultaneous Supply decrease & Demand increase
P increase
Q ? indeterminate
Simultaneous Supply increase & Demand decrease
P decrease
Q ? indeterminate
Market Disequilibrium
Surplus (Price Floor)
Shortage (Price Ceiling)
Surplus
Price is TOO high, so consumers’ demand is lower than supply
Shortage
Price is TOO low, so consumers’ demand is higher than supply
Price Floor
Minimum price for a good/service determined outside of the market (typically by govt.)
ex. minimum wage
raises the bar
Price Ceiling
Maximum price for a good/service or resource determined outside of the market
like a lid
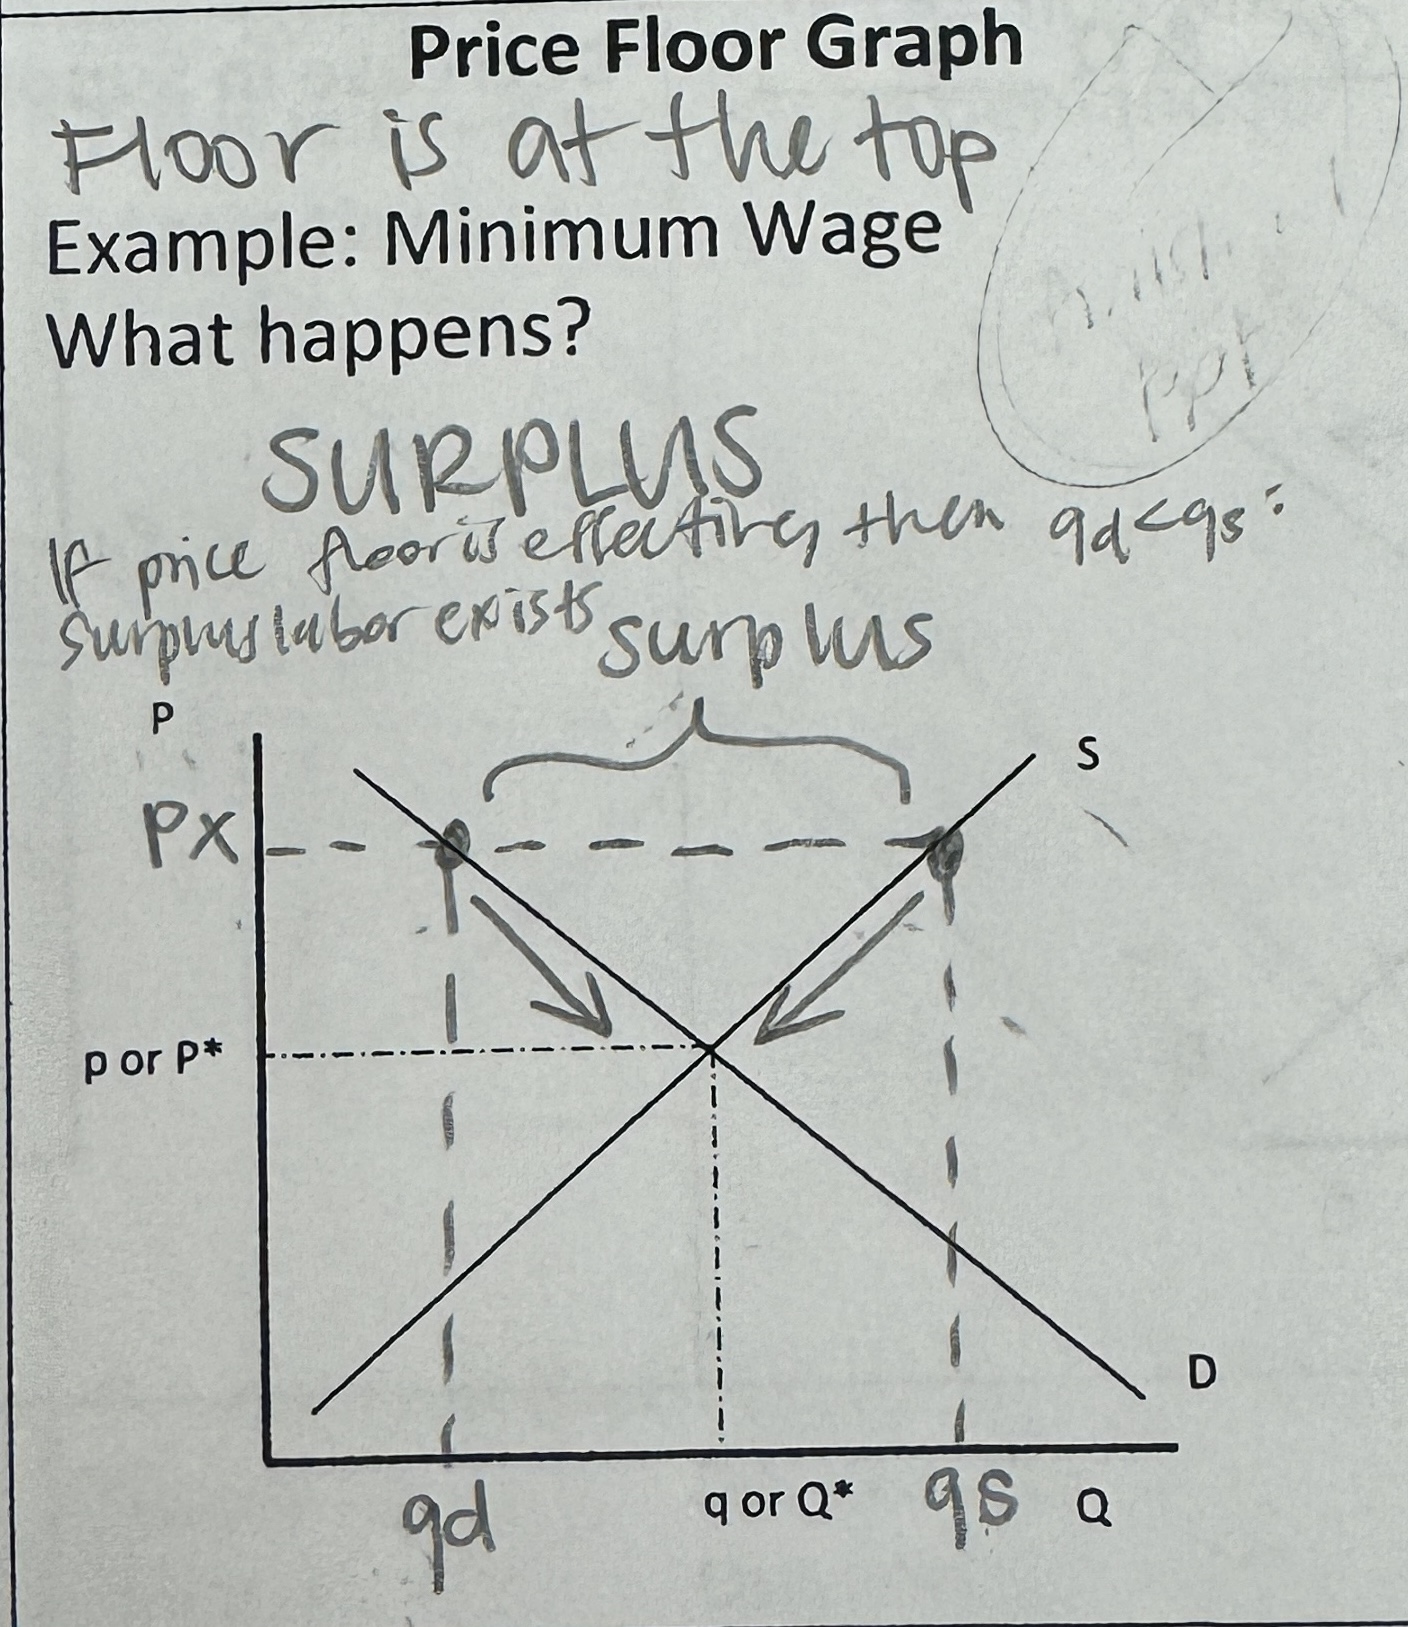
Price Floor Graph
=SURPLUS of goods/services
(Price, px, below Equilibrium price, pe)
Floor is at the top
ex. Minimum Wage - meant to increase standard of living but creates a labor surplus because companies can’t have as many employees
if price floor is effective, then qd < qs : surplus labor exists
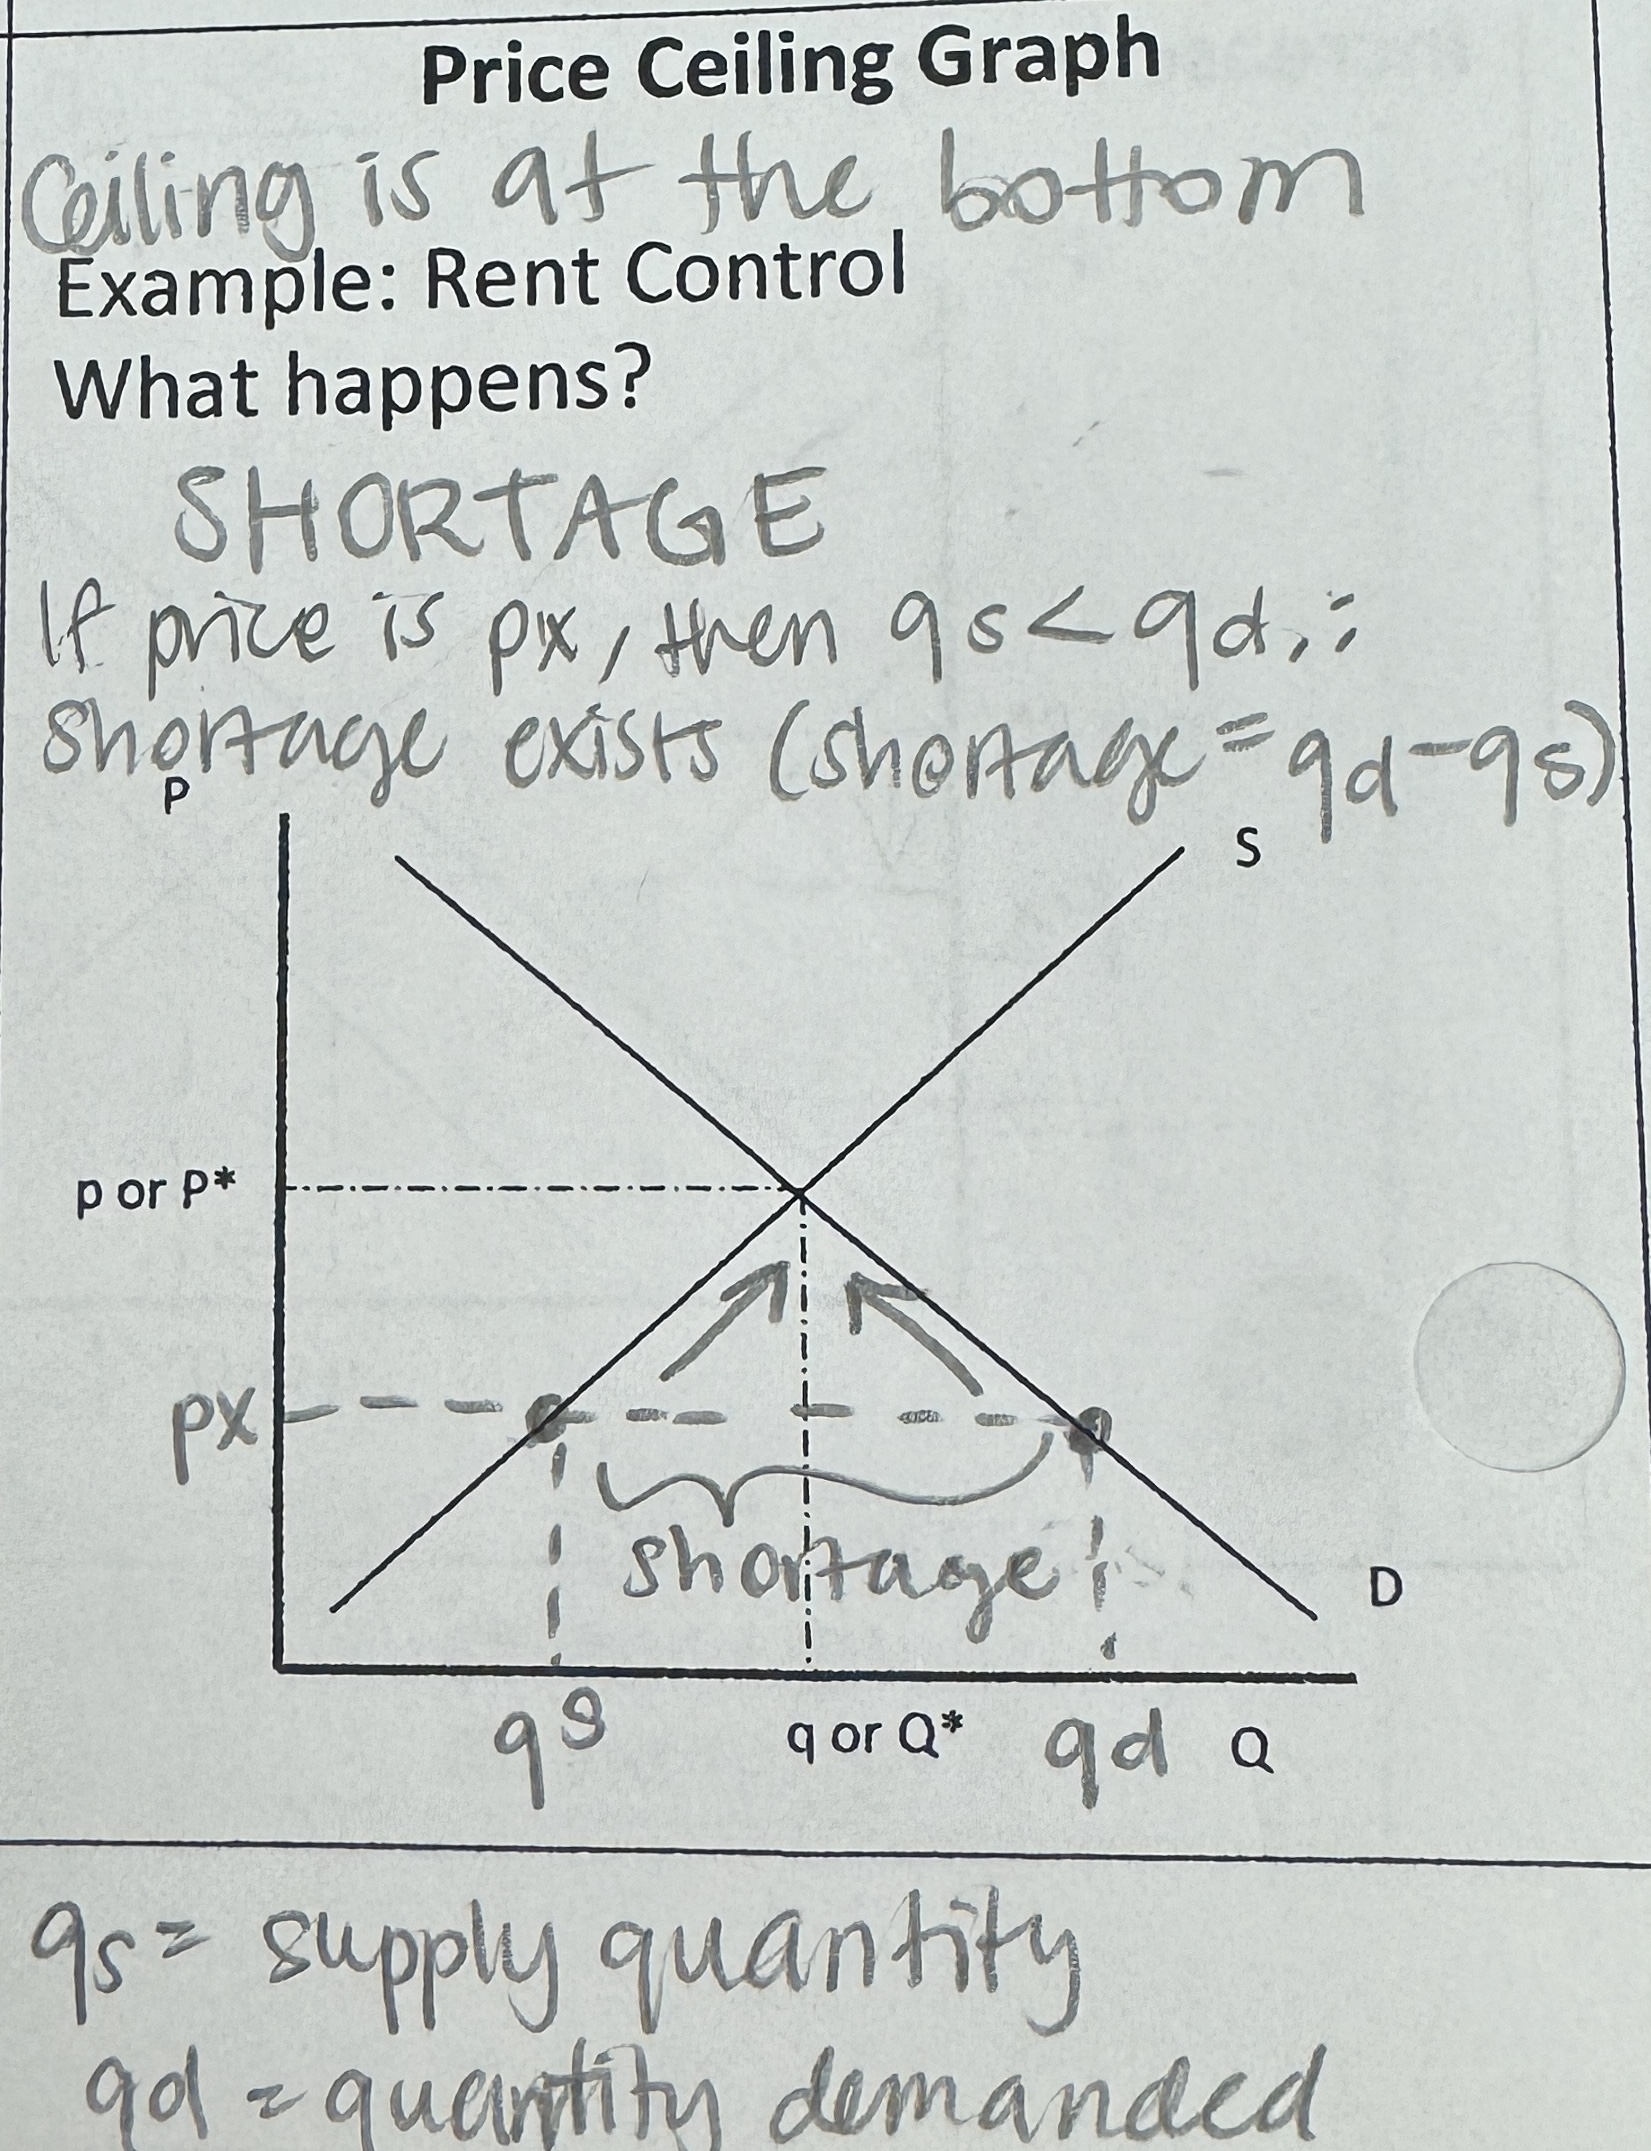
Price Ceiling Graph
= SHORTAGE of goods/services
(Price, px, below Equilibrium price, pe)
Ceiling is at the bottom
Ex. Rent control
if price is px, then qs < qd : shortage exists (shortage = qd - qs)
Market
a group of buyers and sellers of a particular product
Competitive Market
a market with many buyers and sellers, each having a negligible impact on price
Perfectly Competitive Market
All goods are exactly the same (quality)
Large number of buyers and sellers so that no one (individual) can affect market price
Demand
Consumers’ willingness and ability to buy an item at a given price
“How much we want something” - it is important to understand that this does not refer to an numerical amount but instead to a behavior
Law of Demand
The price of an item determines the quantity demanded
Therefore, the price of a good/service is inversely related with the quantity demanded
Lower price = more quantity demanded
Higher price = less quantity demanded
**Changing the price of a good does NOT change demand for that good, it merely changes the quantity demanded (movement along the curve)
Changes in Demand (Shifts of Demand Curve)
Increase in Demand = More quantity demanded at all prices = Demand Curve shifts →
Decrease in Demand = Less quantity demanded at all prices = Demand Curve shifts ←
Determinants of Demand
TRIPE
Tastes & Preferences
Related Goods
complements
substitutes
Income of Consumers
Population
Expectations of Future Price Changes
Tastes & Preferences
Preferences and tastes are affected by advertising, trends, health considerations, etc.
Related Goods
Complements - goods/services used with another
Substitutes - goods/services used instead of other goods/services
Income of Consumers
Increased income = more demand for normal goods
Decreased income = less demand for normal goods
Demand for inferior goods increases as income decreases
knock-offs, cheap fast food, ramen noodles
Population
More population = more demand
Expectations of Future Price Changes
If consumers expect prices to rise in the future, then demand increases now and vice versa.
Supply
producers’ willingness and ability to sell (supply) a good/service
Just like demand, supply is not an amount but a behavior
Specifically, “supply” is not the supply of something, but the willingness and ability to sell (their desire to sell)
Law of Supply
The price of an item determines the quantity supplied
The lower the price the lower the quantity supplied and vice versa
Therefore, the price of a good/service is directly related with the quantity supplied
**Changing the price of a good changesthe quantity supplied of that good, not supply.
Changes in Supply
Increase in Supply = More quantity supplied at all prices = Supply curve shifts →
Decrease in Supply = Less quantity supplied at all prices = Supply curve shifts ←
Determinants of Supply
ACEJIP
Alternative goods in supply
Competition
Expectations
Joint-Supply on market
Input Costs
Phenomenon
Alternative goods in supply
goods that a supplier can make that require similar resources
resources are limited so suppliers have to pick what to make & transfer resources b/w goods they make
Competition
Number of producers in the market
Fewer producers = less supply
More producers = more supply
(like population in TRIPE)
Expectations
If producers expect prices to rise in the future, then they supply less now so that they can sell their good/service at the future higher price.
Joint-Supply on Market
Products that yield multiple outputs (products)
ex. cows (leather, milk, beef) - if there are more cows, then supply of any products made by cows increase
Input Costs
The more expensive it is to make a product, the less of the product that can be made. A change to any of the following would impact the cost of production:
Raw materials, technology, productivity (efficiency gain/losses), Government policies (taxes, regulations)
(very common scenario)
Phenomenon
Certain events can cause a sharp decline in supply such as: natural disasters, weather, wars, riots, strikes
(natural or man-made)
Absolute Advantage
Exists when a person/nation can produce more of a certain good/service than someone else in the same amount of time
Who can produce more?
Comparative Advantage
Exists when a person/nation can produce a good/service at a lower opportunity cost than someone else in the same amount of time/resources
Who has the LOWER opportunity cost?
= more efficient
Input problems
an INPUT problem presents the data as amount of resources needed to produce a fixed amount of output.
ex. # of labor hours to produce 1 pen
When identifying abs. adv., input problems want who can produce using the least amount of resources
IOU - Input: Other goes Under
Output problems
an OUTPUT problem presents the data as products produced given a set of resources.
ex. Number of pens produced
OOO - Output: Other goes Over
Specialization
A country focuses on producing 1 good to gain greater efficiency
ex. USA producing ONLY Wheat
Countries can be made better off if they will produce goods they have a comparative advantage in and then trade with others for whatever else they want/need
Countries should trade if they have a relatively LOWER opportunity cost
They should specialize in the good that is “CHEAPER” for them to produce (costs less labor/resources)
Terms of Trade
Fair Trade Agreement - agreed upon condition that would benefit both countries
will need to answer if both countries benefit on quizzes/tests
Production Possibilities Curve (or Frontier)
(PPC/PPF)
graph showing combinations of the amount of 2 goods/services that an economy can produce by transferring resources from 1 good to the other
Constant Opportunity Costs
resources are easily adaptable for producing either good
Straight line on PPC
Increasing Opportunity Cost
As you produce more of any good, the opportunity cost will increase
resources are not easily adaptable to producing both goods
result is a bowed out (concave) PPC
Productive Efficiency
Products are being produced in the most effective way
This is any point on the PPC
Allocative Efficiency
products being produced are the ones most desired by society
this optimal point on the PPC depends on desires of society
Per Unit Opportunity Cost (formula)
Per Unit Opportunity Cost = (Opportunity Cost)/(Unit Gained)
4 Shifters of the PPC
QQTT
Change in resource quantity
Change in resource quality
Change in technology
Change in trade
Economics
The science of scarcity
Scarcity
we have unlimited wants but limited resources → must make choices
TINSTAAFL
“there is no such thing as a free lunch”
economic concept that states nothing is truly without a cost
Goods
physical objects that satisfy needs & wants
Consumer Goods - physical objects that satisfy needs & wants
Capital Goods - purchased by businesses to produce their products
used over and over again
Services
actions or activities that one person performs for another
Rational choice
marginal benefit ≥ marginal costM
Marginal Cost
the cost of a one-unit increase in an activity
what you give up in return for something
money, time, etc.
Marginal Benefit
the gain of a one-unit increase in an activity
what you get in return for something
money, time, etc.
As you consume more of a product, the marginal benefit for it _______ with each instance of consumption.
decreases
Trade-off
ALL the alternatives that we give up when we make a choice
Opportunity Cost
the ONE most desirable alternative (or trade off) given up when you make a choice
like your second best option
Four Factors of Production
Land, labor, capital, entrepreneurship
Land
All natural resources that are used to produce goods and services
ex. water, sun, plants, animals
Not just land, but anything that comes from the land
Income is rent
Labor
any effort a person devotes to a task for which that person is paid
ex. lawyers, doctors, teachers, waiters, etc.
Income is wages and is the largest source of income for most people.
Capital
an asset that can improve productivity
2 Types
Physical capital - any human-made resource that is used to create other goods and services (tools, tractors, machinery, buildings, factories, etc)
Human capital - any skills or knowledge gained by a worker through education and experience
Income is interest
Entrepreneurship
the ability to innovate and discover new ways of utilizing resources
ex. Henry Ford, Bill Gates, inventors, store owners, etc.
take the initiative
innovate
act as the risk bearers
so they can PROFIT!
Profit = Revenue - Costs
Income is profit