Research Methodology
1/53
There's no tags or description
Looks like no tags are added yet.
Name | Mastery | Learn | Test | Matching | Spaced |
|---|
No study sessions yet.
54 Terms
Reasons given for not participating in research included:
Fear of infectious diseases (71.3%); Pain (62.1%)
Sex and education level were significantly associated with patients’ perceptions for several of items.
Population:
entire group of people having similar characteristics
can be large or small
ex. all patients treated at IUFW; all dental hygienists in the country
Sampling:
a part of subset of the population
can be large or small
large is useful for observational studies
small is used for pilot studies
Types of Sampling: Probability
Involves random selection, allowing strong statistical conclusions about the whole group
Every member of the population has equal chance of being selected
To produce results that are representative of the whole population, probability sampling techniques are the most valid choice.
Types of Sampling: Non-Probability
Involves non-random selection based on convenience or other criteria
easier and cheaper to access, but it has a higher risk of sampling bias
often used in exploratory and qualitative research
Power Analysis:
determines the number of participants needed to detect a meaningful result. Having too few or too many participants can affect the study’s statistical significance
A power analysis uses four main pieces of information that are connected — if you know three, you can calculate the fourth:
Power Analysis: Effect Size
how big of a difference or relationship you expect to find. Researchers often use Cohen’s standard benchmarks for estimating a starting point: Small effect: 0.2; Medium effect: 0.5; Large effect: 0.8
Power Analysis: Significance Level (a)
the cutoff for saying something is statistically significant (usually 0.05).
Power Analysis: Power (1-B)
the probability of detecting a real effect if it exists (often set at 0.80 or 80%).
Power Analysis: Sample Size (n)
how many people or data points you’ll include.
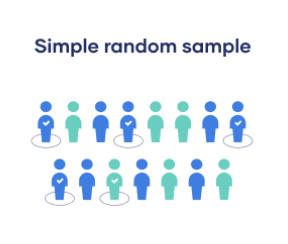
Probability: Simple Random
Every member of the population has an equal chance of being selected.
The sampling frame should include the whole population
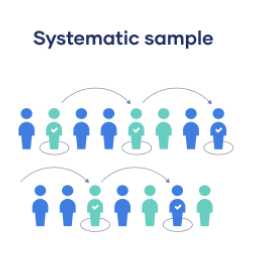
Probability: Systematic
Like random, BUT slightly easier to conduct
Every member of the population is listed with a number, but instead of randomly generating number, individuals are chosen at regular intervals
It is important to make sure that there is no hidden pattern in the list that might skew the sample
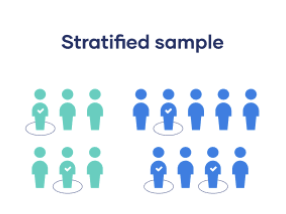
Probability: Stratified
Involves dividing the population into subpopulations that may differ in important ways.
Then, calculate how many people should be sampled from each subgroup.
Use random or systematic sampling to select a sample from each subgroup.
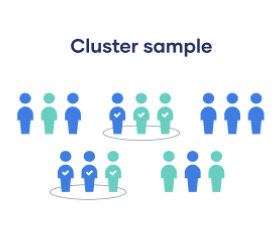
Probability: Cluster Sample
Divide the population into subgroups, BUT each group should have similar characteristics to the whole sample.
Instead of sampling individuals from each subgroup, randomly select entire subgroups
If the clusters themselves are large, you can also sample individuals from within each cluster using one of the techniques above. This is called multistage sampling.
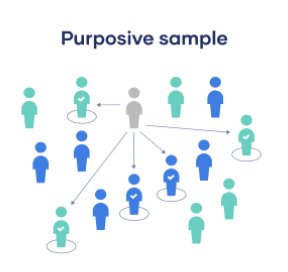
Non-Probability: Purposive
Involves the researcher using their expertise to select a sample that is most useful to the purposes of the research
Often used in qualitative research, where the researcher wants to gain detailed knowledge about a specific phenomenon rather than make statistical conclusion, or where the population is very small and specific.
Must have clear criteria and rationale for inclusion.
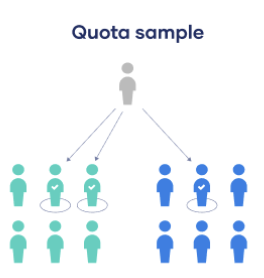
Non-Probability: Quota
Take a very tailored sample that’s in proportion to some characteristic or trait of a population

Non-Probability: Snowball
If the population is hard to access.
Used to recruit participants via other participants.
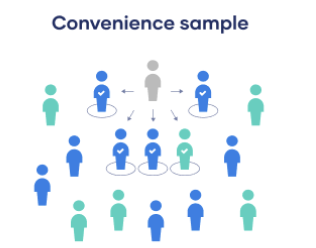
Non-Probability: Convenience
Includes individuals who happen to be most accessible to the researcher
Easy and inexpensive way to gather initial data, but there is no way to tell if the sample is representative of the population, so it can’t produce generalizable results.
Non-Probability: Voluntary
Like convenience sampling (based on ease of access).
People volunteer themselves (e.g. by responding to a public online survey)
Voluntary response samples are always at least somewhat biased, as some people will inherently be more likely to volunteer than others.
Study Groups: Experimental
Sample group in a study that is exposed to or received the experimental intervention
Study Groups: Control
Sample group in a study that does not receive the intervention or receives a placebo
Blinding: Single-Blind Study
the examiners are unaware of the group assignment
Blinding: Double-Blind Study
the study participants, as well as the researchers and examiners who interact with the study participants, are unaware of group assignment.
Length of Study:
Depends on the variables being studied and the type of study.
Must be long enough to allow detection of new disease and extension of current disease
General recommendations are 2 to 3 years for caries studies, 8 to 21 days for plaque-inhibiting studies, 90 days for supragingival calculus-inhibition studies, longer for subgingival calculus-prevention studies, and 6 months for gingivitis reduction studies
Bias in Research:
Bias exists in all research, across research designs, and is difficult to eliminate.
Bias can occur at any stage of the research process.
Bias impacts the validity and reliability of your findings, leading to misinterpretation of data.
Types: measurement bias, interviewer bias, publication bias, researcher bias, response bias, selection bias, cognitive bias
Validity:
The extent to which a study accurately and truthfully measures what it intends to measure.
Internal Validity:
examines whether the study design, conduct, and analysis answer the research questions without bias. In other words, the independent variable, not some confounding variable, caused change in dependent variable
External Validity:
examines whether the study findings can be generalized to other contexts. How well did the sample represent the population?
Reliability:
The consistency and stability of research findings. It indicates the extent to which a study's results can be replicated or repeated with similar outcomes when the research is conducted again using the same methods, tools, and conditions
Intra-Rater:
evaluates the consistency of measurements made by a single person when assessing the same thing
Inter-Rater:
evaluates the consistency of measurements made by different individuals when they are evaluating the same thing
Data:
Facts, information, or numerical counts that can be collected, stored, and analyzed.
Categorical Data:
Descriptive data used to label or classify characteristics; not numerical.
Examples: Ethnicity, religion, periodontal stage/grade.
Display Options: Bar graph, frequency distribution table
Dichotomous Data:
A special type of categorical data with exactly two possible categories.
Examples: Yes/No, dentulous/edentulous, male/female.
Display Options: Bar graph, frequency distribution table.
Discrete Data:
Numeric data that includes only whole numbers or fixed values; cannot have decimals.
Examples: Number of times a person brushes per week, DMF surfaces, number of dental visits per year.
Display Options: Bar graph, frequency distribution table
Continuous Data:
Numeric data that can take on any value within a range, including decimals; measured along a continuum.
Examples: Probe depths, test scores, time, height, weight.
Display Options: Histogram, frequency polygon, frequency distribution table.
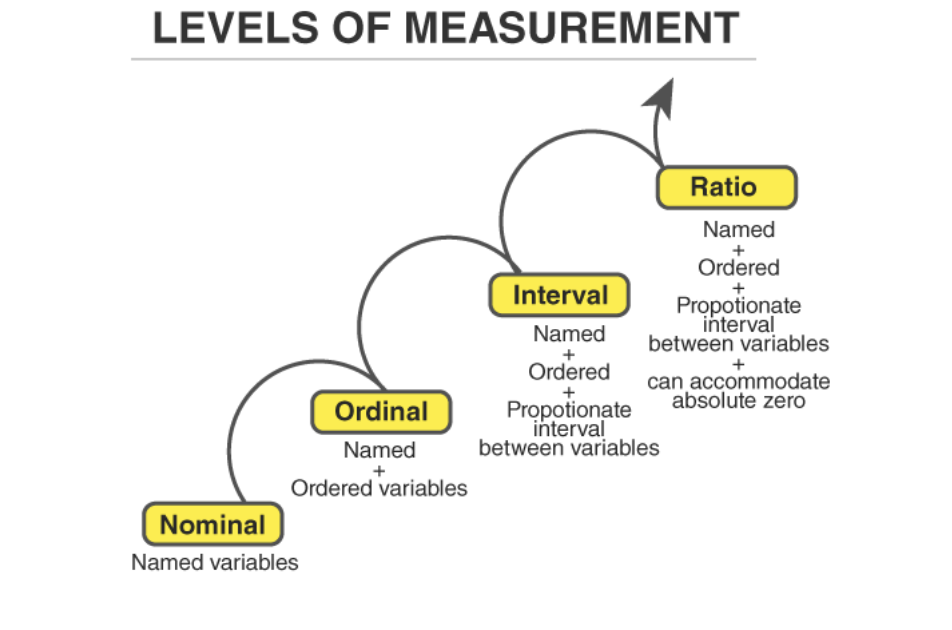
Scales of Measurement:
Different types of data are measured and represented in different ways. These are called scales of measurement, and they determine how data can be organized, analyzed, and displayed.
Nominal Scale:
Data are grouped into mutually exclusive categories that have no numerical order or ranking. These are simply labels or names used to classify information.
Tip: The word nominal comes from “name.”
Type: Categorical or dichotomous.
Examples: Male/Female, ethnic group, religious preference, hair color, type of degree.
Ordinal Scale:
Data are arranged in ranked categories that show order, but the differences between ranks are not equal or clearly defined.
Type: Categorical or dichotomous.
Examples: Periodontal staging (higher stages indicate more disease, but the distance between stages isn’t uniform), socioeconomic status, satisfaction ratings, or many dental indexes.
Interval Scale:
Data have equal distances between values on a scale, but there is no true zero point—zero does not mean “none.”
Type: Discrete or continuous.
Examples: Temperature in °C or °F (0° doesn’t mean “no temperature”).
Note: Oral health variables are rarely measured on an interval scale.
Ratio Scale:
Data have equal intervals between values and a true zero point, meaning zero represents “none” of what’s being measured.
Type: Discrete or continuous.
Examples: Height, weight, number of teeth or sealants, blood pressure.
Note: Ratio data are the most powerful because they allow for all mathematical operations and provide the strongest research evidence.
Statistics:
a way to use numbers to describe information, find patterns, and draw conclusions from data
Mean: Average
Calculated by adding all values and dividing by the number of observations.
Best used with symmetrical data distributions.
Affected by extreme scores (outliers).
Data type: Ratio or interval.
Median: middle value:
The midpoint of a data set when values are arranged in order.
Best used with skewed data distributions.
Not affected by outliers or extreme scores.
Data type: Ratio, interval, or ordinal.
Mode: most frequent value
The value that occurs most often in a data set.
Possible forms: Unimodal (one mode), bimodal (two modes), multimodal (multiple modes), or no mode.
Data type: Nominal
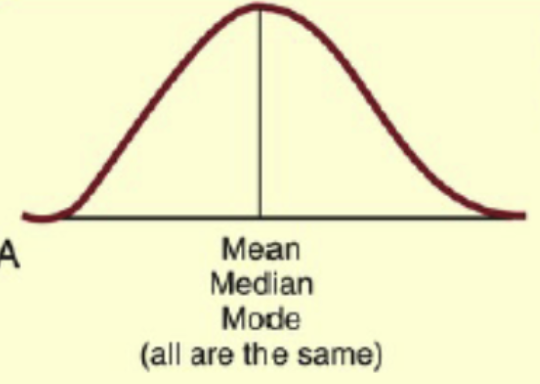
Normal Distribution:
also called symmetrical or bell-shaped
mean, median, mode are all the same
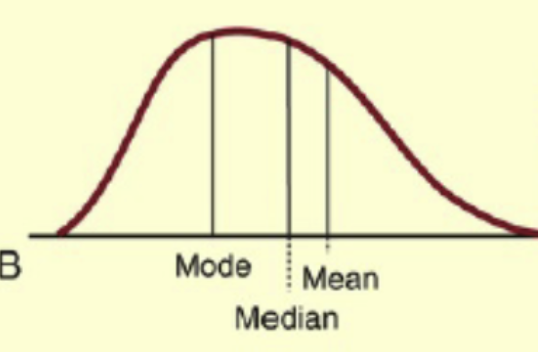
Skewed to the right (positively skewed):
Mean and median are to the right of the mode
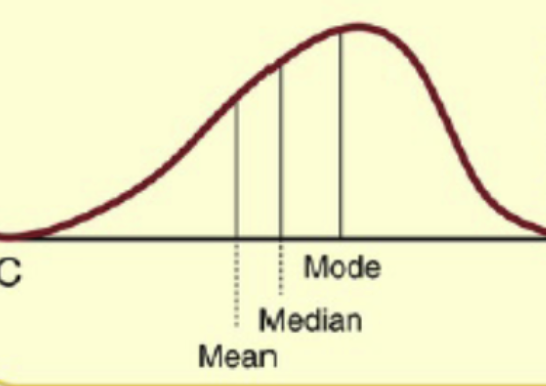
Skewed to the left (negatively skewed)
Mean and median are to the left of the mode
The farther the data points are from the mean, the greater the _______, resulting in a larger variance and standard deviation.
variability
Range:
difference between the highest and lowest values in a data set
Gives a quick sense of how spread out the scores are, but does not show how values are distributed between the extremes.
Variance:
Describes how much individual data points differ from the mean.
Each value’s difference from the mean is squared, so negative and positive differences do not cancel out.
A low variance means data points are close together and similar.
A high variance means data points are more spread out and vary widely.
Standard Deviation:
square root of the variance, giving a measure of spread in the same units as the original data.
Easier to interpret than variance because it reflects the actual scale of measurement.
A low SD means most values are close to the mean.
A high SD means values are spread out across a wider range.
Variance and standard deviation both show how much the data values differ from the _____. Standard deviation is simply the square root of the variance, and together they indicate whether data points are close to or far from the average.
mean
To calculate the variance and SD: (Individual score-mean)2/# of scores:
Subtract each data point from the mean.
Square these differences (to account for neg values)
Add the squared differences.
Divide by the total number of data points (variance)
Figure out the square root of the result (SD)