StemUp: A level STEM General Practical
 Call Kai
 Learn
Learn Practice Test
 Spaced Repetition
 Match
Match Flashcards
 Knowt Play
1/28

There's no tags or description
Looks like no tags are added yet.
Name | Mastery | Learn | Test | Matching | Spaced | Call with Kai | Chat |
|---|
No analytics yet
Send a link to your students to track their progress
29 Terms
What is an independent variable? (2)
- An independent variable is the variable that is changed in an experiment.
- This is done to test its effects on the dependent variable.
What is a dependent variable? (2)
- A dependent variable is the variable that is measured in an experiment.
- This variable is affected by the independent variable.
What are controlled variables? (2)
- Controlled variables are factors that are kept constant during an experiment.
- These ensure that any any changes in the dependent variable are due to the independent variable only.
What is the mean of a data set? (2)
- The mean is a measure of average.
- This is the sum of all values divided by the number of values in the data set.
What are qualitative observations? (2)
- Qualitative observations are observations that deal with descriptions.
- For example, this would include colours.
What are quantitative observations? (1)
Quantitative observations are numerical values.
What is accuracy? (2)
- Accuracy describes how close a reading is to the true value.
- A value is considered accurate if it is close to the true result.
How do you interpret volumes? (1)
- When reading volume from a measuring cylinder or syringe, take the measurement from where the meniscus is.

How do you reduce random errors in measurements? (3)
- To reduce random errors, take multiple measurements and calculate an average.
- Use more precise instruments.
- Increase sample size.
What is the uncertainty in a measurement? (2)
- Uncertainty is the range within which the true value is expected to lie.
- This is given by the precision of the instrument used and the repeatability of the measurements.
How do you calculate the percentage uncertainty of a measurement? (1)
To calculate the percentage uncertainty use
(Absolute uncertainty / Measurement value) x 100.
What should you include when drawing a graph in an experiment? (4)
- Labelled axes (with units).
- Title.
- Line of best fit.
- Data points plotted (with error bars if applicable).
What is the purpose of a control experiment? (3)
- A control experiment is used to compare results.
- This helps to confirm that the effect on the dependent variable is due to the independent variable alone.
- This ensures that the results were obtained without any interference from other factors.
How do you ensure an experiment is reliable? (3)
- To ensure an experiment is reliable, repeat the experiment multiple times.
- Maintain consistent controlled variables.
- Use precise instruments.
What are systematic errors? (2)
- Systematic errors are consistent, repeatable errors.
- They are caused by faulty equipment or flawed experimental design.
How can systematic errors be minimised? (3)
- Calibrate instruments.
- Use appropriate methods.
- Cross-check results with different methods.
Why is it important to calibrate instruments before taking measurements? (3)
- Calibrating instruments ensures that they provide accurate readings.
- This is done by comparing them to a known standard.
- Thereby, systematic errors are reduced.
What is a colorimeter? (2)
- A colorimeter is apparatus that measures light absorbance or light transmission.
- It is used to measure colour change.
What questions are asked in a risk assessment? (3)
- What could harm you?
- What harm could it cause you?
- What actions could be put in place to prevent / treat harm?
What are some ways in which pH is measured? (3)
BIOLOGY AND CHEMISTRY ONLY
- Indicator paper.
- Indicator solution.
- pH metre.
How is length measured? (2)
- Ruler.
- Tape measure.
What needs to be considered when measuring length? (2)
- The scale needs to be considered.
- High enough precision of equipment should be ensured.
How is temperature measured? (2)
- Thermometer.
- Data logger.
How is volume of a gas measured? (1)
Gas volume is measured using a gas syringe.
How is volume of a solution measured? (2)
- Measuring cylinder.
- Syringe.
How is time measured? (1)
Time is measured using a stop watch.
How is mass measured? (1)
Mass is measured using balances/scales.
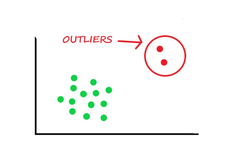
What is an anomaly? (2)
An anomaly is an outliner in a set of results
What is standard deviation? (2)
- Standard deviation measures the spread of data around the mean value.
- This is useful when comparing consistency between different data sets.