Chapter 7: Inventory Management Concepts and Models
1/70
There's no tags or description
Looks like no tags are added yet.
Name | Mastery | Learn | Test | Matching | Spaced |
|---|
No study sessions yet.
71 Terms
Dependent Demand
Internal demand for parts based on final product demand.
Independent Demand
Demand for end products influenced by market conditions.
Raw Materials
Unprocessed inputs purchased for production.
Work-in-Process (WIP)
Partially processed materials not ready for sale.
Finished Goods
Completed products prepared for shipment.
Maintenance, Repair, and Operating (MRO)
Supplies used in production processes.
Direct Costs
Costs directly traceable to produced units.
Indirect Costs
Costs not directly traceable to produced units. (factory overhead, indirect labor-managers/maintenance, indirect materials, etc)
Fixed Costs
Costs independent of output quantity. (rent, equipment)
Variable Costs
Costs that vary with output levels. (martials cost)
Setup Costs
Costs related to preparing equipment for production.
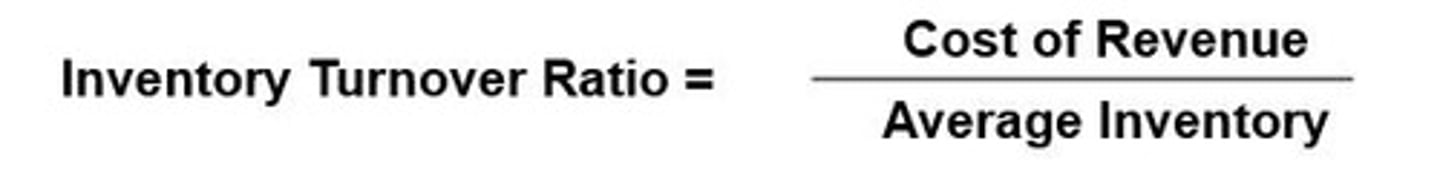
Inventory Turnover Ratio
Frequency of inventory turnover in a period. Cost of revenue/ Average inventory
Cycle Counting
Periodic physical counting of inventory.
ABC Inventory Control System
Classifies inventory into A, B, and C categories. Tells which inventories should be monitored more closely.
A Items
High priority items, 20% of items, 80% Inventory cost.
B Items
Medium priority items, 40% of items, 15% inventory cost.
C Items
Low priority items with minimal value. remaining 40% of items with only 5% inventory cost.
Pareto rule/ Analysis or 80/20 Rule
80% of results from 20% of efforts, while remaining 20% of results are achieved by 80% of tasks
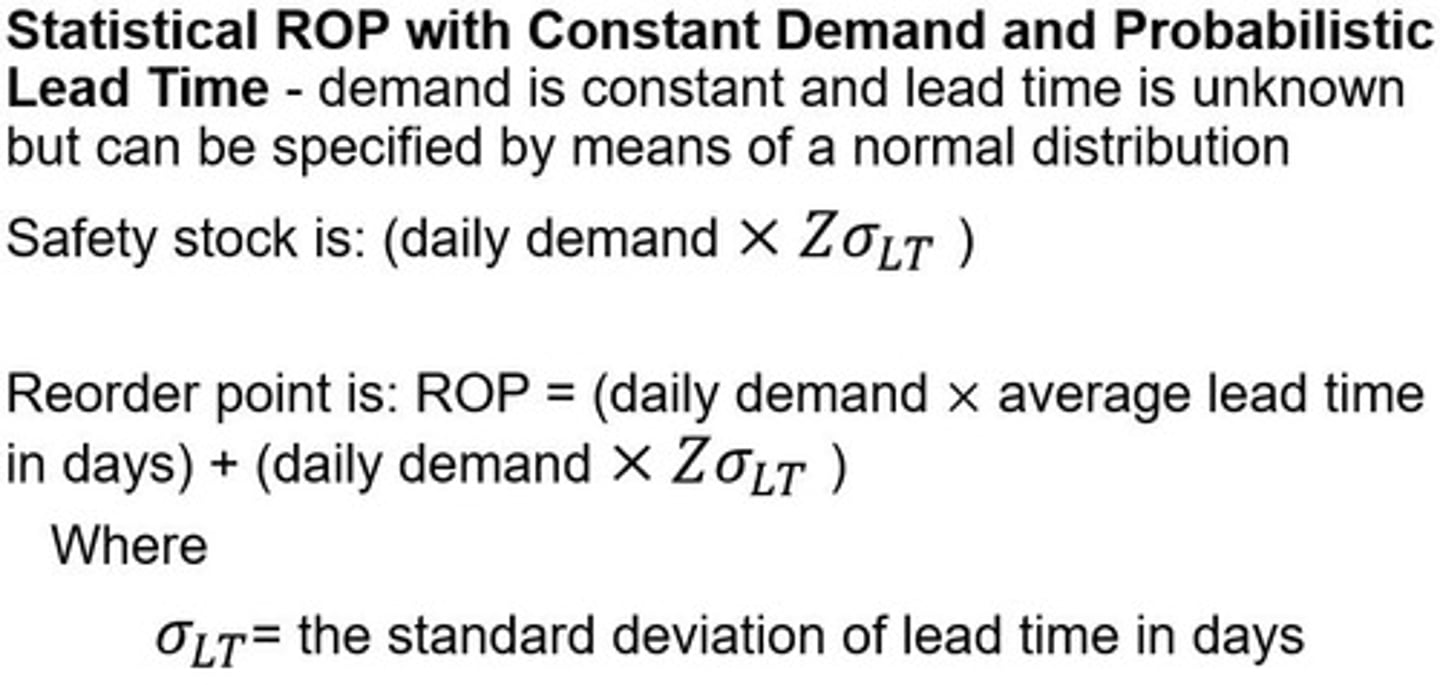
Safety Stock
Extra inventory to prevent stock outs. Formula=Daily Demand x standard deviation of lead items in days
ROP Models
Statistical models for determining reorder points.
RFID
Tracks goods without direct line of sight.
RFID Tag
Computer chip with antenna for wireless communication.
RFID Reader
Device that reads RFID tags, handheld or fixed.
Communication Network
Connects RFID readers to enterprise information systems.
RFID Software
Manages data collection and synchronization in inventory, ERP, and supply chain planning systems.
Near field Data Communication
Secure data exchange between NFC tags and Android devices.
EPC Standard
Standard for RFID tags developed by EPCglobal, Inc.
Passive RFID Tags
Classes 0, 1, 2; no power source. No boosted range
Active RFID Tags
Classes 3, 4; contain power source for Boosted range.
Class 5 Tags
Communicate with other Class 5 tags and devices.
ISO 18000-6C
Standard for RFID communication protocols.
Materials Management
Automated logging of goods entering supply warehouses.
Manufacturing Automation
Customer configurations encoded on tags for production.
Distribution Center Automation
Updates ERP for replenishment upon shipment.
Retail Store Automation
Triggers replenishment when items reach reorder point.
Global RFID Challenges (5)
Consumer privacy issues + China privacy issues, reginal strategies, differences in radio frequencies round the world, signals deflected by metal and absorbed by water, and costs hinder RFID adoption.
Big Data
Large data sets requiring advanced processing tools.
Order Cost
Direct variable cost associated with placing an order.
Deterministic Parameters
Price, demand, and other factors that determine if you should use EOQ, EMQ or price-break model.
Replenishment Assumption
Assumes instantaneous replenishment in EOQ model.
Price Assumption
Assumes price remains constant in EOQ model.
Replenishment
Restocking inventory occurs instantly without delay.
Price Constancy
Price remains unchanged during inventory management.
Holding Cost
Cost incurred for storing inventory over time.
Stockouts
Situations where inventory runs out completely.
Total Annual Inventory Cost (TAIC)
Sum of purchase, holding, and order costs annually.
Annual Purchase Cost (APC)
Total cost of purchasing inventory for a year.
Annual Holding Cost (AHC)
Total cost of holding inventory for a year.
Annual Order Cost (AOC)
Total cost of placing orders annually.
Economic Order Quantity (EOQ)
Optimal order quantity minimizing total inventory costs. Quantitative model based on trade-off between annual inventory cost and annual order cost
Seeks OPTIMAL order quantity
Order cost is direct variable
Holding cost is incurred for holding storage
Assumptions for the EOQ model:
Demand is known and constant
Order lead time is known and constant
replenishment is instantaneous
Price is constant
hold cost is known and constant
Order cost is known and constant
Stock outs are not allowed.
Quantity Discount Model
EOQ variation allowing discounts for larger purchases.
Trade-off in Inventory
Balancing purchase quantity discounts against holding costs.
Economic Manufacturing Quantity (EMQ)
Model allowing gradual inventory build during production.
Simultaneous consumption and manufacturing
Relaxes instantaneous replenishment assumption by allowing for partial delivery during production
Production Rate (P)
Rate at which inventory is produced over time.
Maximum Inventory (Q M)
Peak inventory level during production period.
Safety Stock
Extra inventory held to prevent stockouts.
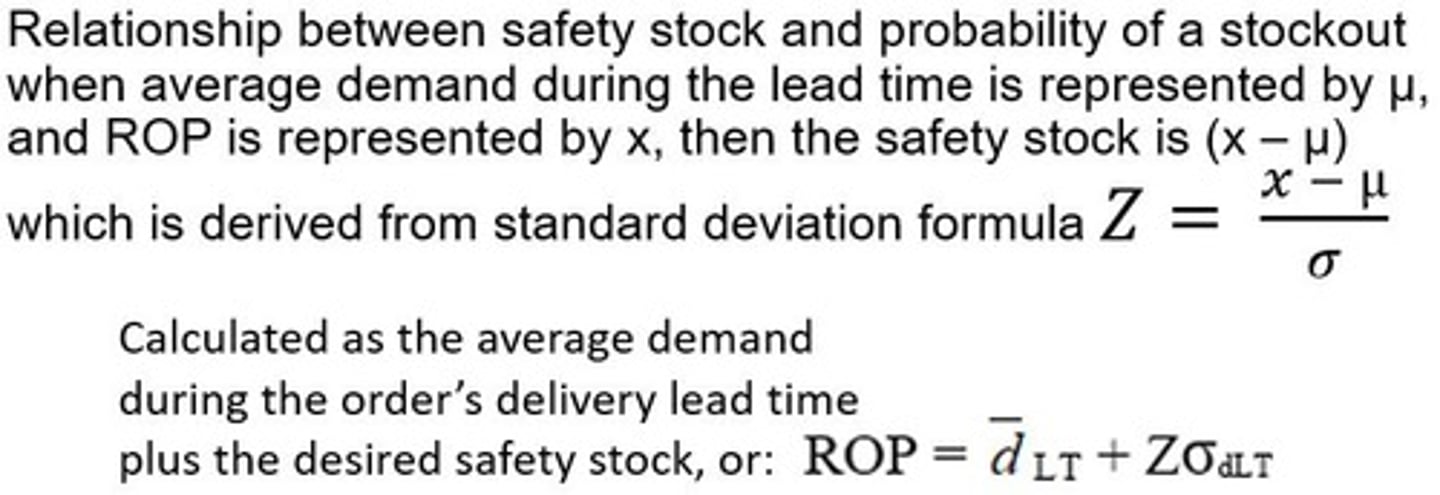
In-stock Probability
Likelihood of having inventory available when needed.
Continuous Review System
Ongoing inventory checks to determine reorder needs.
Shows stock records and actual inventory differ
need continuous review to know when to re-order
can be difficult to implement and very expense to implement
Periodic Review System
Inventory checked at set intervals for restocking. (weekly, monthly, etc.
Requires more safety stock that continuous review system
(s, Q) Policy (First CR)
Reorder fixed quantity, Q, when inventory hits reorder point, s.
(s, S) Policy (Second CR)
When current inventory falls below the reorder point, s, sufficient resources re ordered to bring inventory back up to pre-determined level, S.
(nQ, s, R) Policy (First PR)
when review happens, if inv level is equal to or less that reorder point, s, the quantity, nQ, is ordered to bring inventory back up to a level between s and (s + Q) to restore inventory above reorder point.
(s, S, R) Policy (Third PR)
When reviewed, if inventory is = to or less than or equal to reorder point, s, order enough to reach maximum inventory, S
Primary functions of inventory
Add buffer from uncertainty in the market and Decouple (reduce) dependencies in the supply chain (safety stock)
4 broad categories of inventories
Raw Materials, WIP, Fished goods, and MRO
Absolute Value of inventory
value of inventory on the balance sheet
How RFID can automate a supply chain (4)
Materials management- good automatically counted and logged as they enter warehouse
Manufacturing- Customer configuration encoded on stage to be incorporated automatically during the production process
Distribution center- Shipment leaving the DC automatically updates ERP to trigger a replenishment order and notifies the customer of the delivery
Retail- Reader placed on shelf to trigger automatic replnishent when items reach reorder point. Help with cycle counting.
Big Data Decision-Making
- Big data broadly refers to collections of data sets too large and complex to be processed by traditional database management tools or data processing software applications.
- instead, massive parallel software applications running on hundreds, or thousands of servers simultaneously are required to store and process the data.
- Big data technology helps process data in real time to take advantage of information captured by RFID.
Fixed order quantity models
-determines the amount to order based on demand, delivery time, and other determinants
EOQ, EMQ, Quantity discount/Price/break model
Service Level
In-stock probability
(S, R) (second PR)
At each review, enough is ordered to bring it back up to the pre-determine maximum inventory levels, S