STATISTICS REVIEWER
1/36
There's no tags or description
Looks like no tags are added yet.
Name | Mastery | Learn | Test | Matching | Spaced | Call with Kai |
|---|
No analytics yet
Send a link to your students to track their progress
37 Terms
Hypothesis
In statistical reference, it is a statement or claim about characteristics of a population.
Hypothesis testing
A decision-making process for evaluating claims about a population parameter
Null hypothesis
Initial claim which the researcher tries to disprove, reject or nullify.
Alternative hypothesis
Contradicts the null hypothesis. Also known as research hypothesis.
Significance level
Probability of committing a Type I error, probability of rejecting the correct null hypothesis.
Confidence level
probability of not committing a Type II error
Type I error
True null hypothesis is incorrectly rejected, “false positive.”
Type II error
False null hypothesis is not rejected, “false negative.”
Test statistic
a rule, based on sample data, for deciding whether to reject null hypothesis
Z-test
Used for n>30 participants.
T-test
Used for n<30 participants.
Rejection region
Shaded area. When test statistic lies on rejection region, Ho will be rejected.
Critical Value
value that separates the non-rejection and rejection region. Also known as confidence coefficients.
Decision Rule
We reject the Ho if test statistic is > T tabular.
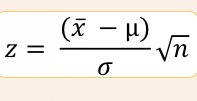
What formula is this?
Z-test formula
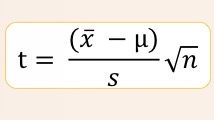
What formula is this?
T-test formula.
Population proportion
The number of members in the population with a particular attribute divided by the number of members in the population.
Two-tailed test
A test that uses keywords such as change, the same, different/difference.
One tailed test
A test that uses keywords such as increased, greater, larger, improved.
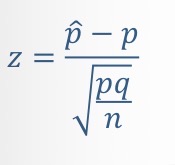
What formula is this?
Testing for single proportion.
Correlation Analysis
A statistical method used to determine whether a relationship between two variables exists. We can describe the realtionship between two variables.
Bivariate Data
Data that involve two variables; purpose of the analysis is to describe relationships. Two variables taken from sample or population.
What it’s important to know in correlation analysis?
1.) How strong the correlation is
2.) In which direction the correlation goes.
Positive correlation
exists when high values of one variable
correspond to high values in the
other variable or low values in
one variable correspond to low
values in the other variable.
Negative correlation
exists when high values in one
variable correspond to low values
in the other variable or low values
in one variable correspond to high
values in the other variable
Zero correlation
exists when high values in one variable
correspond to either high or low
values in the other variable.
Correlation Analysis Techniques
1.) Scatterplot Diagram
2.) Pearson Product-Moment Correlation Coefficient.
Scatterplot
shows how each point collected from a
set of bivariate data are scattered
on the Cartesian plane. It is a
graphical representation of the
relationship between two
variables.
Pearson R
It is the most commonly used
statistic to measure the degree of
relationship between two variables
Who developed the Pearson R
Karl Pearson.
Regression Analysis
When two variables are
significantly correlated, we can
predict the value of one
variable in terms of the other
variable. This process is called
regression analysis.
Testing the Significance of R
The computed correlation coefficient r should
be tested for significance.
❑If r is significant
then the relationship
between two variables exists in the actual
population.
❑If r is not significant
then the relationship is
due to chance alone, and it does not really
exist in the population.
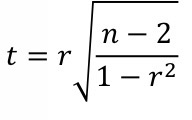
What formula is this?
This is for testing the significance of R
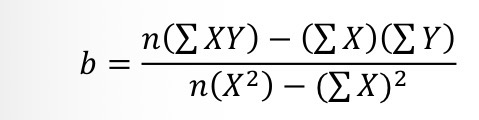
What formula is this for? it also uses the formula for significance of r.
This is for regression analysis.
Y’= a+bX
Equation of regression line.