eco3203 chap 12 & 13
1/14
There's no tags or description
Looks like no tags are added yet.
Name | Mastery | Learn | Test | Matching | Spaced | Call with Kai |
|---|
No analytics yet
Send a link to your students to track their progress
15 Terms
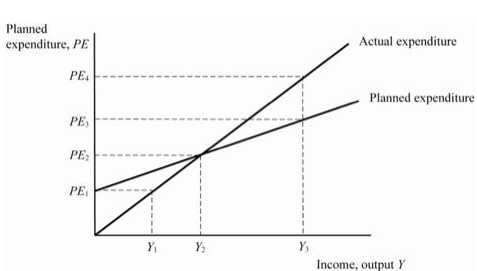
the keynesian cross
simple closed-economy model in which income is determined by expenditure
notation:
I = planned investment
PE = C + I + G = planned expenditure
Y = real GDP = actual expenditure
actual - planned expenditure = unplanned inventory investment
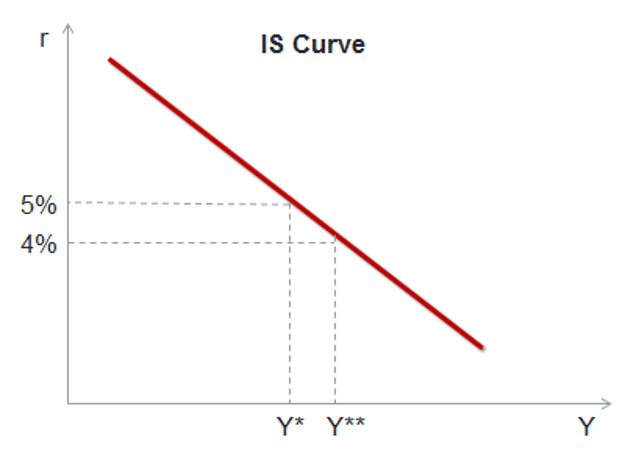
IS curve
relationship between income and the interest rate
shows combinations of interest rates and output where the goods market is in equilibrium
Y = C(Y - T bar) + I(r) + G bar
shift:
ΔY = (-mpc / 1 - mpc) * ΔT
ΔT works better in calculations
variable y
Y = C + I + G (equilibrium condition)
ΔG = ΔY * (1 - mpc)
solving for Δy:
ΔY = (1/1 - mpc) * ΔG
ΔY / ΔG = 1 / 1 - mpc
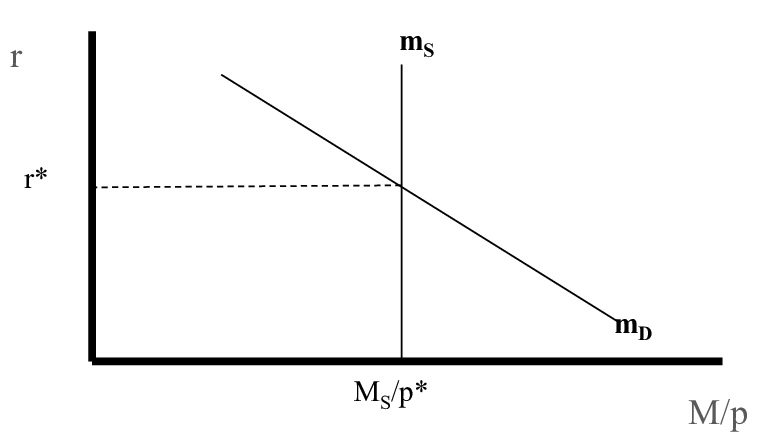
money market model and money demand
money demand equation: (M / P)^d = L(r)
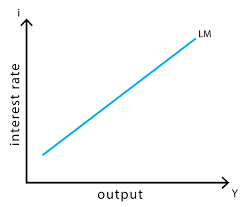
LM curve
shows the changes in the money market’s equilibrium
IS-LM graph
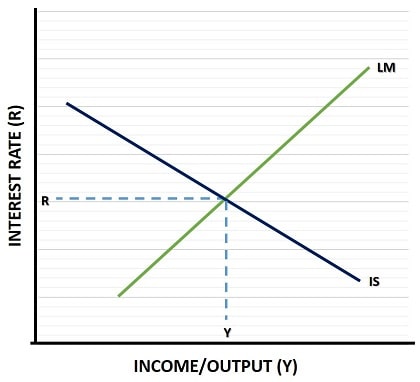
IS shocks
exogenous changes in demand
crowding out
increase in government spending leads to less investment in the private sector
2001 recession
2.1 million jobs lost
unemployment rate rose from 3.9% to 5.8%
GDP growth slowed to 0.8%
federal funds rate
the interest rate banks charge one another
the Fed targets this particular interest rate
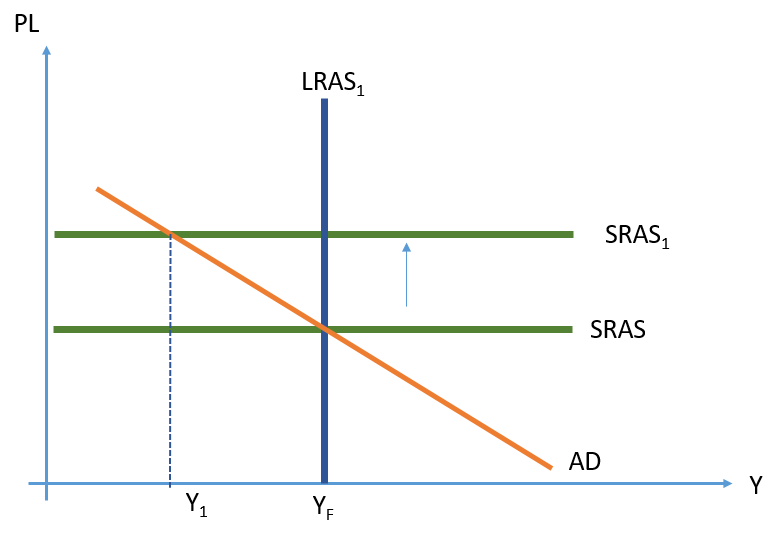
AD curve
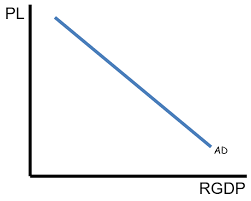
AD-AS model
great depression
stock market crash (1929, 1933)
investment decreased
due to: overbuilding in ‘20s; government spending increased while output/income decreased; widespread bank failures
another depression unlikely
effects of borrowing on inflation
if inflation goes down, the real cost of borrowing increases (and vice versa)
2008/2009 financial crisis
bursting house price bubble
foreclosure rates increased
mortgage crisis
declining consumer confidence, less investment and spending on consumer durables
falling stock prices
failing financial institutions
2009: real GDP falls, unemployment rate ~10%