Statistics Wk 1
1/60
There's no tags or description
Looks like no tags are added yet.
Name | Mastery | Learn | Test | Matching | Spaced |
|---|
No study sessions yet.
61 Terms
What is a random sample?
Sequence of independent random variables, that are identically distributed

What is the property of pdf given X is iid?
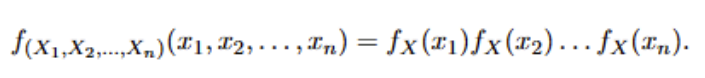
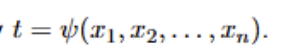
What is the realisation or observed value of T given by?
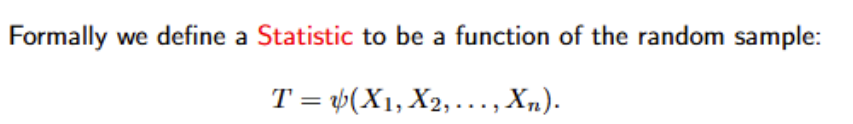
What does a Statistic depend on? What is it not?
It depends on the random sample and not a function of any unknown parameter of the distribution
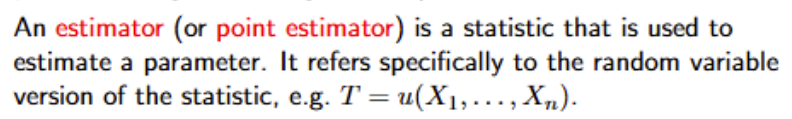
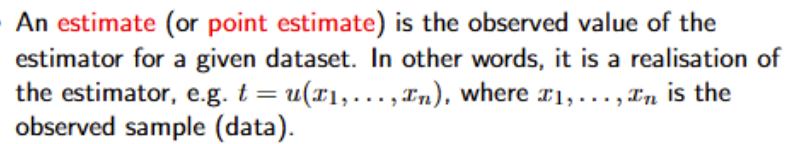
What is an estimator?
A statistic used to estimate a parameter
What is an estimate?
It is the observed value of the estimator, so the realisation of the estimator
What are the categories of data collection?
Randomised Controlled Trial, observational/cohort, case control, survey
What are some real populations sampling methods?
Simple, systematic, stratified, cluster
What are the data types?
Categorical(nominal and ordinal) and numerical (discrete/continuous, interval/ratio)
What is the primary research interest of Randomised Control Trial(RCT)?
Determining causality
What may complicate analysis of Randomised Controlled Trial? Define it
Confounding which involves multiple correlated factors affecting the response of interest, where it is hard to separate out influences
What does simple random sampling involve?
Every item in the population has an equal probability of being selected in the sample
What does stratified random sampling involve?
Partitioning the population into groups based on a variation in a characteristic of interest, then random samples are taken from each group
What does cluster sampling involve?
Population is partitioned into groups that each have similar characteristics to the overall population, where a subset of groups are chosen and then within each group, a random sample is chosen
What does systematic sampling involve?
List out all the items in the population. Then items selected from the list by starting at a random point on the list and then selecting the other items at a regular interval. Interval = total population/desired population size
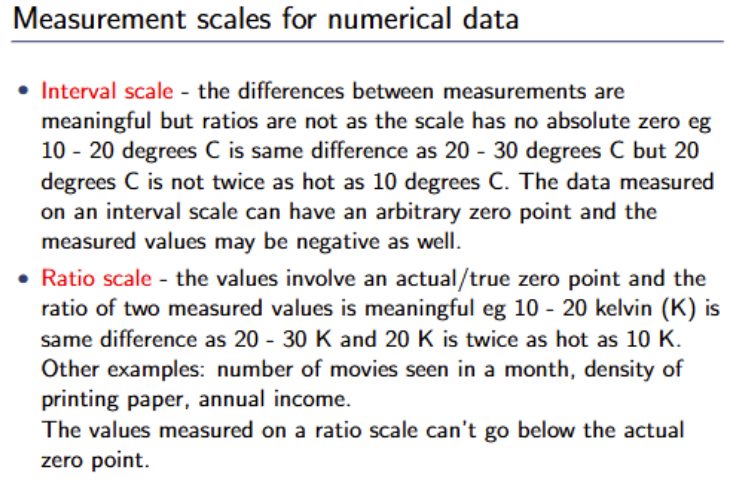
What are the 2 measurement scales for numerical data?
Interval scale and ratio scale
What are the characteristics of interval vs ratio scale?
In interval scales, it doesn’t have an absolute zero value, as there can be negative values on the scale, hence, ratios are not meaningful, whilst the differences in measurement are meaningful. For a ratio scale, it has a true zero point, can’t take on negative values and ratios are meaningful
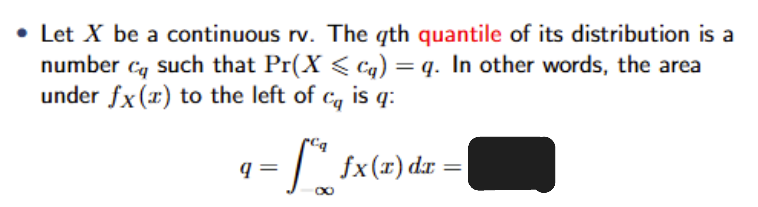
What is in the black box?

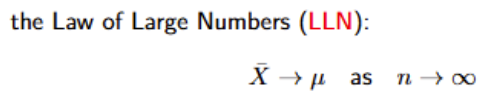
What is the Law of Large Numbers?
What is the Central Limit Theorem?
What are the five principles of good graphics?
Show the data clearly, use good alignment on a common scale for quantities to be compared, use simplicity in design, keep the visual encoding transparent, prefer standard forms of demonstration

What are some ways to show the data clearly?
Identify the source of the data, the purpose of the graphic should influence its construction, the graph should show the data, distractions and distortions should be avoided, labelling in the title, on axes and for data points should be well-chosen and informative
What is the most important guiding principle for the construction of quantitative graphics?
Align quantities to be compared on a common linear scale
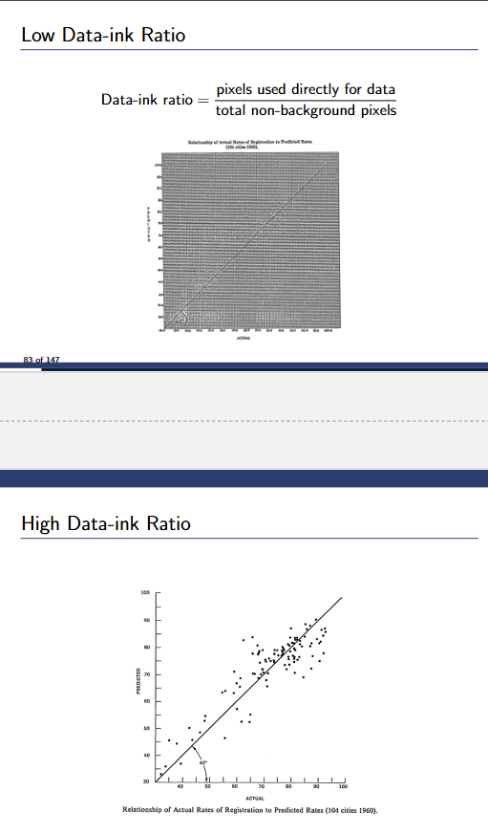
What is the data:ink ratio? Write out the formula
Used to measure the density of information in the representation. pixels used directly for data/total non-background pixels
Would you rather low data:ink ratio or high data:ink ratio?
High data:ink ratio
What does it mean to keep the visual encoding transparent?
Ensure that as soon as an individual looks at the graph, the results are obvious to see
What are the standard forms of visually representing data?
Time-series plot, bar chart, scatter plot, dot plot, histogram, boxplot
What are dot plots useful for?
Best used for small sample sizes, can show the detail and distribution of numerical variable and can be extended to compare more than one group
What do you do when you obtain unusual values?
May need careful handling, warrant an investigation into recording procedures. If no mistakes, include them in consideration
Can you just remove outliers from data for analytical convenience? Why or why not?
No since it is an error or maybe could be a serious error to do so
What is a mid outlier?
Lies more than 1.5*IQR below Q1 or above Q3
What is an extreme outlier?
Lies more than 3*IQR below Q1 or above Q3
What does R highlight in default? Mild or extreme outliers?
Mild outliers
Are outliers valuable or can we just ignore them?
They are valuable since they either contain information about what is being investigated or the data gathering and recording process.
A scatterplot shows the relationship between what kind of variables?
2 numerical variables
What is descriptive statistics?
The first step towards understanding our data, and investigating its location, spread and shape
What is used to investigate the location of the data?
Mean, median
What is used to investigate the spread of the data?
Standard deviation, interquartile range, sample range
What is used to investigate the shape of the data?
probability mass function, probability density function, cumulative distribution function
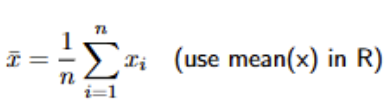
What is the symbol we use to denote the sample mean? What is the formula for the sample/empirical mean of a random variable?
What is the symbol we use to denote the sample variance? What is the formula for the sample/empirical variance of a random variable?
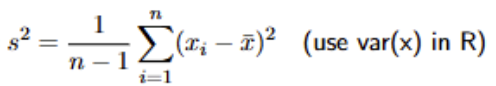
When calculating the sample variance, why do we divided by n-1 and not n?
To get a more unbiased and accurate estimate of the sample variance. If you use n, then the variance tends to be underestimated
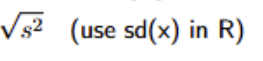
What is the formula to calculate the sample standard deviation?
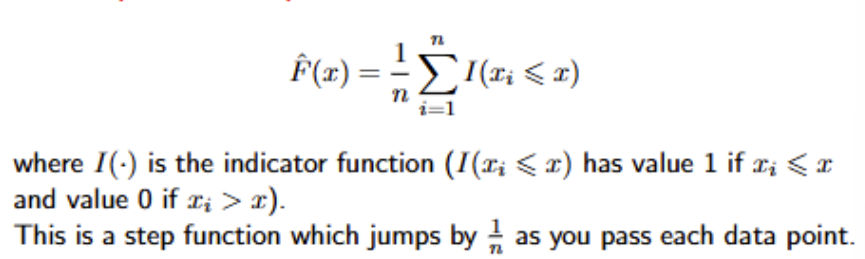
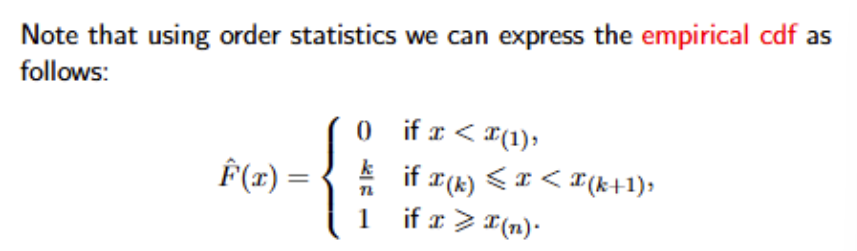
What is the formula for the empirical cdf?
This makes sense because if you think about it, each event of xi<=x is equally likely, and if there are n number of xi’s, then 1/n gives you the probability that an xi<x, so you add the summation in since we are talking about cumulative, so probability that x1 and x2 are less than x is 2/n.
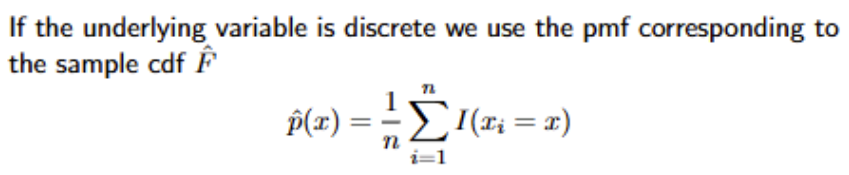
What is the formula for the empirical pmf?
You need the summation so you can scan the whole dataset and see how many xi’s are equal to x. Then you add that number up and divide by n to determine the probability of x occurring.
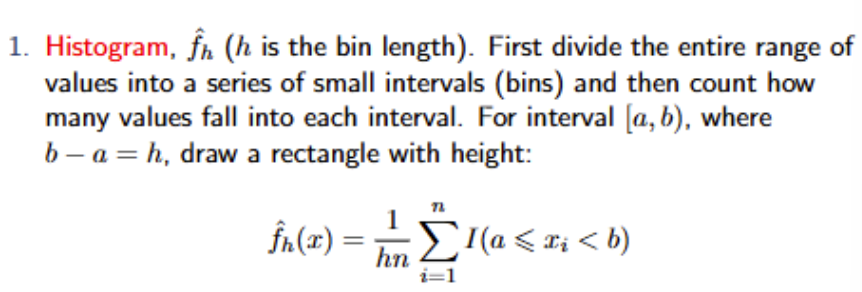
If the underlying variable is continuous, you would prefer to obtain an approximation of the pdf. What is the formula for the pdf using the histogram approach?
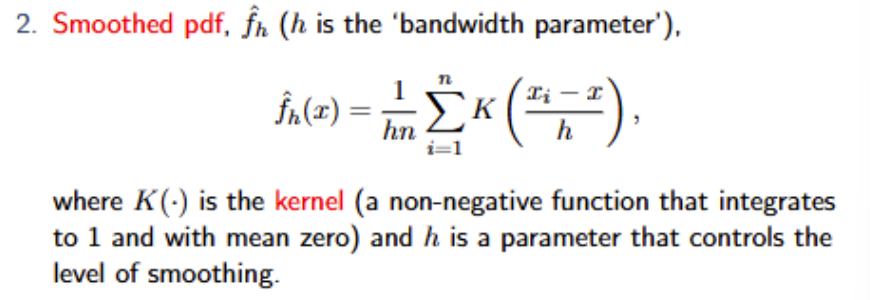
If the underlying variable is continuous, you would prefer to obtain an approximation of the pdf. What is the formula for the pdf using the smoothed pdf approach?
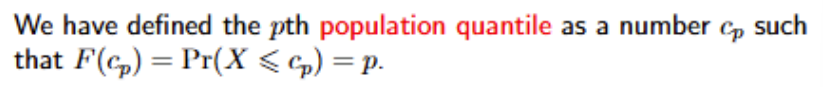
What is the definition of the pth population quantile?
What is the definition of the pth sample quantile?

Using Order statistics, how can we express the empirical cdf?
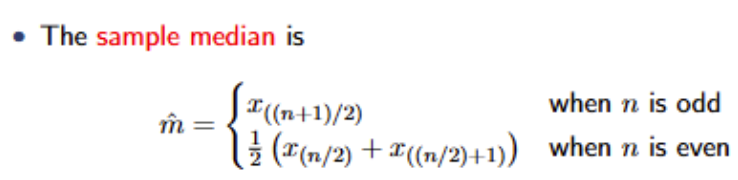
What is the symbol used to denote the sample median? What is the formula to obtain the sample median? When would the median be the preferred measure of location?
It would be preferred over mean to measure location for data that is highly skewed
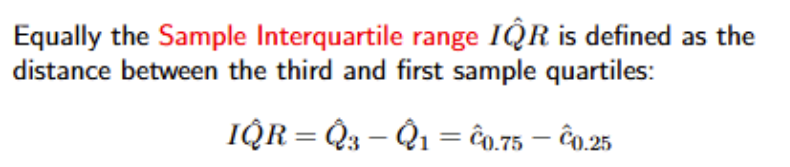
What is the formula for the Interquartile Range? When would IQR be a preferred measure of spread?
It would be preferred for data that is highly skewed
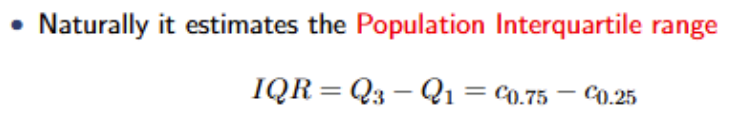
What does the sample IQR estimate?
The population interquartile range
What plot do we use to tell what kind of distribution a sample follows?
Quantile-Quantile plots
What does a Quantile-Quantile (QQ) plot involve?
Find a typical sample from the given population and plot it against our sample. If our sample is from that distribution, the 2 will be similar and we will get a straight line y = x.
Should you use empirical pdf’s or cdf’s to tell if a sample is from any given distribution? Why or why not?
No since the empirical shapes vary quite a bit and its hard to compare curved shapes
What does a QQ plot look like?
Plot our sample on the y-axis and the typical population sample on the x-axis
What is the difference between a QQ plot and a Probability plot?
The axes are opposite.
What is a typical population sample?
Where a sample of n sample points chops the line of a distribution into (n+1) intervals with equal probabilities of 1/(n+1)
What assumption do many procedures and models make about the underlying population distribution?
It’s normally distributed
What type of plots are used to test normality of samples?
Normal quantile plots