2nd- Chapter 4 The sample Correlation Coefficient.
1/5
There's no tags or description
Looks like no tags are added yet.
Name | Mastery | Learn | Test | Matching | Spaced |
|---|
No study sessions yet.
6 Terms
Rxy
The sample correlation coefficient.
Book Def: measures the strength of the linear relationship between X and Y. It gives the average change in standard deviations of Y for every 1 standard deviation increase in X.
Ex: rxy= +0.72 means that the Y-variable rose an average of 0.72 std deviations for every 1 std deviation increase in X.
Gpt:
A number that measures how strong and what direction the relationship between X and Y is.
It always falls between –1 and +1.
+1 = Perfect positive relationship (X goes up, Y goes up exactly).
–1 = Perfect negative relationship (X goes up, Y goes down exactly).
0 = No linear relationship.
Interpretation:
rₓᵧ = +0.72 → On average, for every 1 standard deviation increase in X, Y increases by 0.72 standard deviations.Example:
X = Hours studied, Y = Exam scores
rₓᵧ = 0.72 → Strong positive relationship (more hours, higher scores).
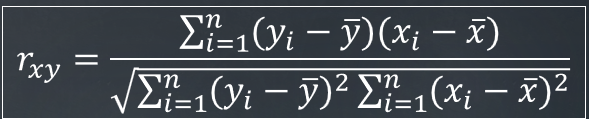
(The sample correlation coefficient) rxy equation:
Book Def:
Think of (yi-y ̅) as Y’s deviation of the mean and (xi-x ̅ ) as X’s deviation from the mean.
(yi-y ̅)(xi-x ̅) is the product of Y’s deviation from its mean and X’s deviation from its mean.
∑(yi-y ̅)^2 and ∑(xi-x ̅)^2 are the total variation of X and Y.
Gpt:
The formula measures how strongly two things (X and Y) move together.
If both go up and down together, the correlation is positive (close to +1).
If one goes up when the other goes down, the correlation is negative (close to –1).
If they move randomly, the correlation is near 0.
Part | Meaning | In simple words |
|---|---|---|
xi | Each value of X | One data point for X |
yi | Each value of Y | One data point for Y |
xˉ | Mean (average) of all X’s | The center of X values |
yˉ | Mean (average) of all Y’s | The center of Y values |
)(xi−xˉ) | X’s deviation from its mean | How far each X is from average |
(yi−yˉ) | Y’s deviation from its mean | How far each Y is from average |
Numerator ∑(xi−xˉ)(yi−yˉ)\ | Sum of products of deviations | Shows how X and Y move together |
Denominator Squared ∑(xi−xˉ)² ∑(yi−yˉ)² | Scale adjustment | Makes result between –1 and +1 |
See how far each X and Y is from their average.
Multiply those differences together for each pair.
If both are above or below average → positive product.
If one is above and the other below → negative product.
Add up all those products.
Divide by the total variation (the denominator).
The result tells you how related X and Y are.
Example intuition
r= +1: Perfect upward trend — when X increases, Y always increases.
r= −1: Perfect downward trend — when X increases, Y always decreases.
r= 0r: No consistent relationship between X and Y.
Y=
Bood Def:
Dependent Variable/ output
-What you’re trying to explain, predict, or measure.
-Think of it as the “outcome or result”
Ex:
Y= House price
Y= Infant mortality rate
Y= Exam score
Y is the Dependent Variable because it should somewhat depend on the model.
Gpt:
Y (Dependent Variable): the thing that changes as a result.
→ It “depends” on X.
In short
X → given or controlled → causes changes in Y.
Y → responds → depends on X.
X is “independent” not because it’s totally separate from Y in real life,
but because we treat it as something that isn’t affected by Y in our model.
X=
Independent Variable/ input/ determined independently.
-The factor you think influences or explain Y.
Ex:
X= Study time (affects exam score)
X= Income per person (Affects infant mortality rate)
X=Square per footage of a house (affects price)
X is the Independent Variable, NOT because it’s independent of Y, but because it should determined outside of the model, called exogeneity.
Gpt:
X (Independent Variable): the thing we control or choose to see how it affects Y.
→ It’s “independent” because it’s decided outside the system we’re studying.
In short
X → given or controlled → causes changes in Y.
Y → responds → depends on X.
X is “independent” not because it’s totally separate from Y in real life,
but because we treat it as something that isn’t affected by Y in our model.
X & Y Examples:
Let’s say we’re studying:
X = hours studied
Y = exam score
Your exam score (Y) depends on how much you study (X).
You choose how many hours to study — that’s outside the exam system.
That’s why X is independent.The exam score responds to how much you studied — that’s why Y is dependent.
Example 1
Y = Exam Scores
X = Mystatlab Averages
Example 2
Y = Infant Mortality Rates
X = Income per Capita
Example 3
Y = Sale Price of a Residential Home
X = Square Feet of Interior Space
Example 4
Y = Exam Scores
X = Student ID number (qualitative data, lol)
What we’re trying to figure out:
How strong is the relationship between X and Y? In what direction? How much evidence is there that X and Y are actually related?