Lecture 4: Population Ageing and the Impact on the UK Economy (OLG)
1/93
There's no tags or description
Looks like no tags are added yet.
Name | Mastery | Learn | Test | Matching | Spaced |
|---|
No study sessions yet.
94 Terms
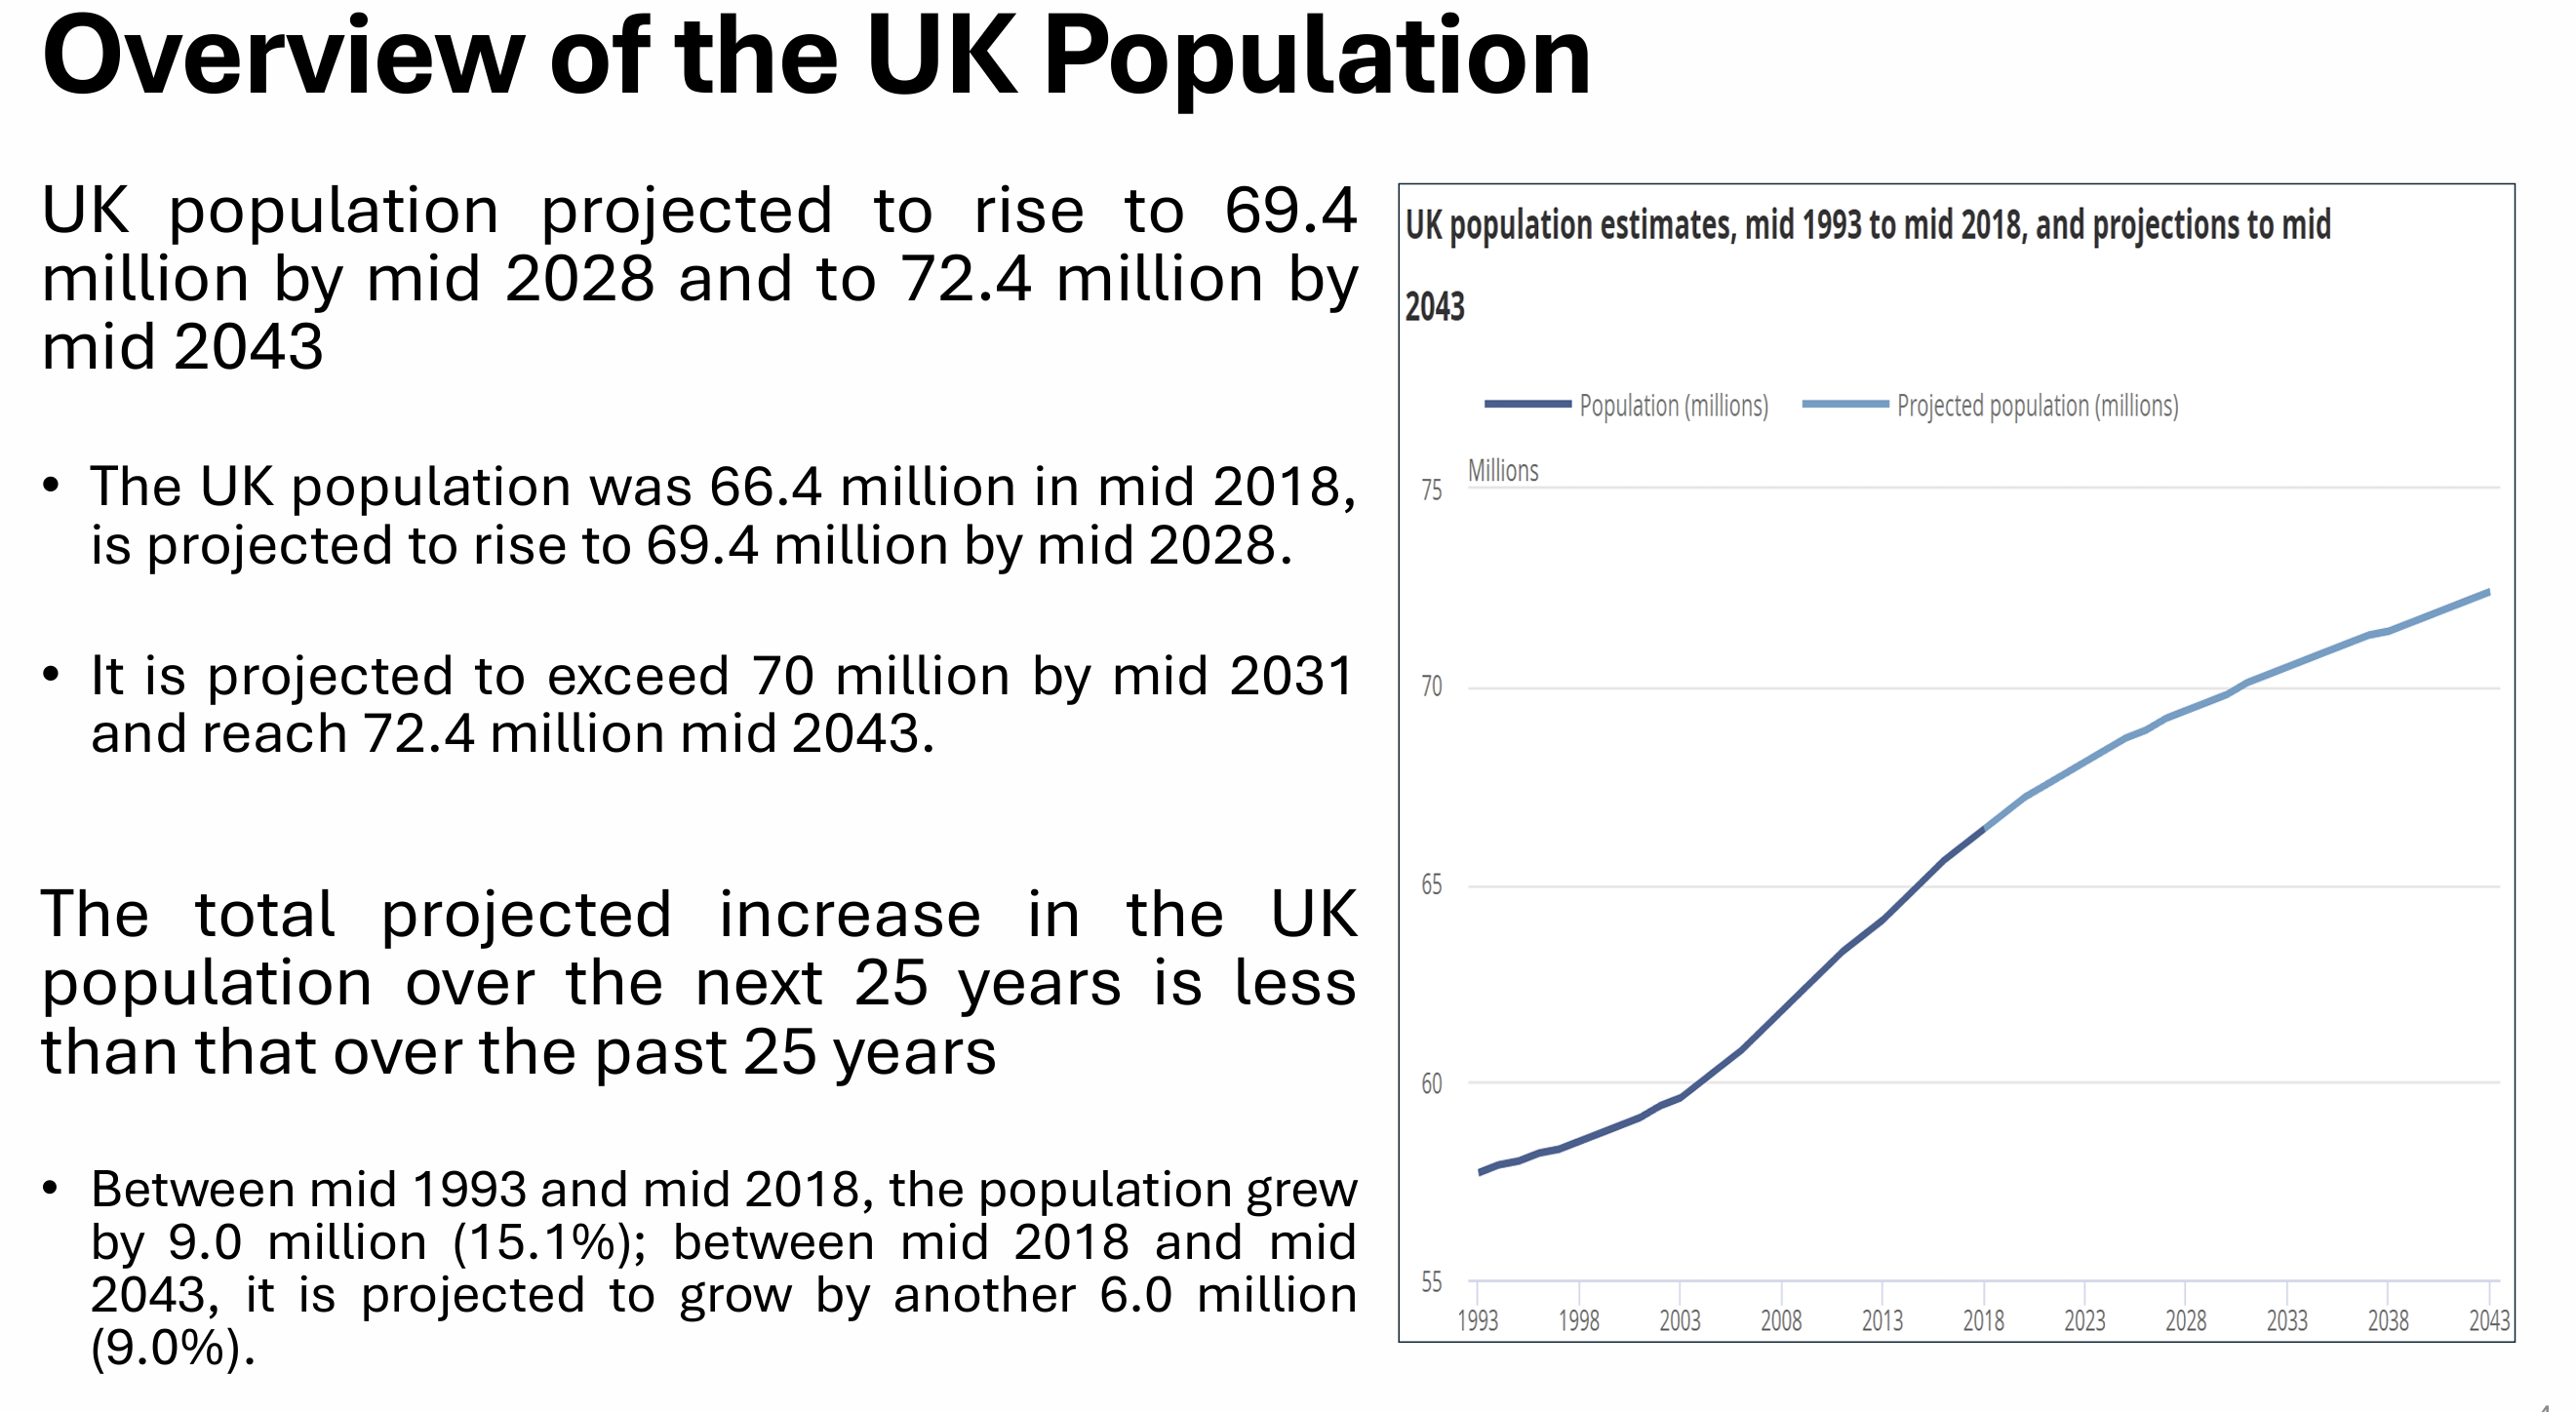
What does the total UK population look like?
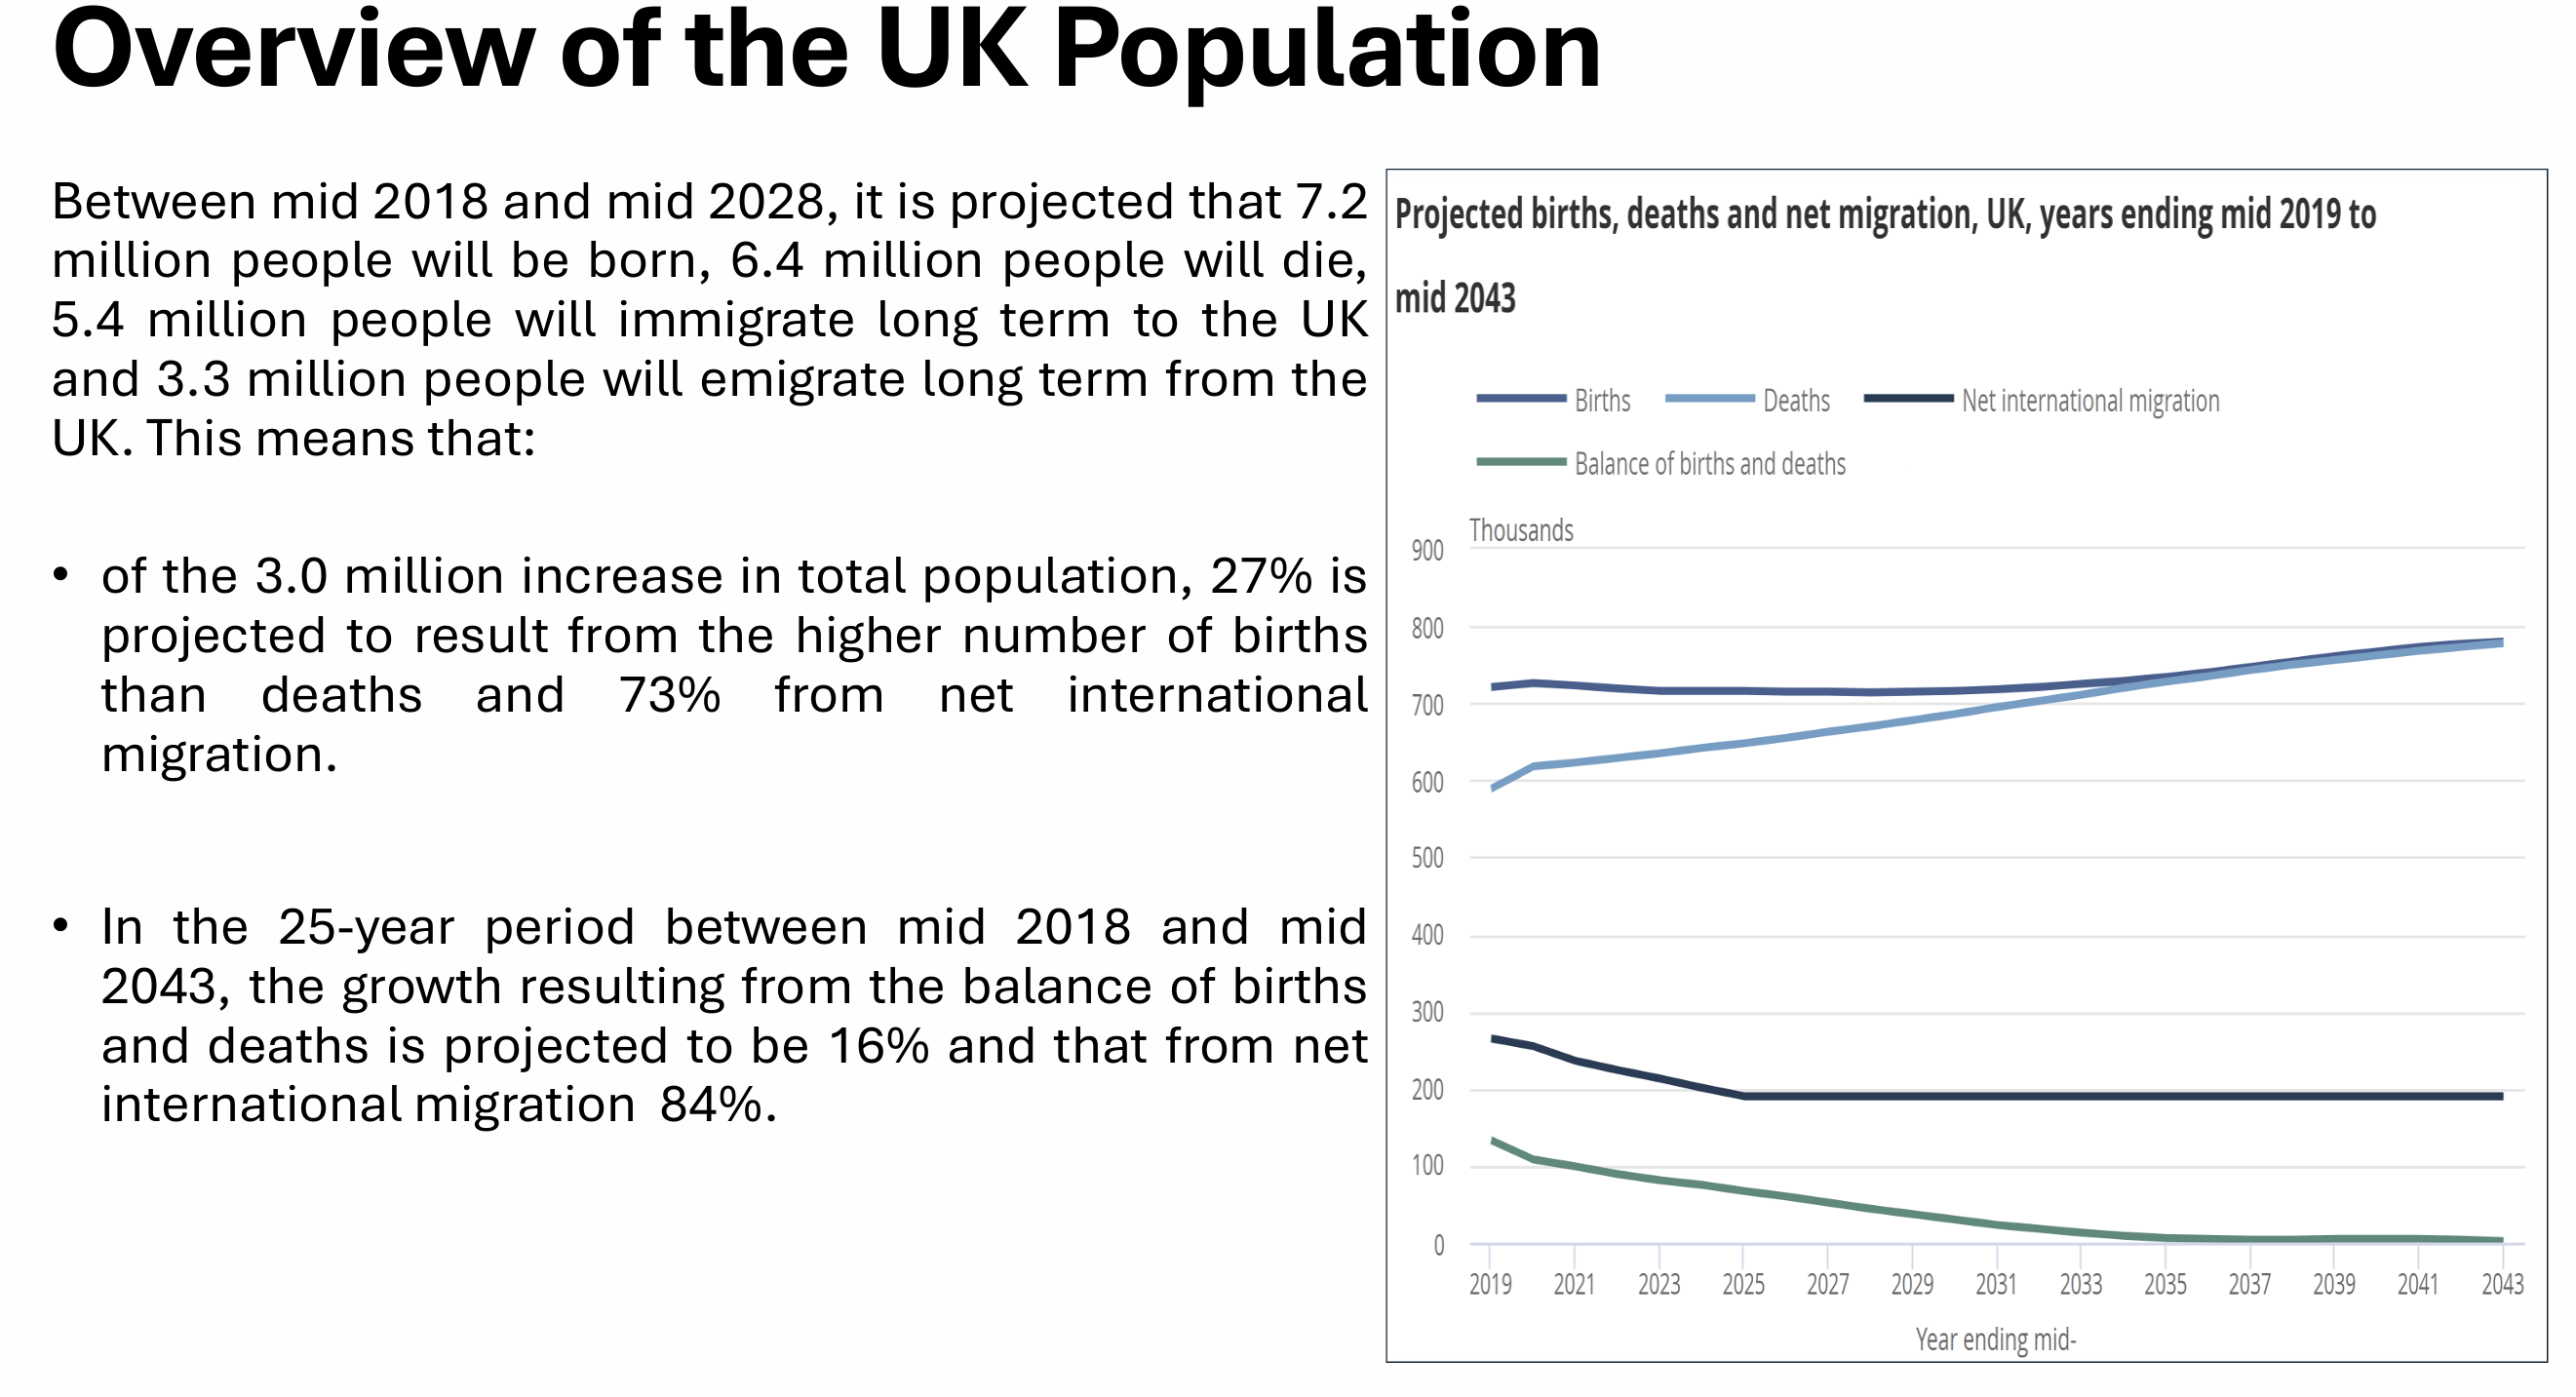
What do UK births, deaths and migration look like?
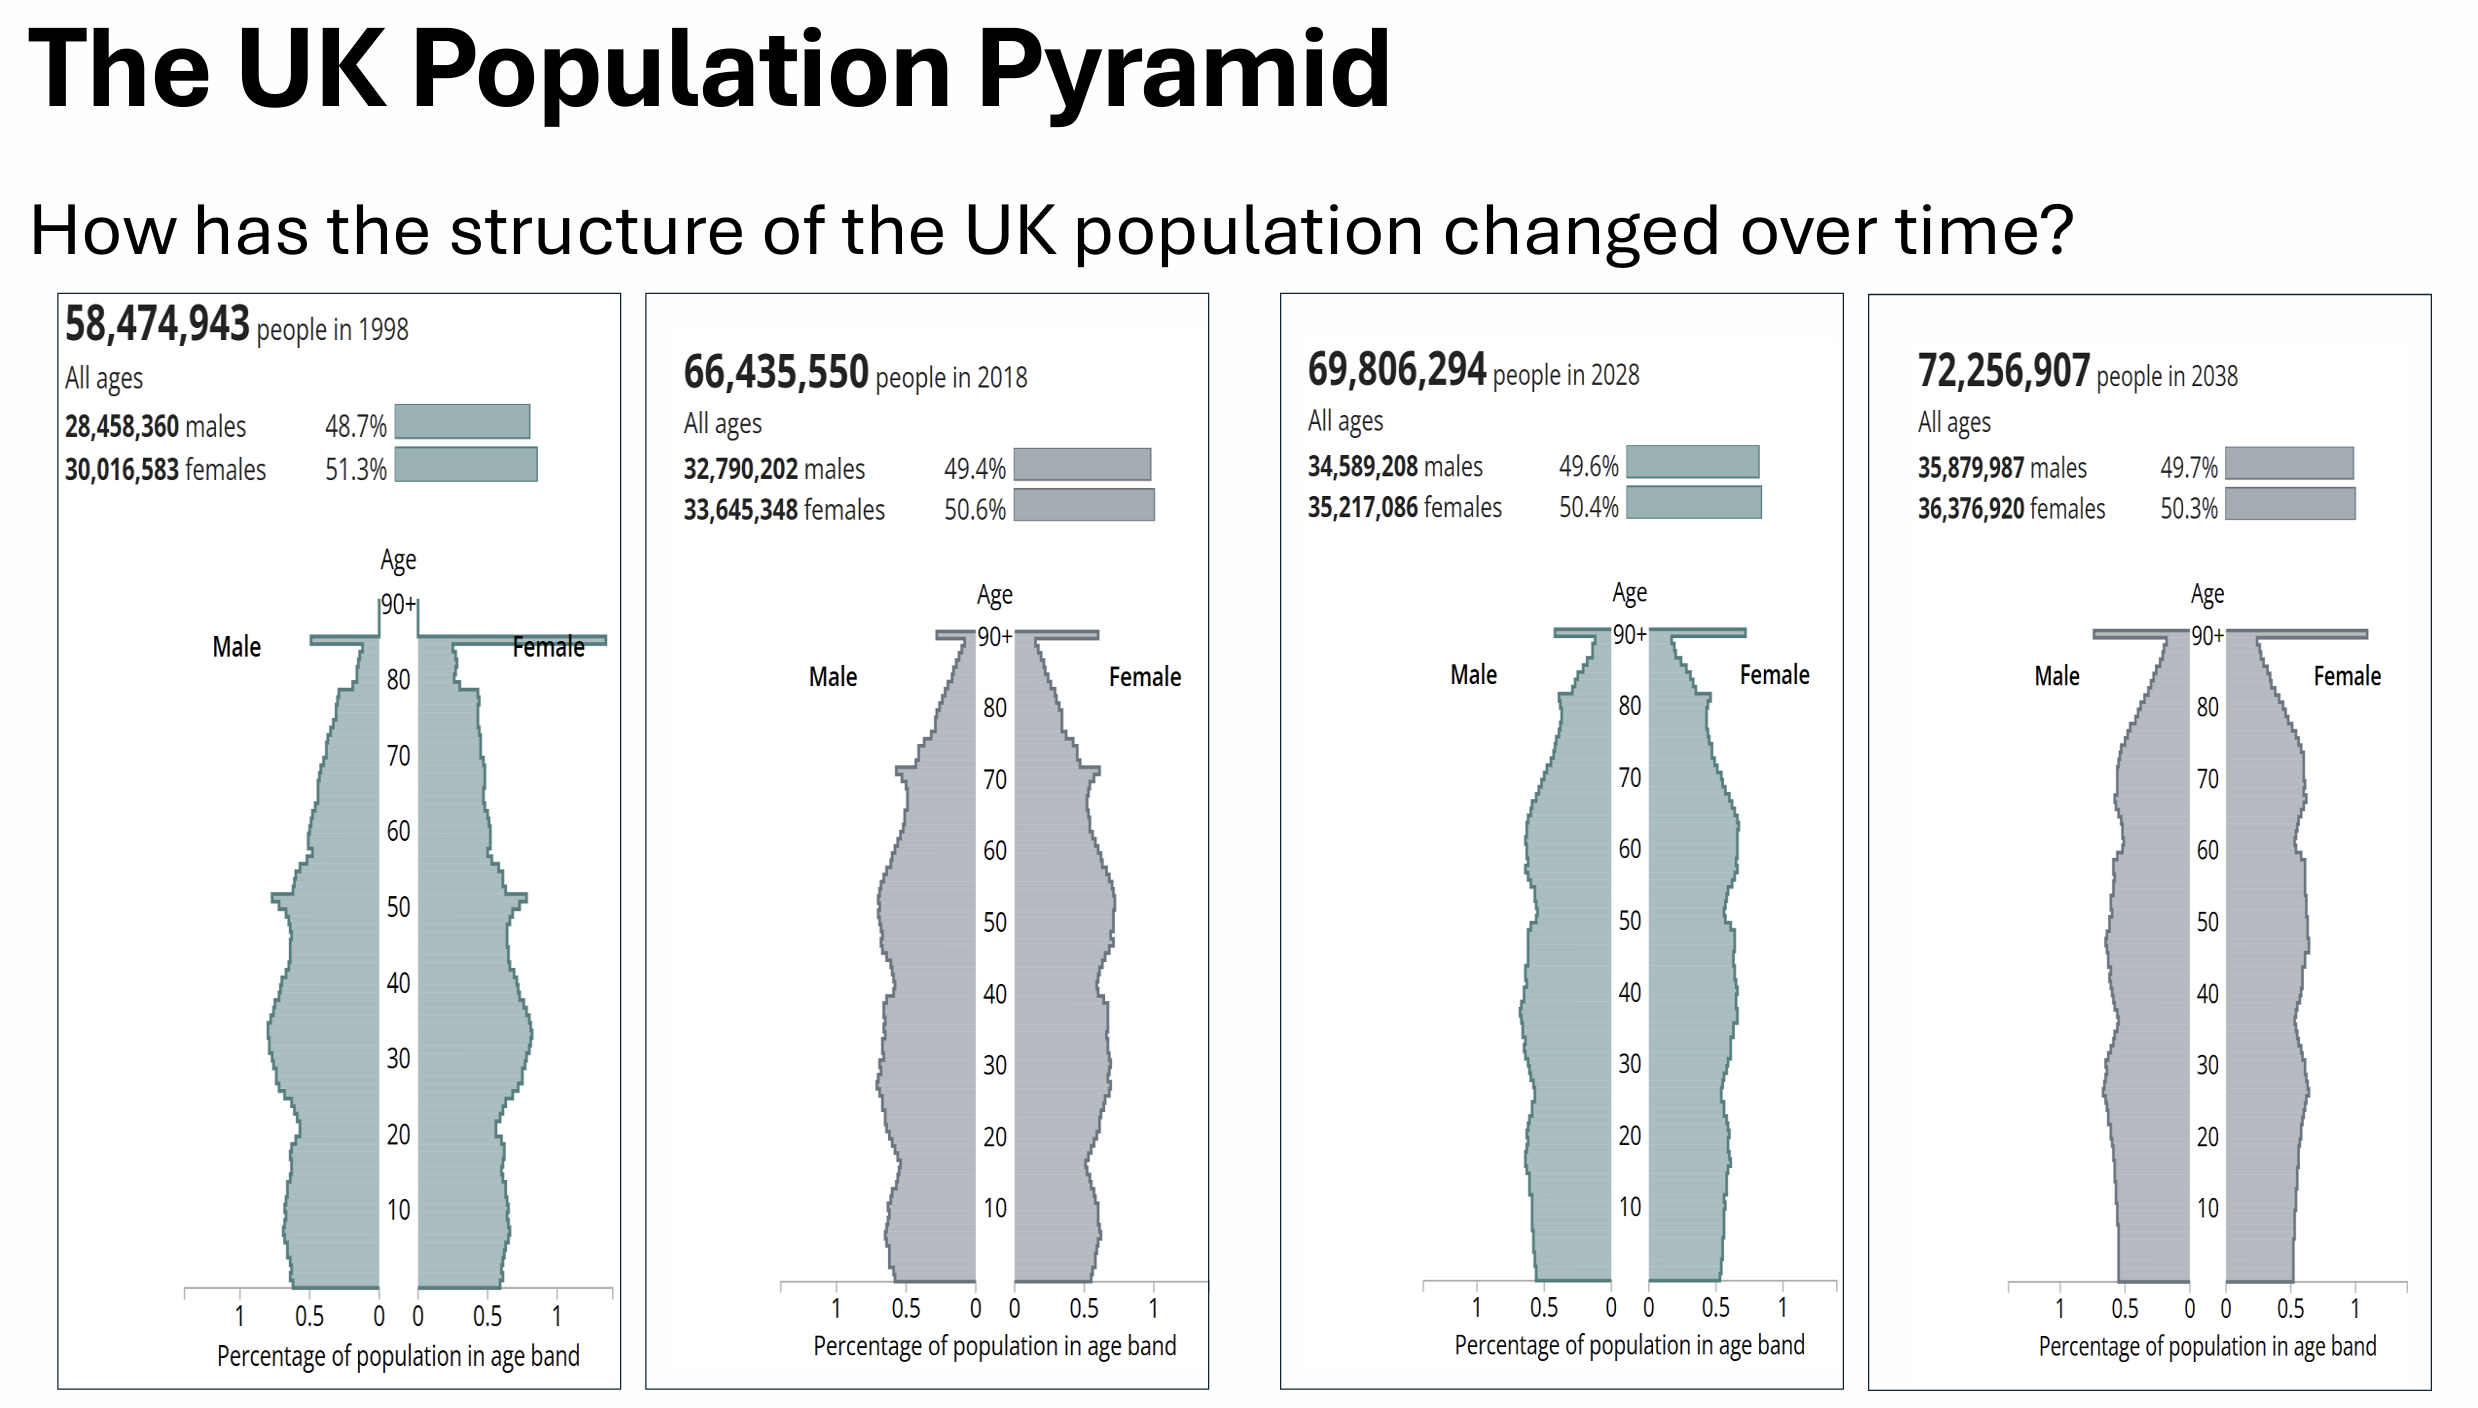
How has the structure of the UK population changed over time?
How is the structure of the UK population predicted to change between mid 2018 and mid 2043?
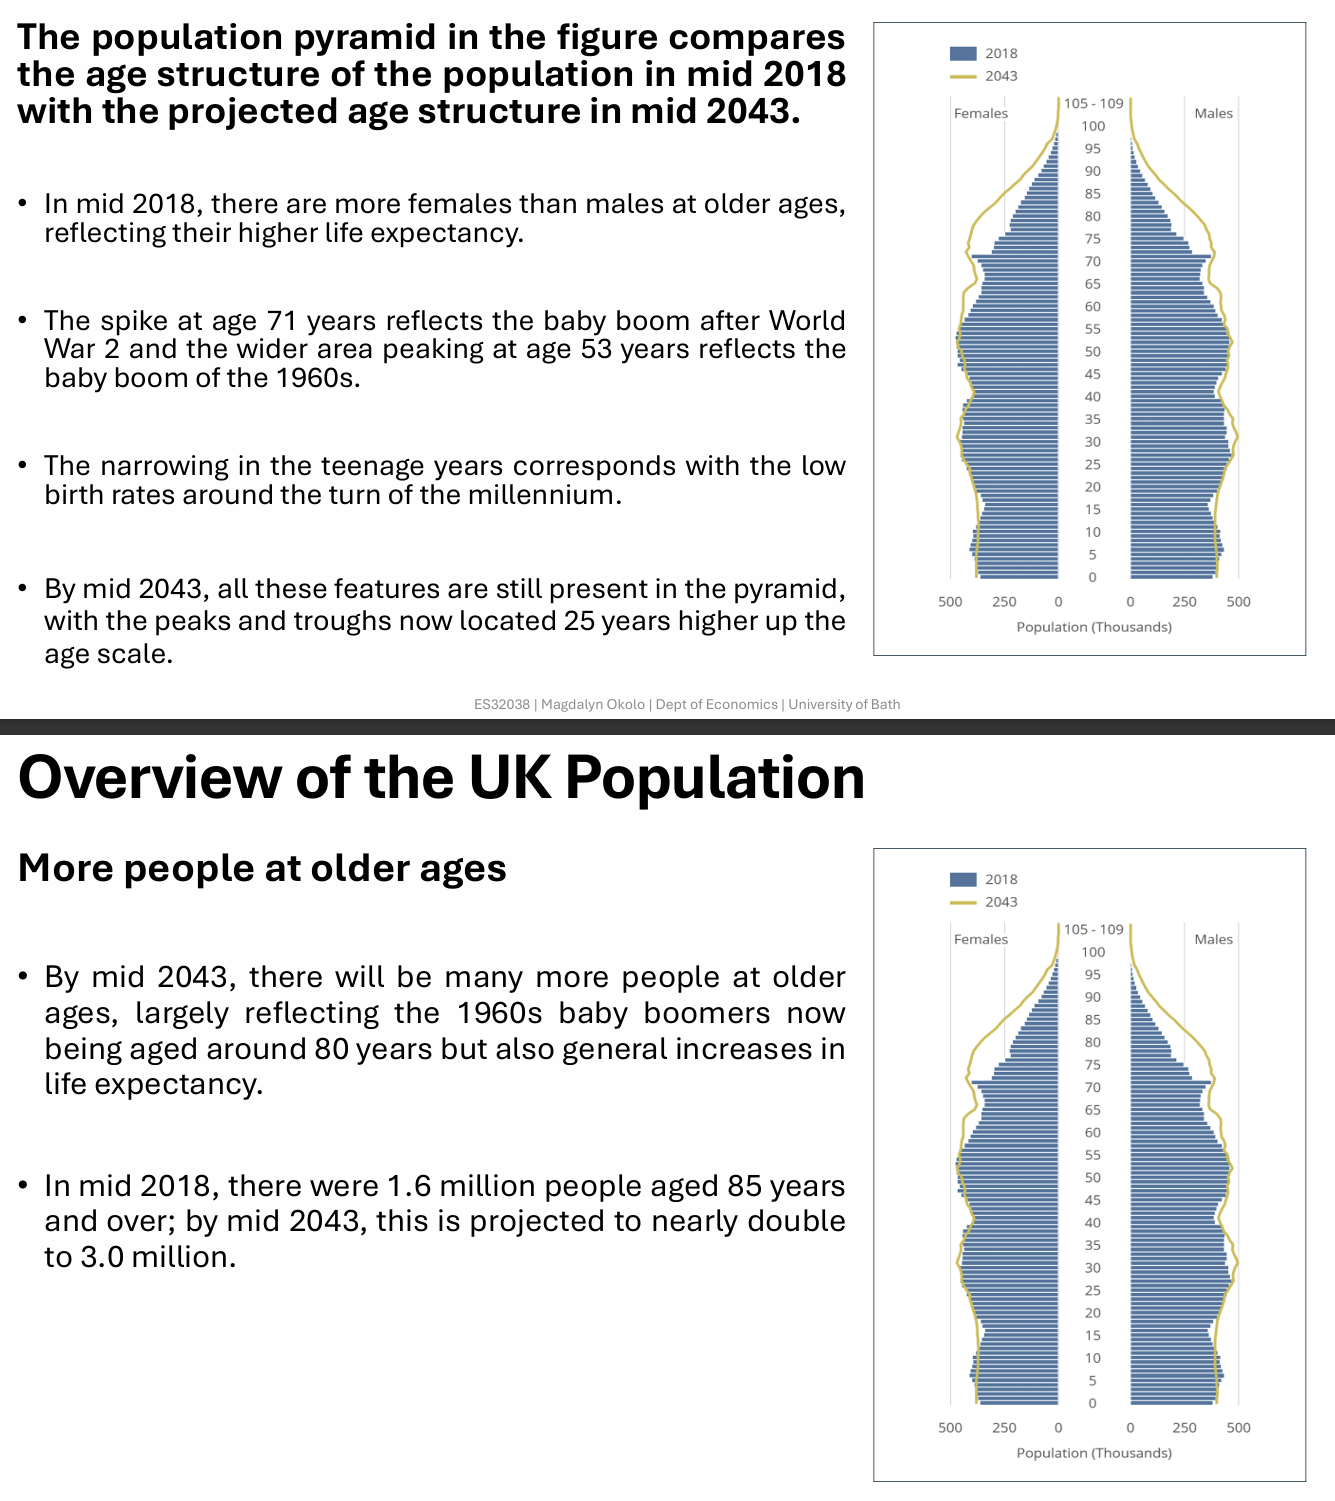
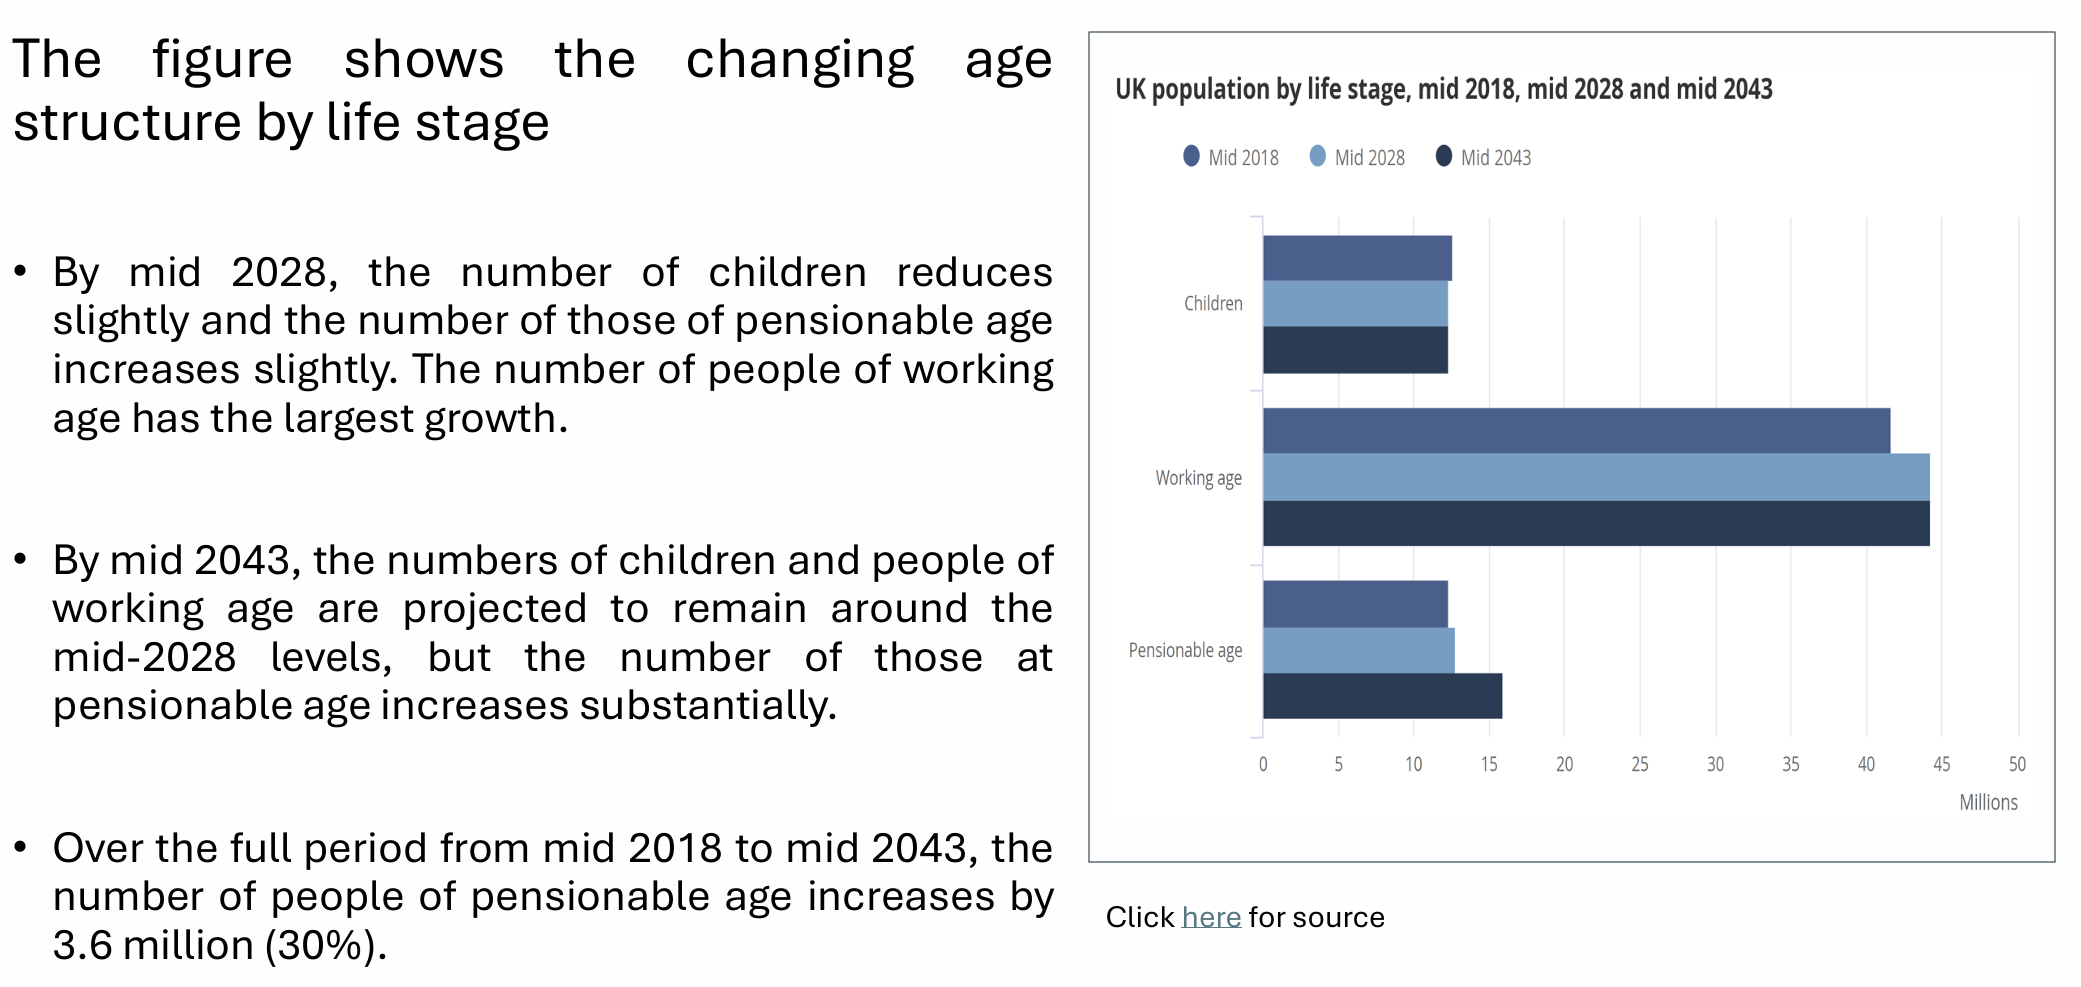
How is the UK population by life stage expected to change between mid 2018 and mid 2043?
How does the UK population compare to the rest of the world?

What is the total fertility rate?
The expected number of children per woman
What is the crude birth rate?
Births per 1,000 population per year
What is the mortality rate?
The number of deaths per 1,000 people per year
What is life expectancy?
The average number of years a person is expected to live, given current age-specific mortality rates
What do the Global and UK Fertility and Mortality Rates suggest?
These imply that the age structure in a population is determined by the patterns of fertility and mortality, and the mortality and fertility rates have decreased globally and in the UK over the past 50 years
Immigration may offset the effects of a country’s ageing population since immigrants tend to be of younger, working ages. But studies suggest that this only short-term
What is period life expectancy?
The life expectancy of the individual if they faced the same age-specific death rates for their whole life
What is cohort life expectancy?
Follows a birth cohort (everyone born in a given year) and uses their death rates over time, including expected future improvements in mortality, to estimate how long that cohort will actually live on average
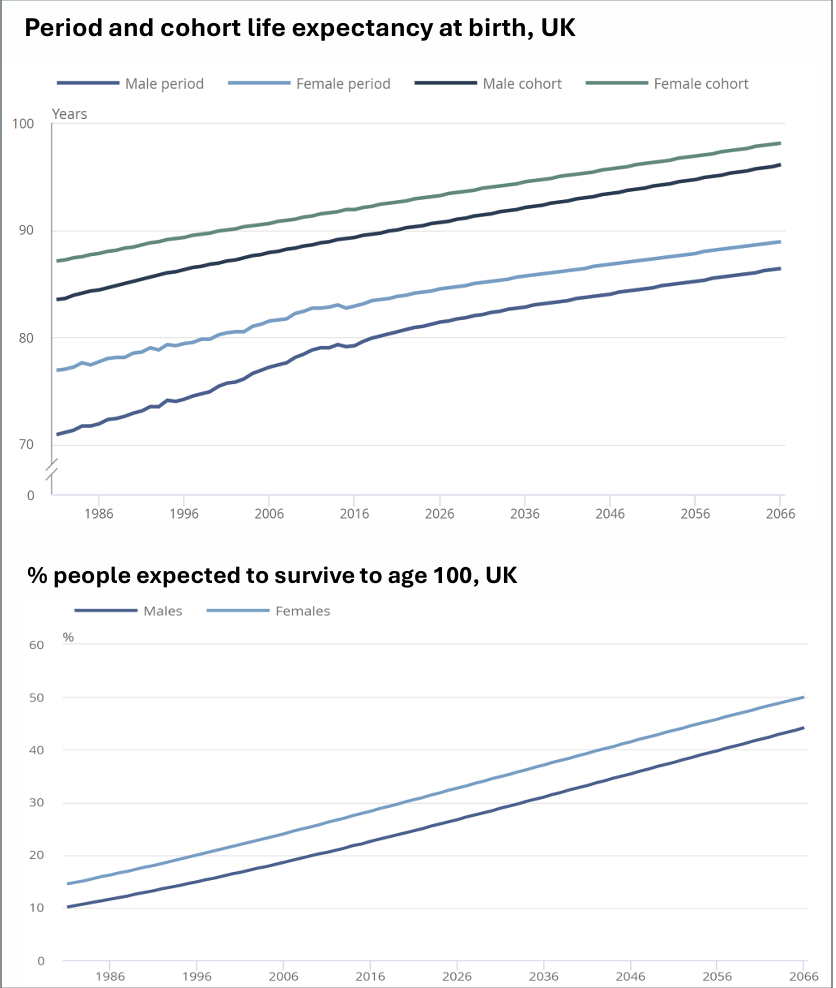
What do we know about Period and cohort life expectancy at birth and % people expected to survive to age 100 in the UK?
The difference between the period and cohort life expectancies shows that most people will actually live longer than the period life expectancy published at their birth, because mortality is expected to keep improving after that base year.
And clearly, the number of people expected to survive to age 100 in the UK is increasing steadily
What does an ageing population mean for the UK economy?

How can the UK Mitigate the Economic Impact of an Ageing Population?

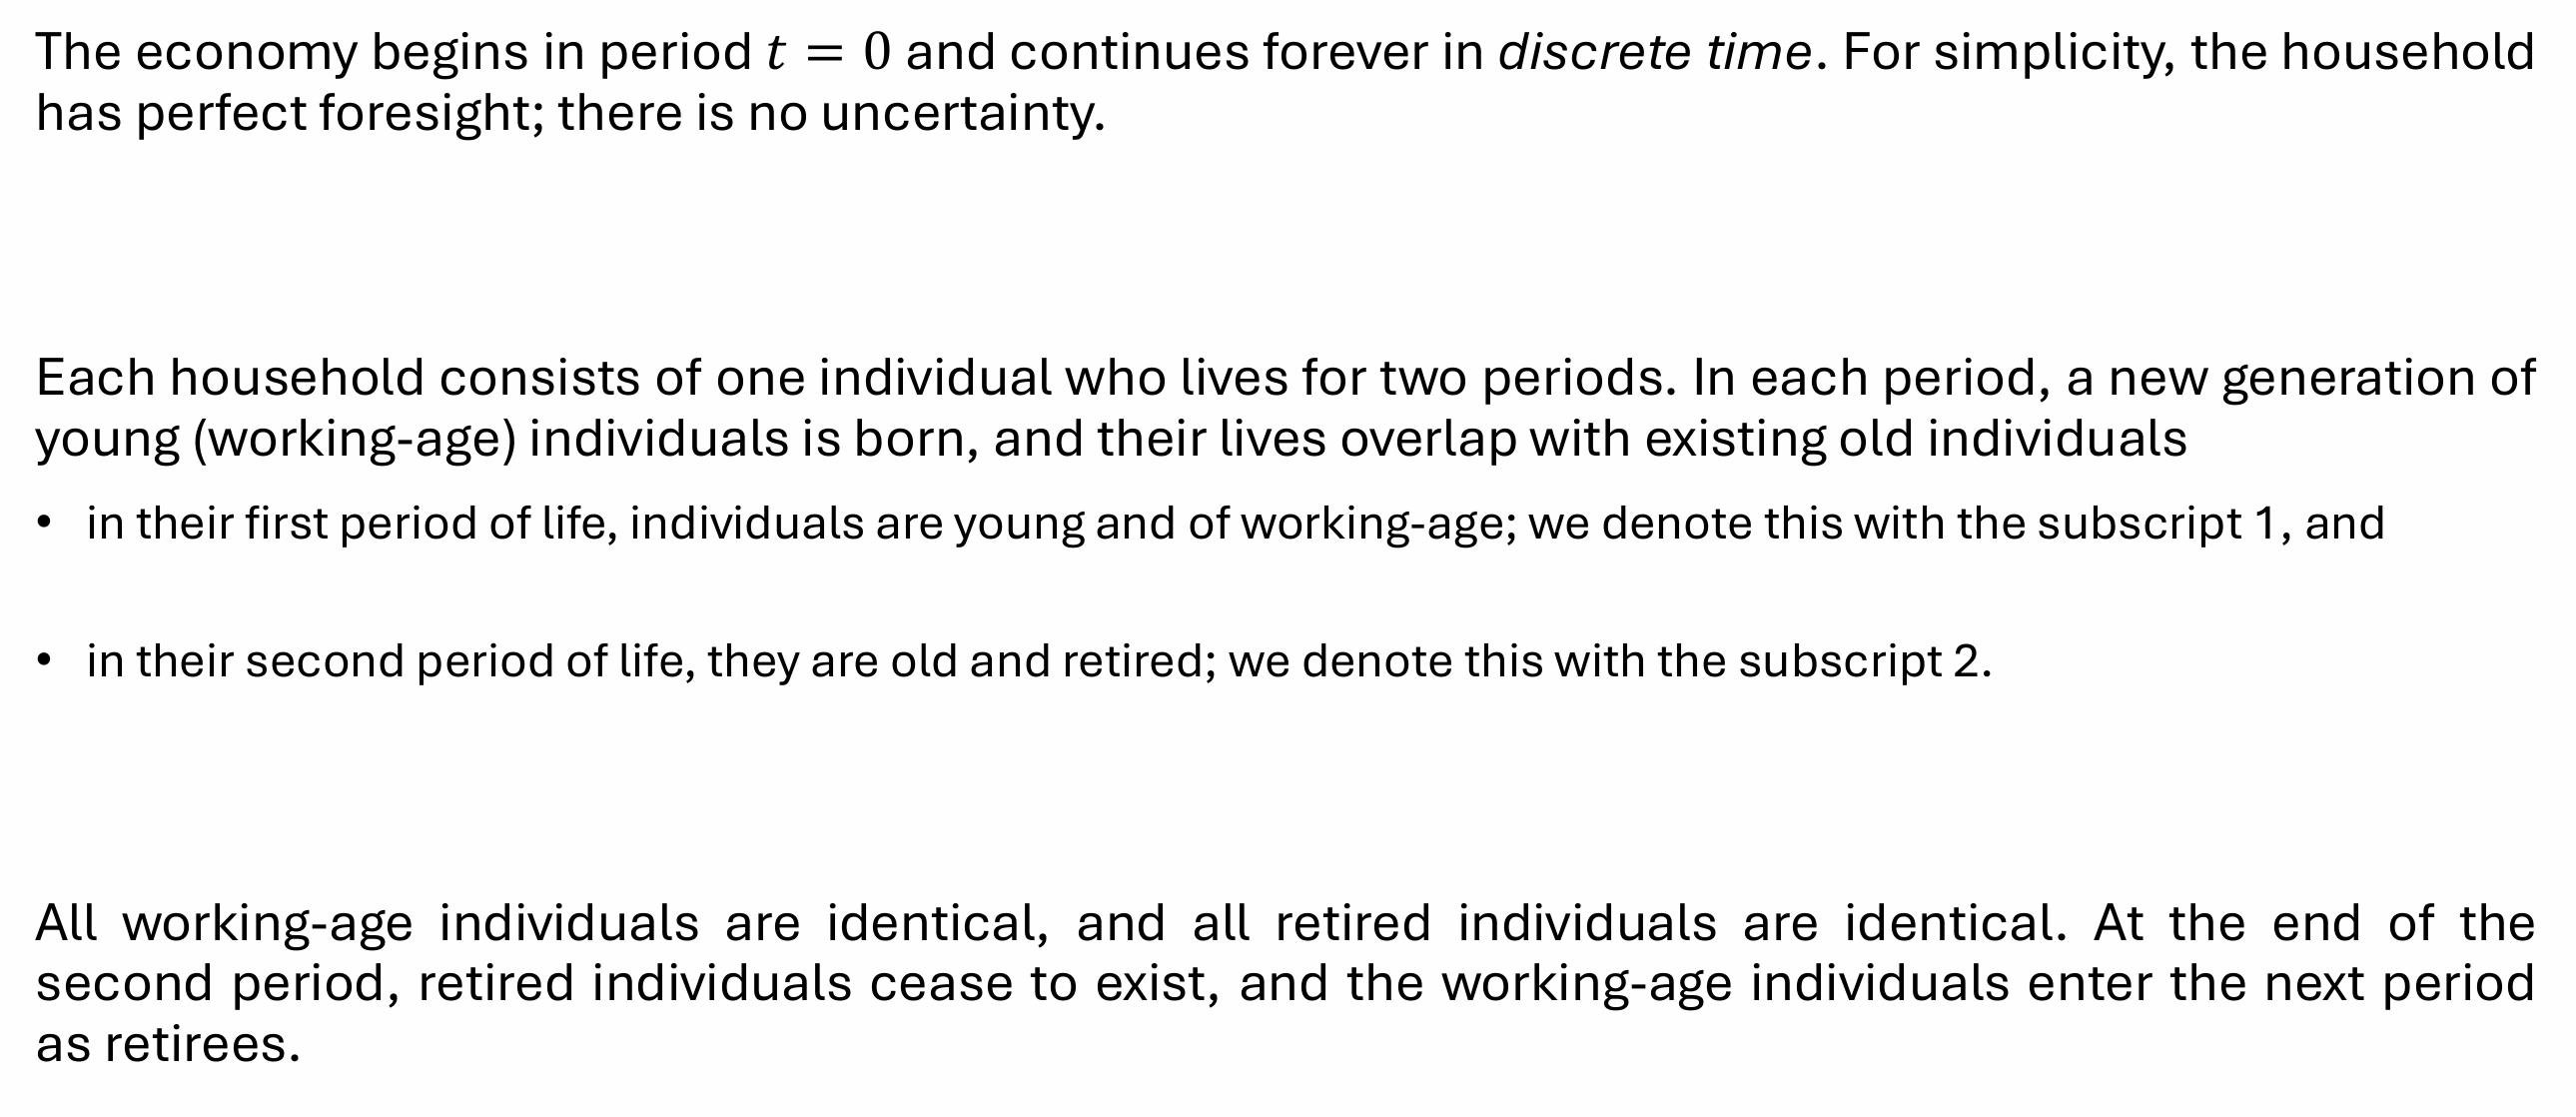
What do we assume about the household and its workers in the Canonical OLG model?
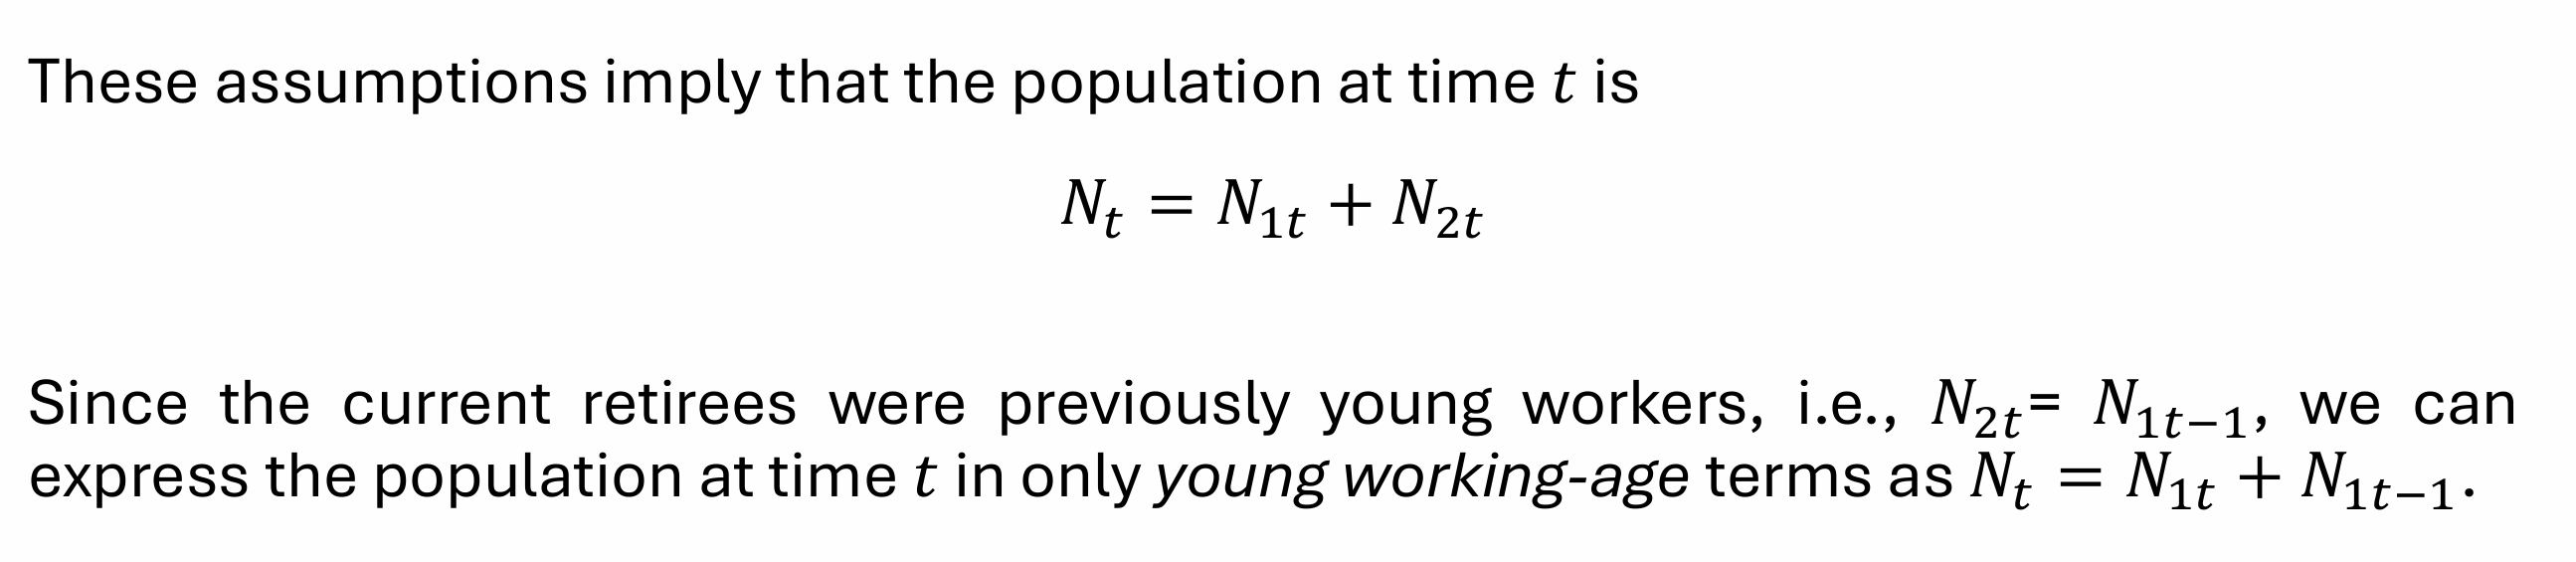
What is the population at time t (and in terms of just young workers)?
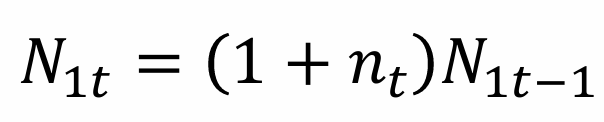
What is the growth rate of the workforce?
nt
Assuming the workforce grows at the rate of nt, what is N1t?
Since all the old will cease to exist at the end of any given period, population growth can only come from the entry of more working-age individuals in each successive period.
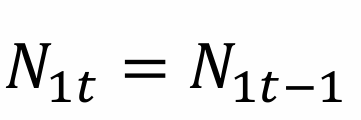
In the absence of population growth, what happens to the number of young workers?
What do we assume each worker earns and supplies due to no search frictions and no unemployment?

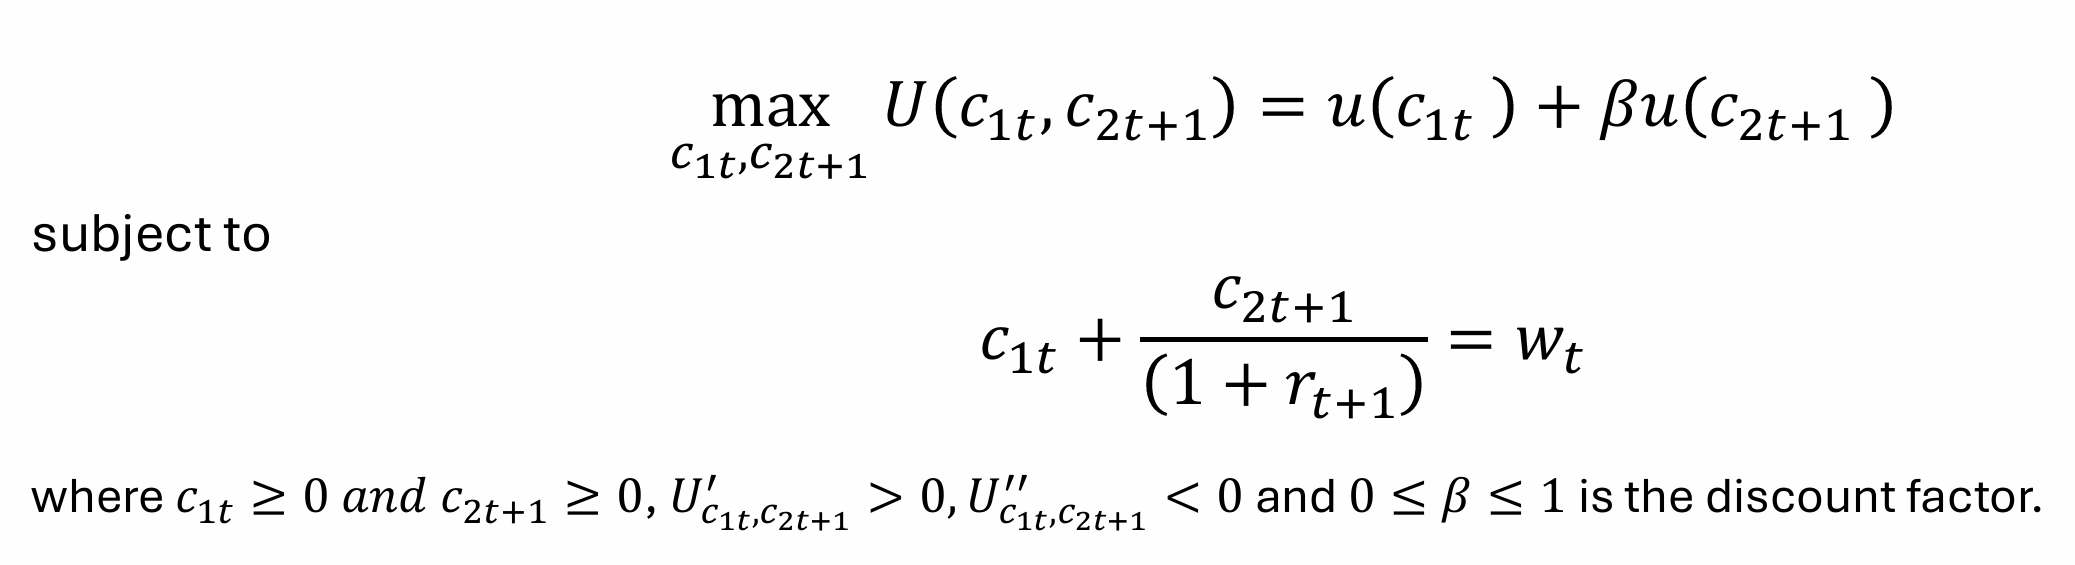
What is the wage spent on and how do they derive utility?
The wage earned is spent on non-durable goods cit, from which they derive utility, U(c1t), and save the remainder for their retirement
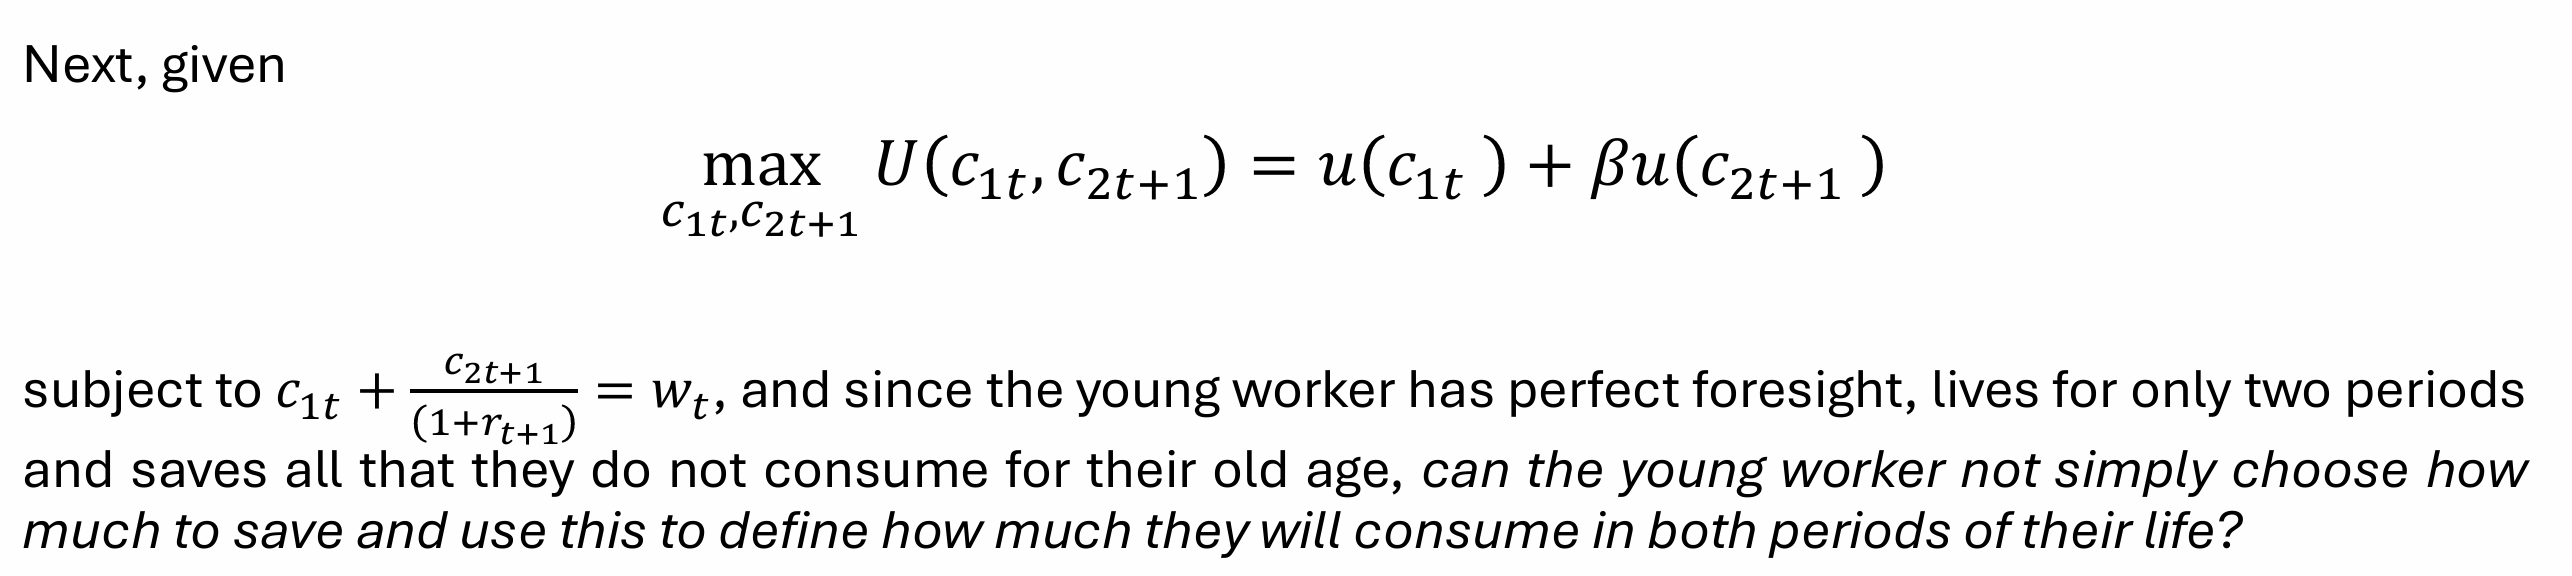
What is the budget constraint for a young person in any period?
wt = c1t + st
What happens when individuals get old?
The working-age individuals get old and retire, they do not work; so, they remain part of the population, but not a part of the workforce
What do old individuals do instead of work?
They spend their savings and all interests 0 < rt+1 < 1 accrued on them, on non-durable goods 𝑐2t+1, from which they derive utility U(c2t+1), leaving no resources unused by the end of their lifetime
What is the budget constraint when old?
(1+rt+1)st = c2t+1


What does this tell us?

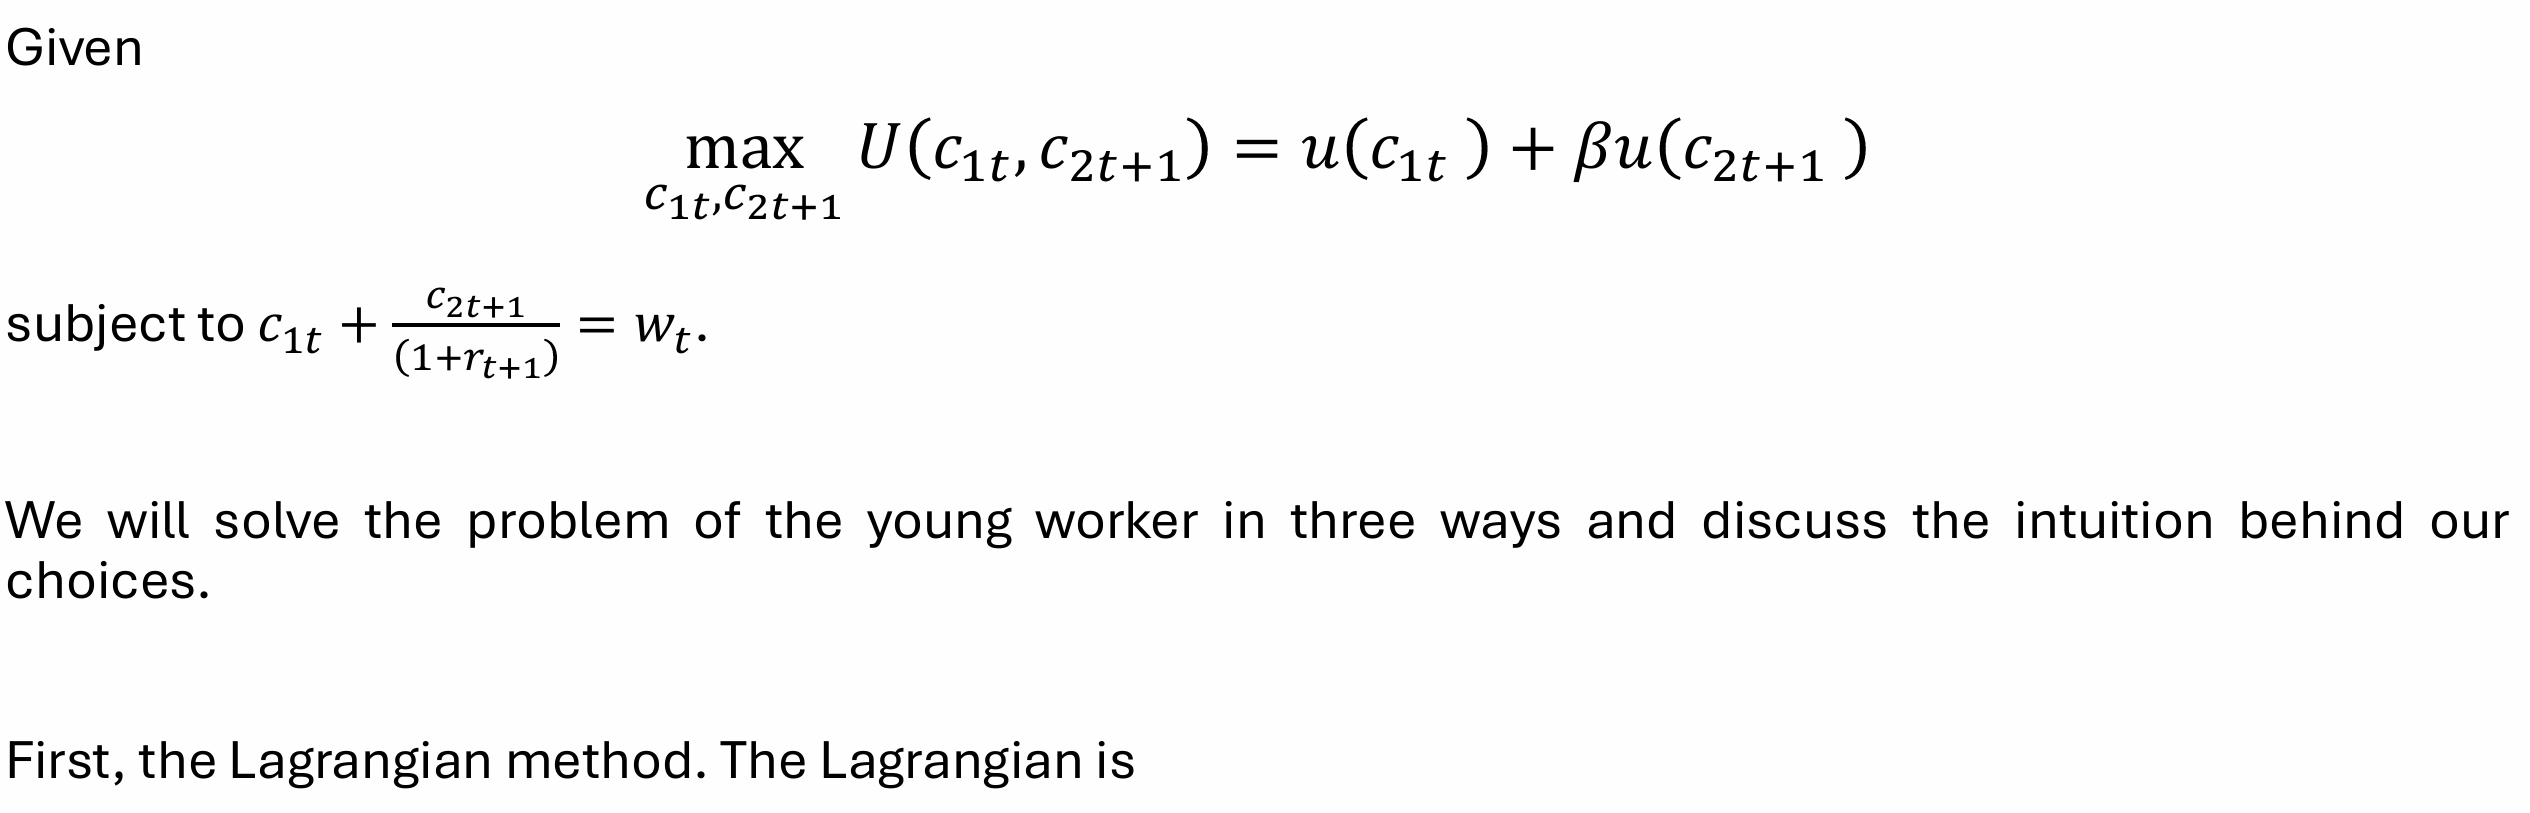


Obtain the Euler equation
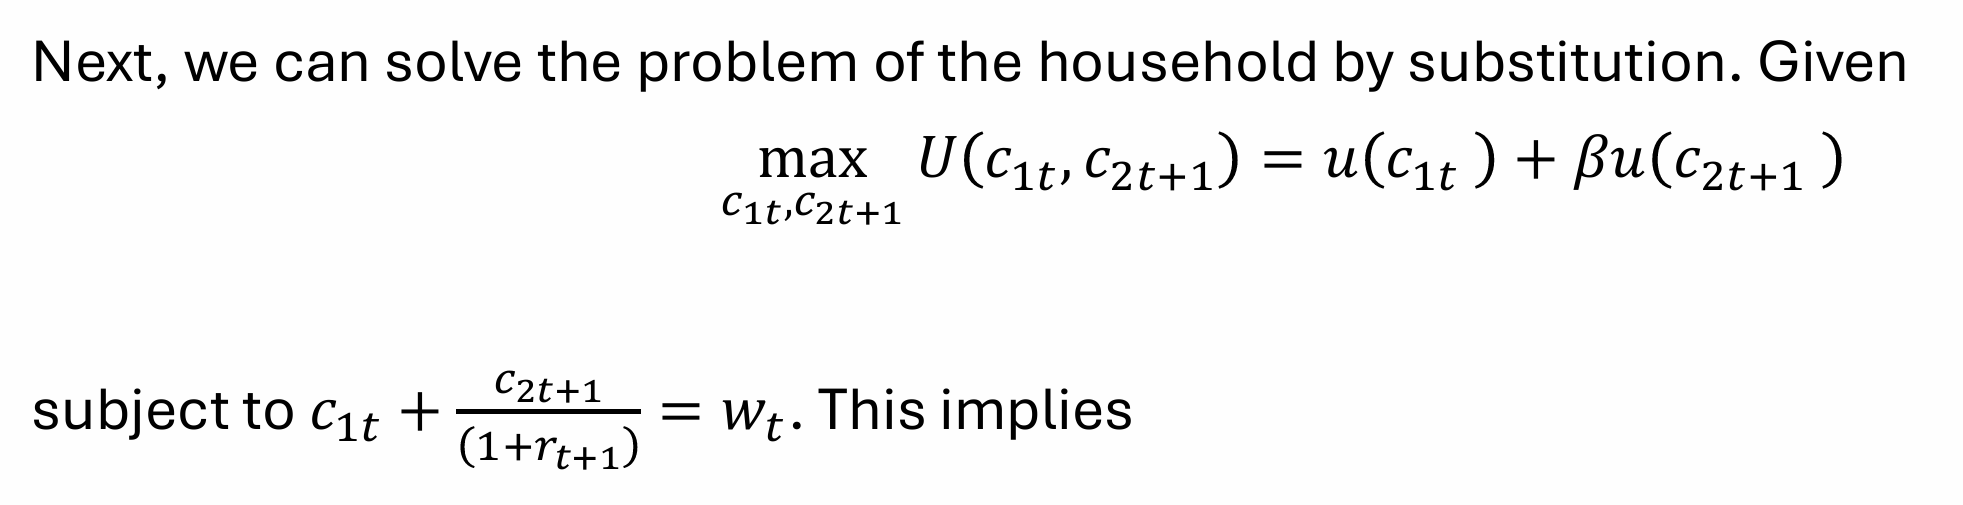

What does this tell us?
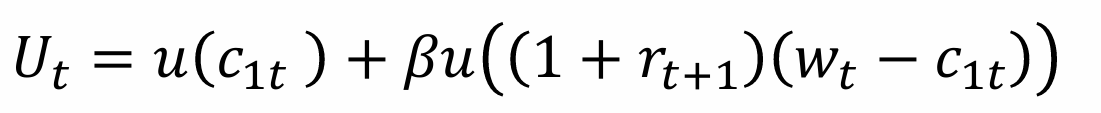
Since the young worker has perfect foresight, lives for only two periods and saves all that they do not consume for their old age, choosing the amount of consumption when they are young defines their savings, and in turn, their consumption when they are old

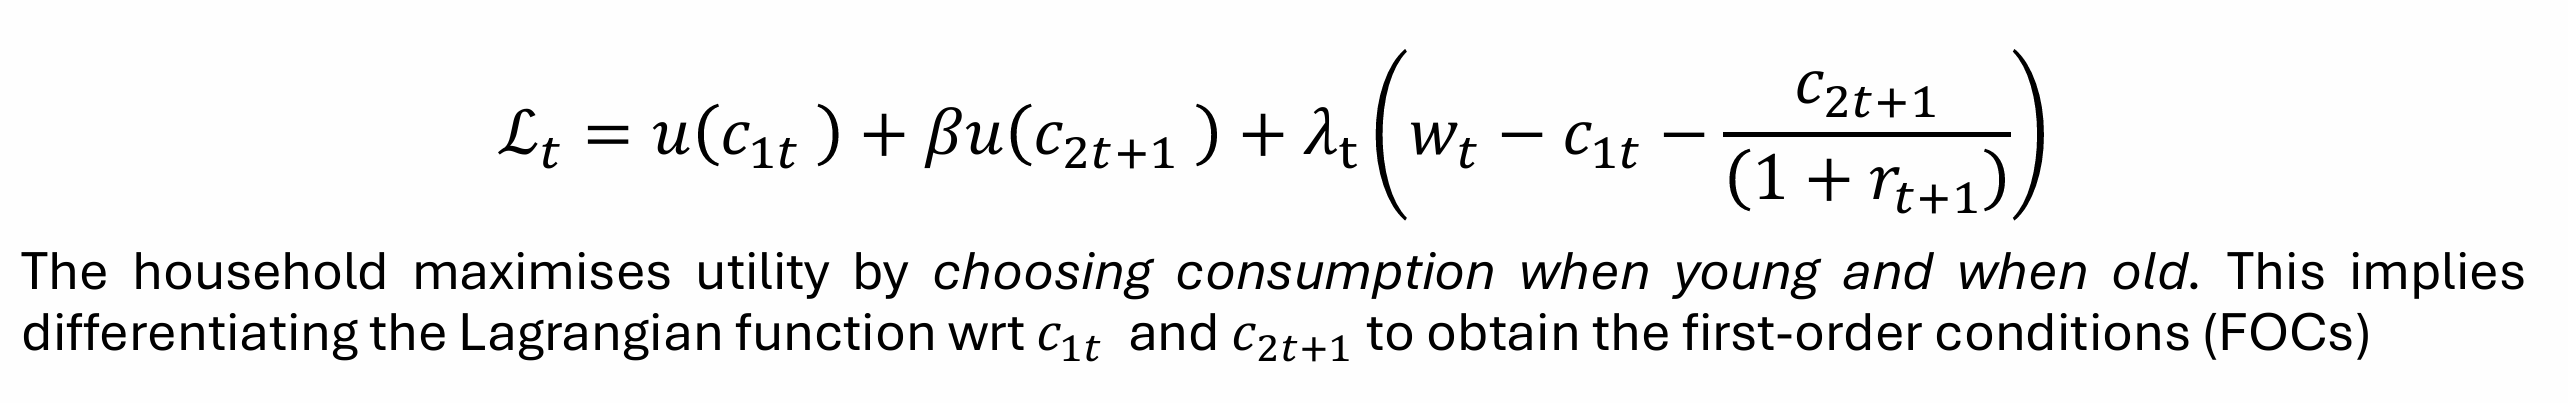
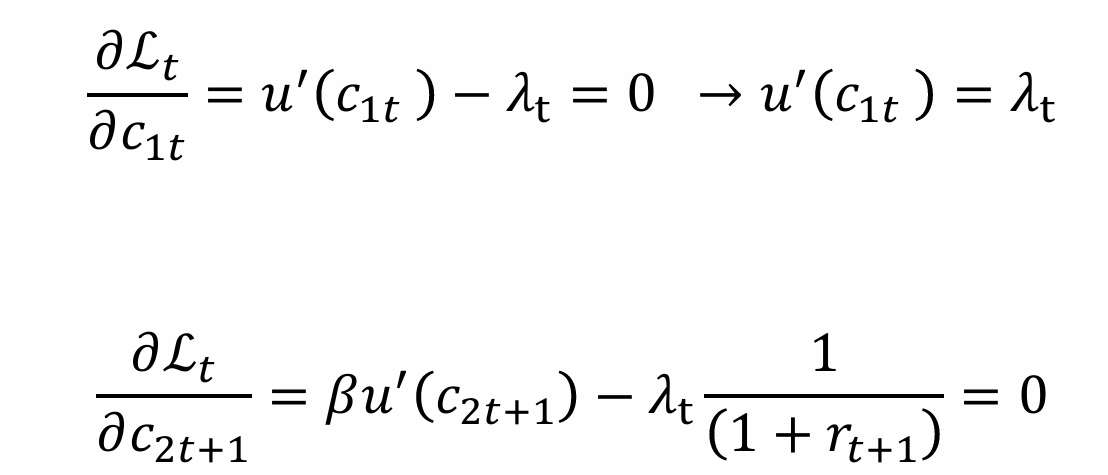
So, the individual chooses only consumption when young (we differentiate wrt c1t) to obtain

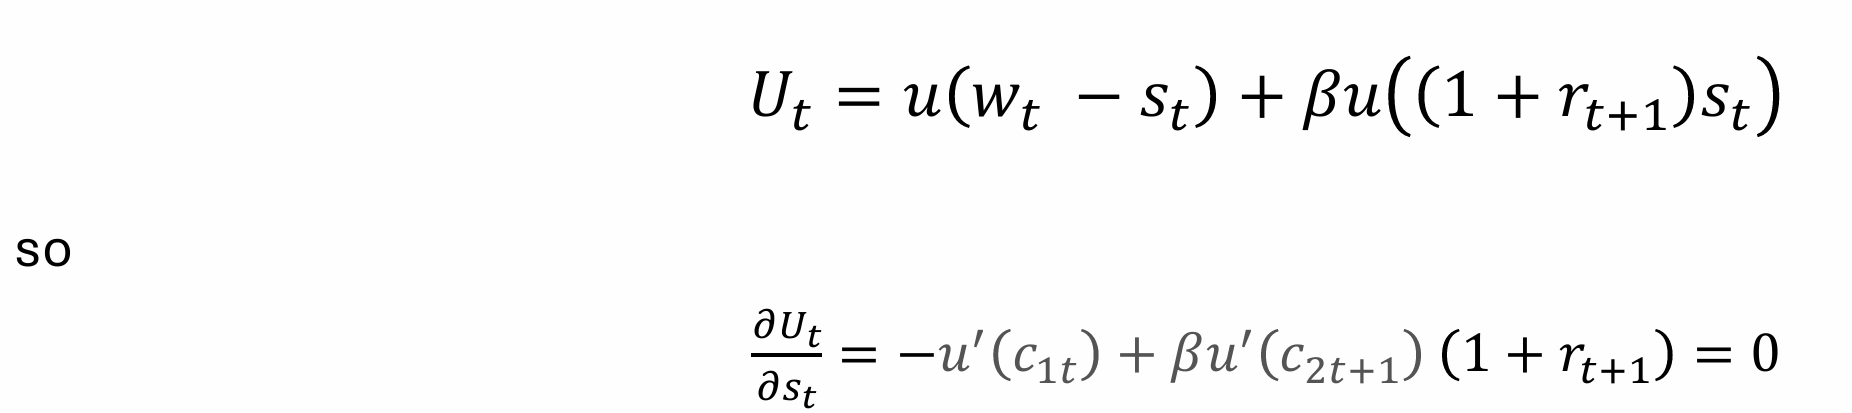
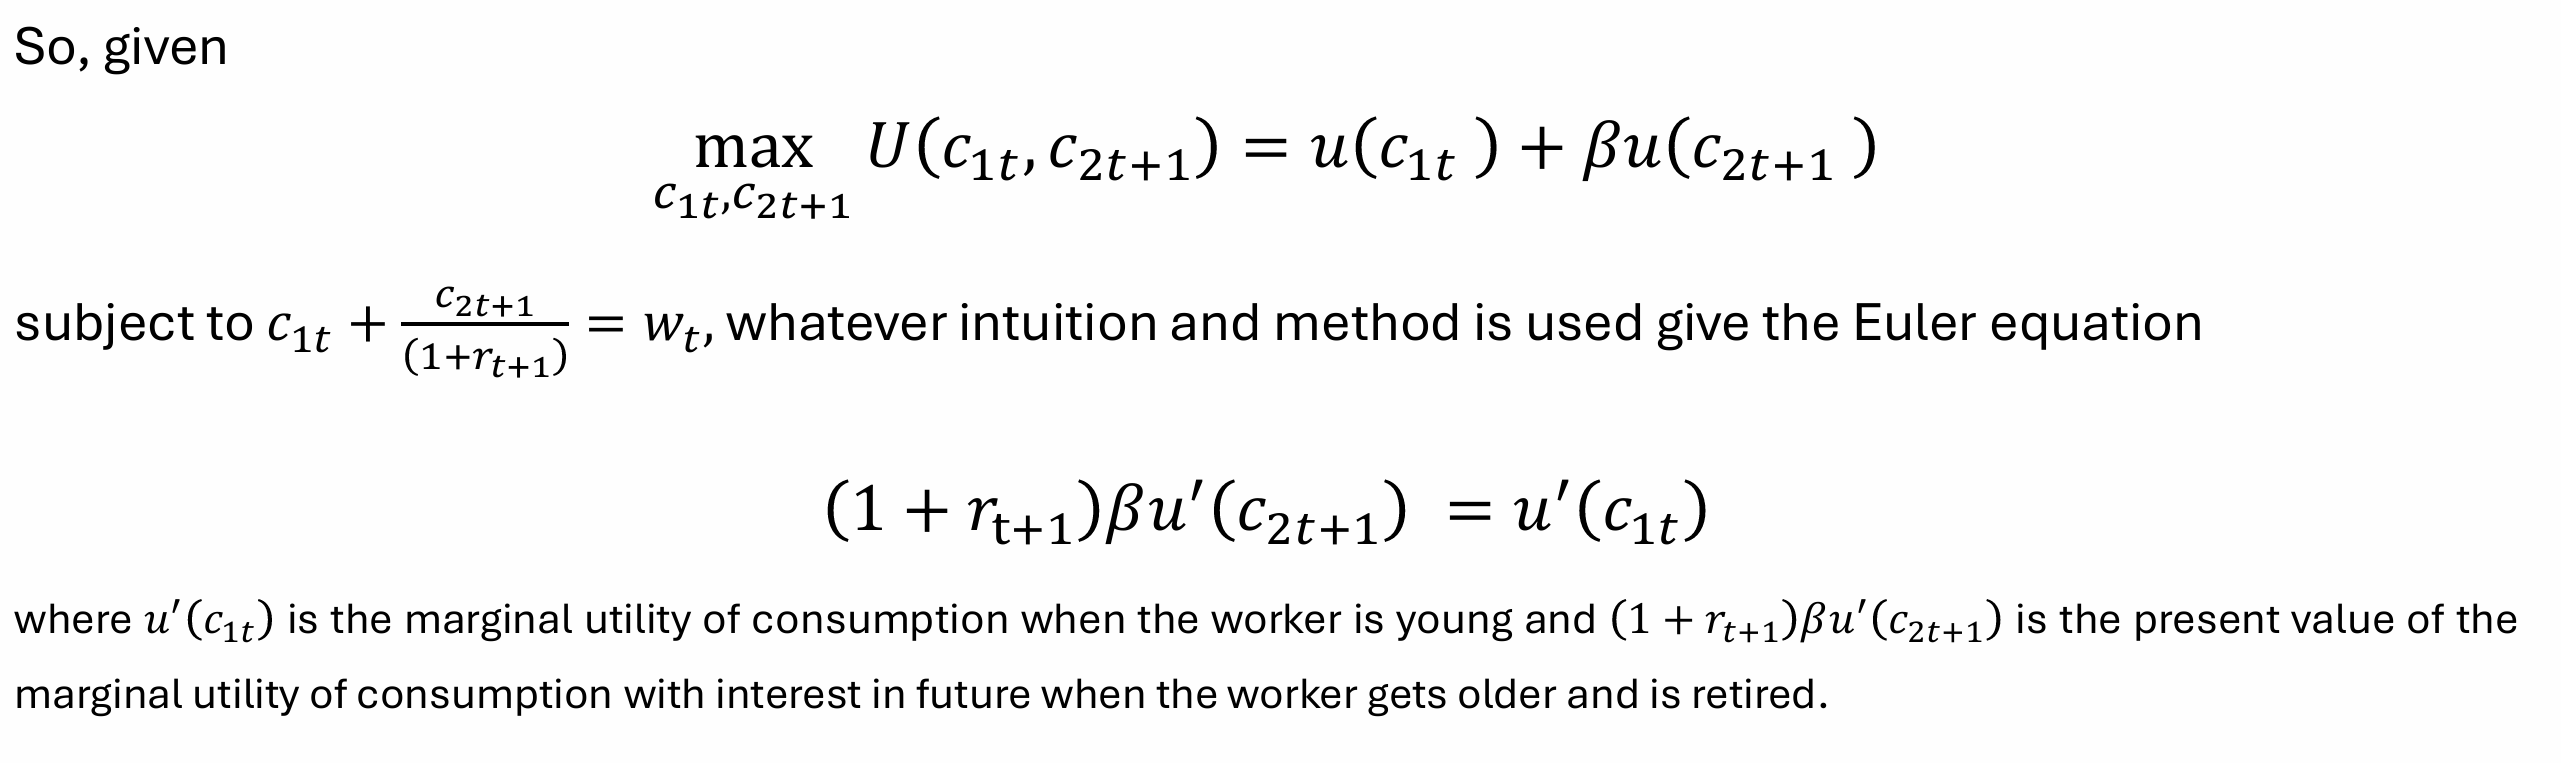
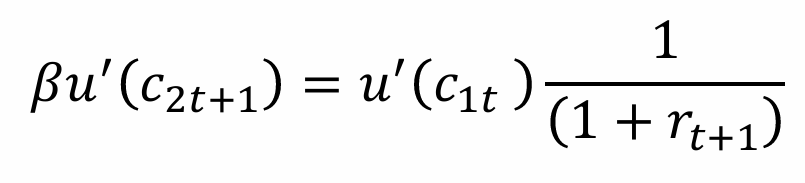
What does the Euler equation tell us?
The Euler equation is the optimality condition for the individual; it is the optimal consumption/saving plan of the individual because they are indifferent between consuming an additional unit when young or consuming it with interest in the future when old
It does not show the optimal amounts of consumption and saving
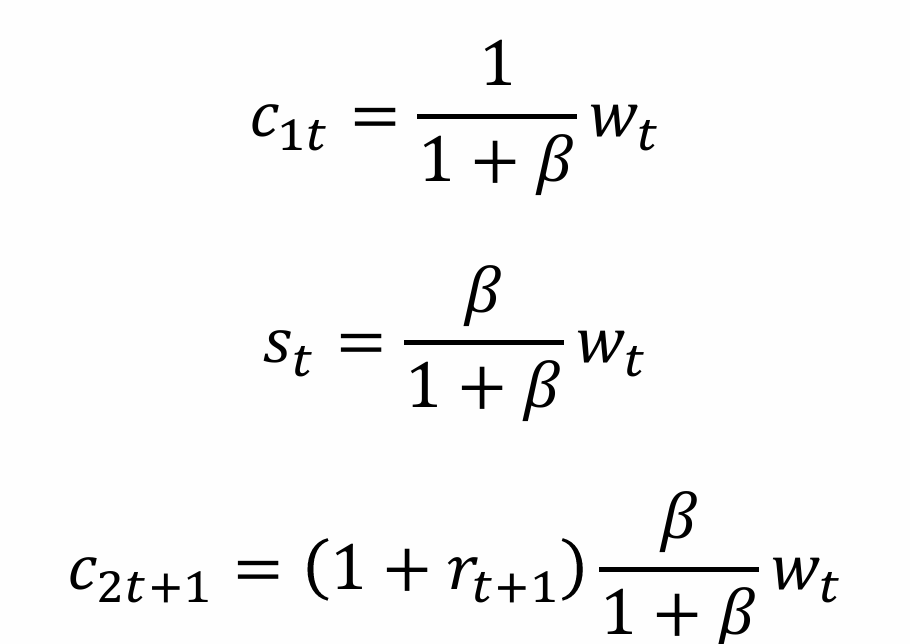
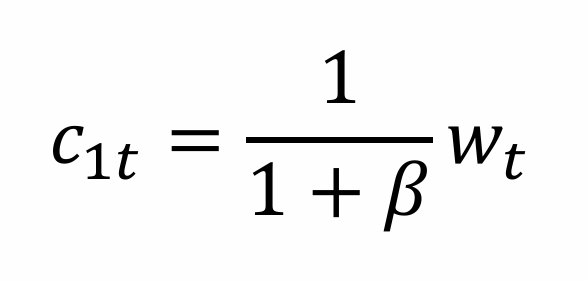
What does the consumption when young tell us?
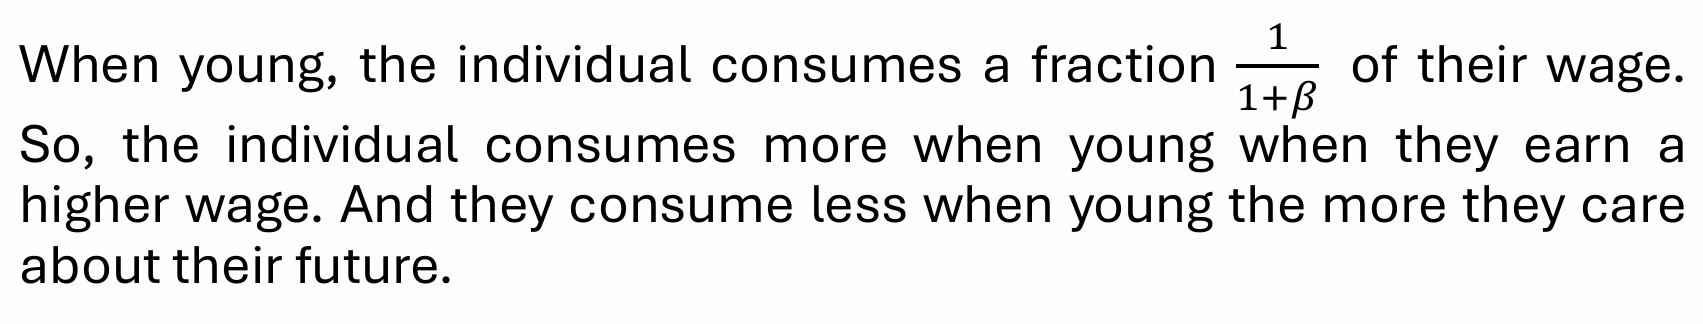
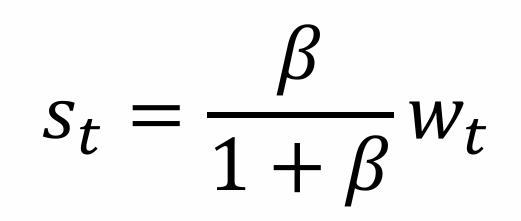
What does the level of savings tell us?


What does the consumption when old tell us?
The individual will have more to consume when old if they have a high wage when they are young and depending on how equally they value their young and old age

What does the individual do when the interest rate changes?
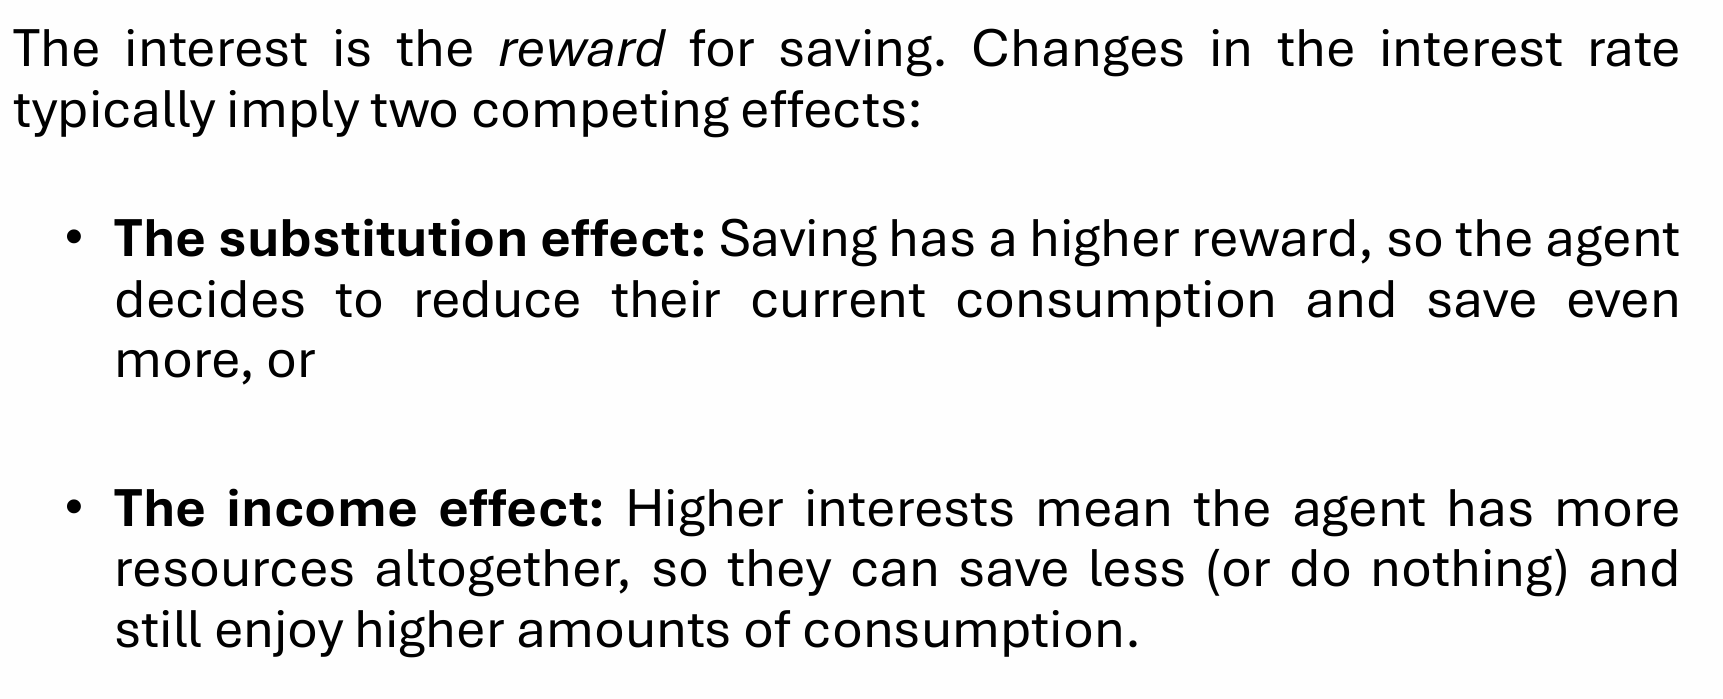
Which effect dominates?
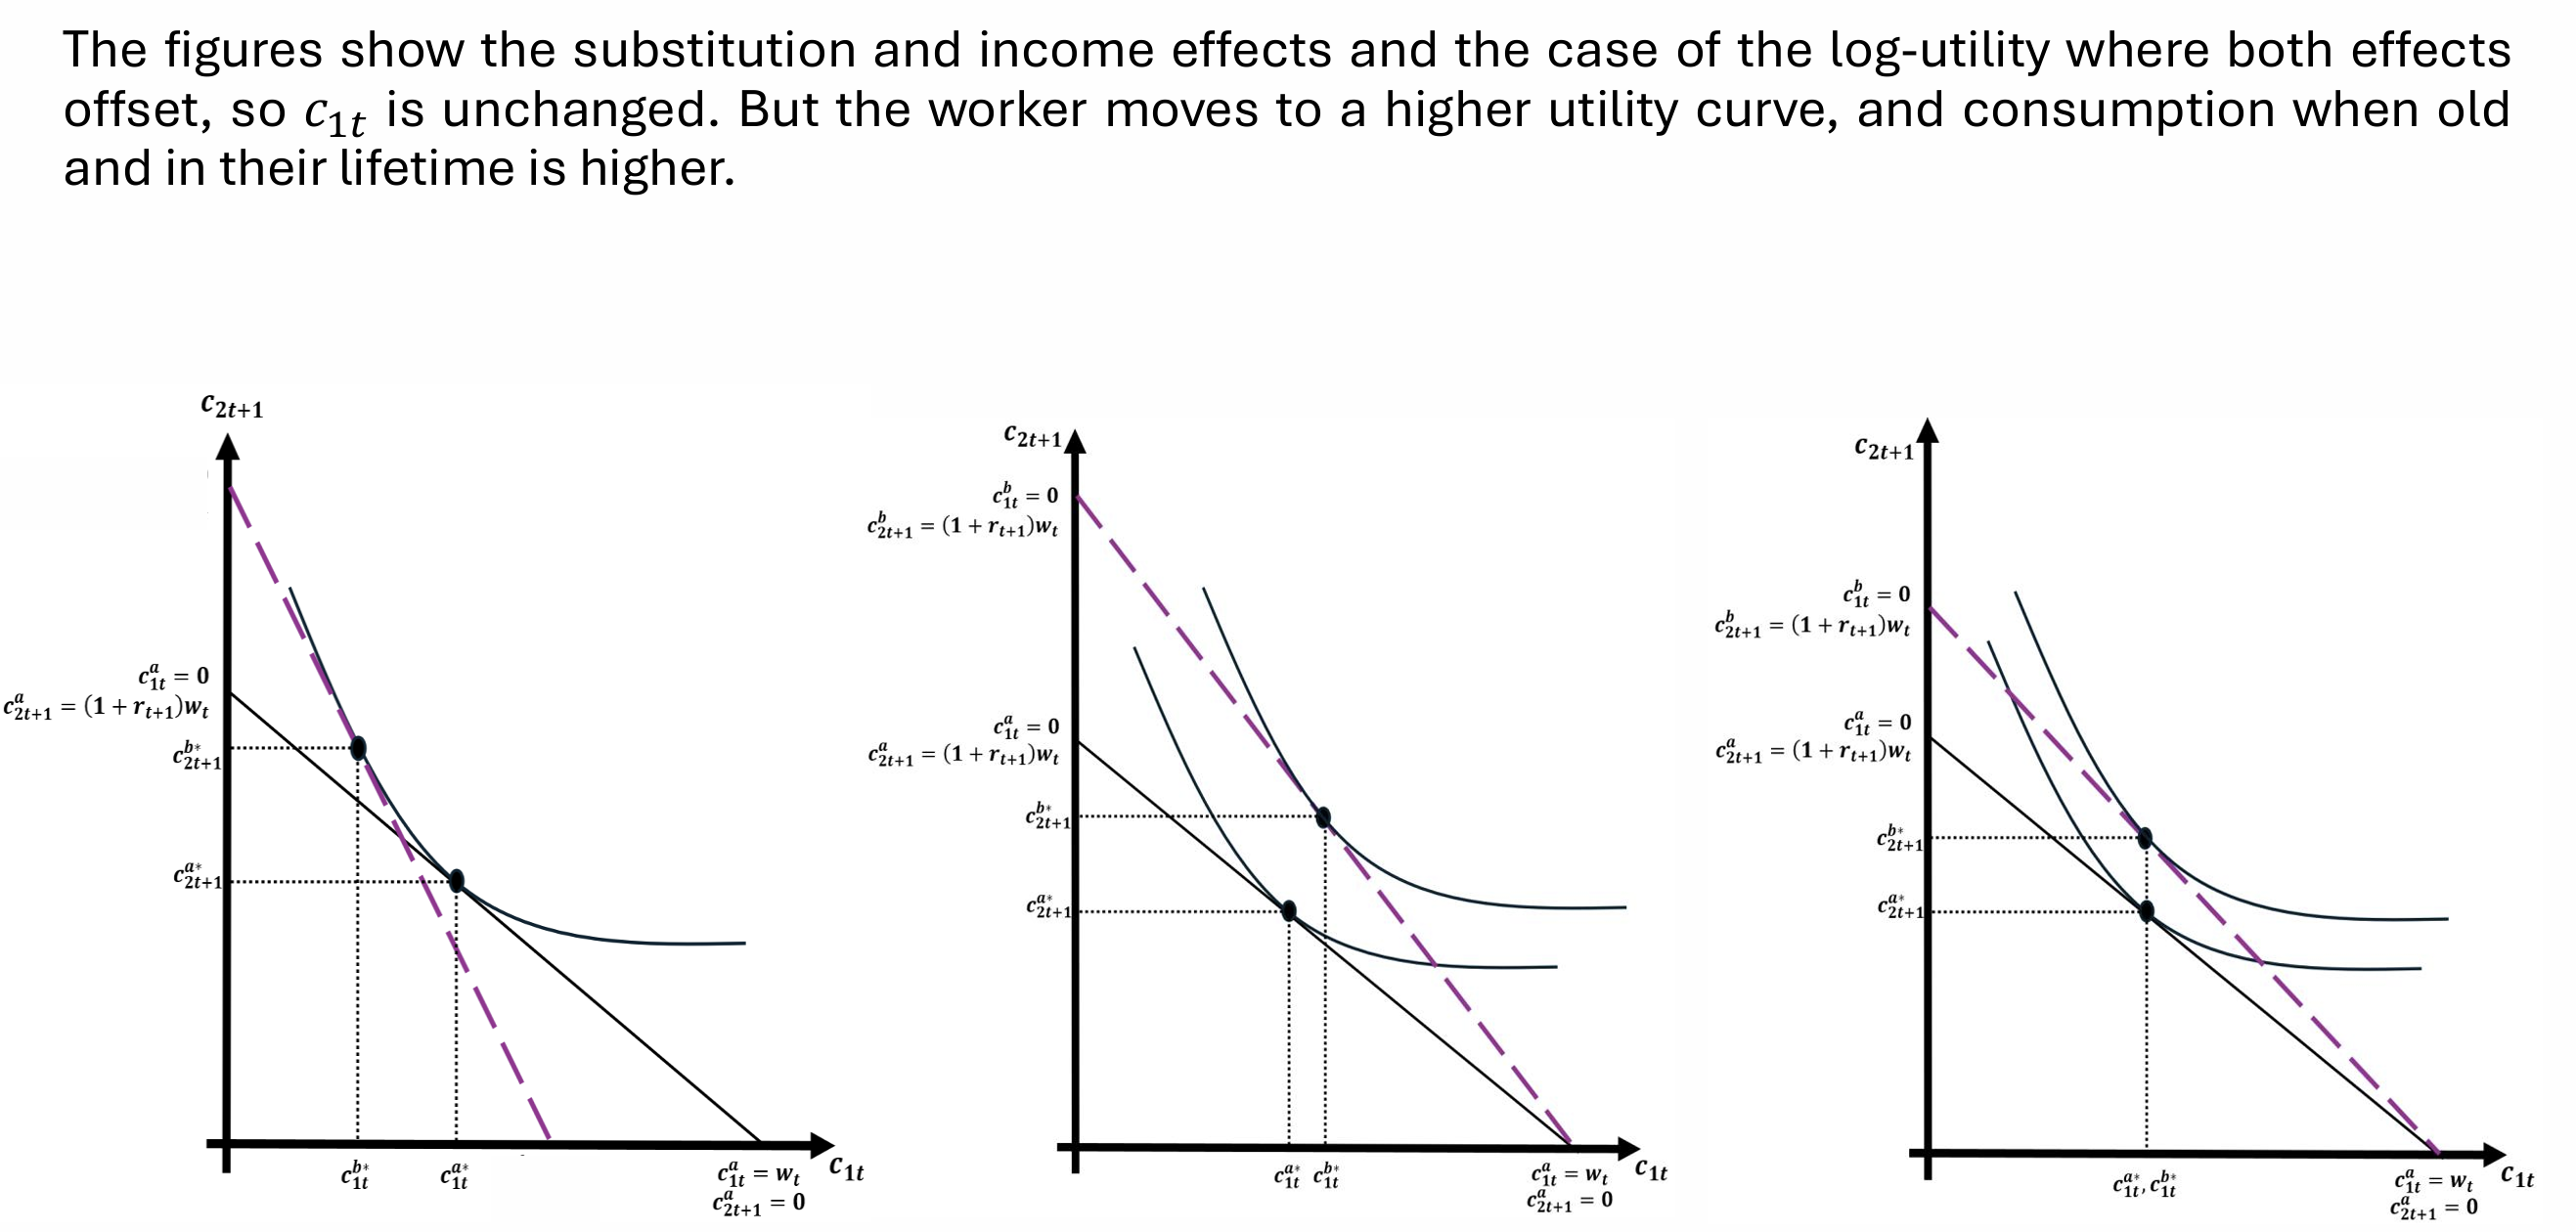
In general, we assume that the substitution effect dominates the income effect. However, with the log utility function, both effects offset each other so there is no change in savings in response to a change in the interest rate as seen in the equation
How can we show the impacts of the SE and IE graphically?
What do we assume about firms in the OLG model?
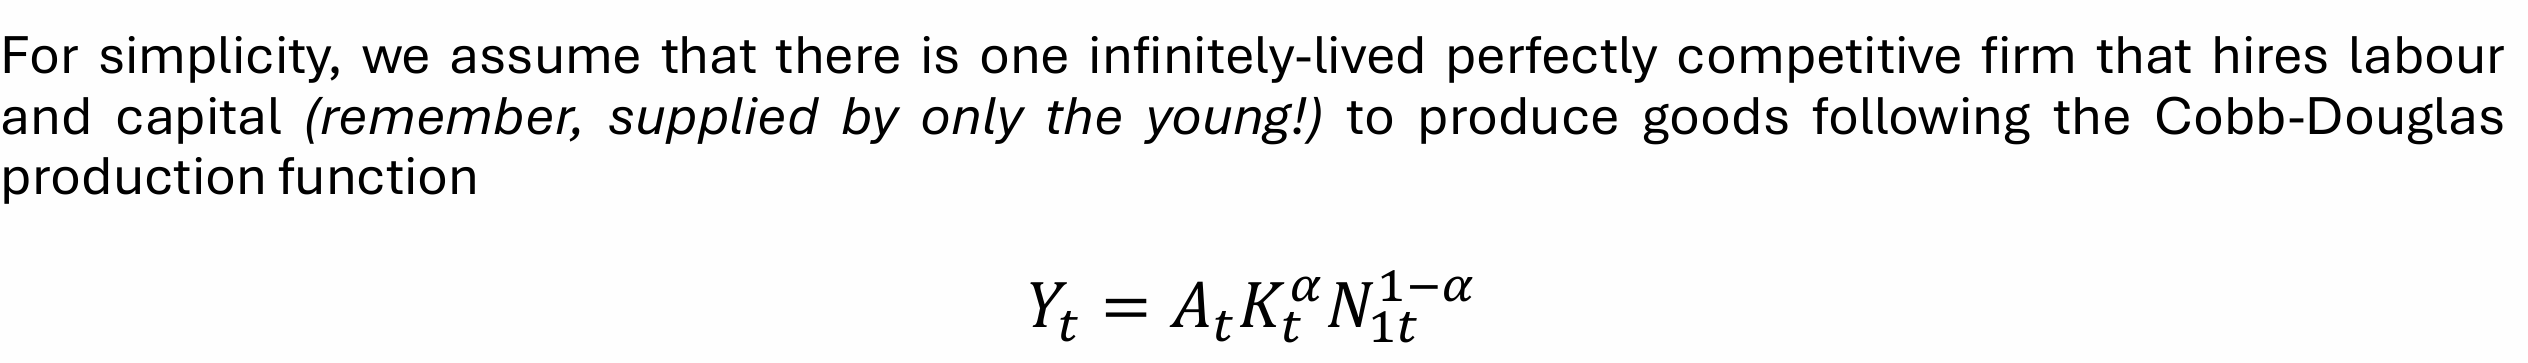
What is the profit function of the firm?

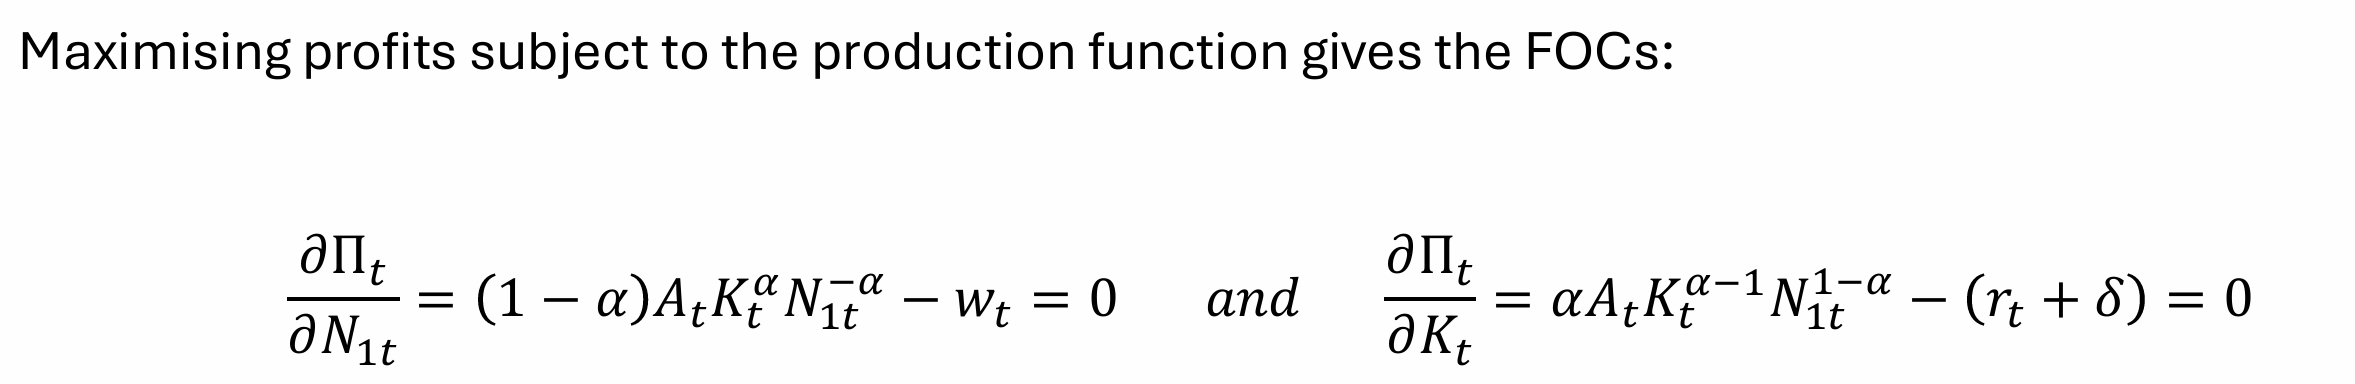
Maximising profits subject to the production function gives what FOCs?
Can also use the Lagrangian
From the FOCs, what is labour demand?
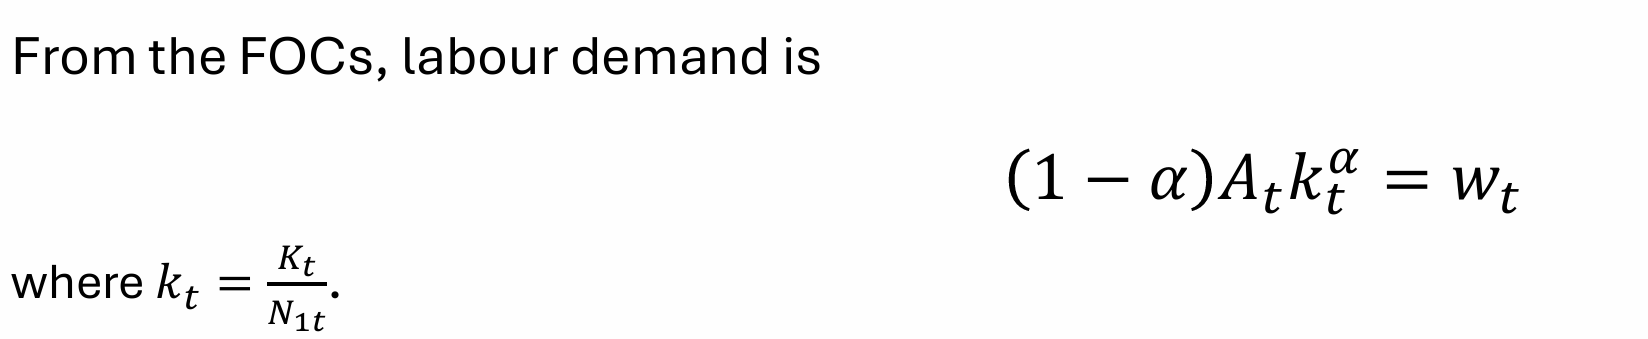

What does the equation tell us?
Workers receive a wage equal to the marginal product of their labour. The labour demand curve is downward-sloping; at higher levels of the wage, the firm will demand fewer units of labour
What is the demand for capital equation?

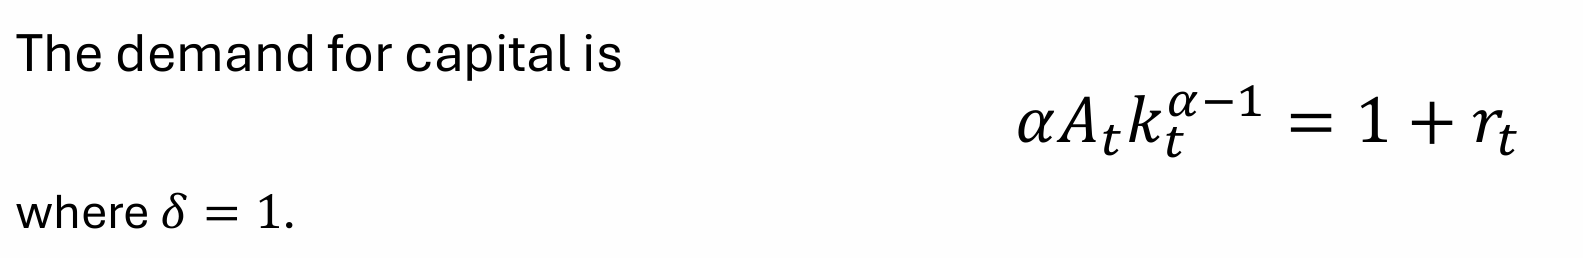
What does the equation tell us?
The firm pays a rent on capital that is equal to its marginal product. At higher rates of interest and/or depreciation, the firm will demand fewer units of capital
Why do firm hire labour and what happens to the goods that the firm produces?
We assume that firms hire the labour and capital supplied by young households for which they pay wages and rent, respectively, to produce goods. The goods produced by the firm are consumed by households (young and old)
What is aggregate consumption equal to?
Aggregate consumption in period t is the sum of consumption by all the young and all the old
What is the national identity for output?
What is the evolution of capital equation?

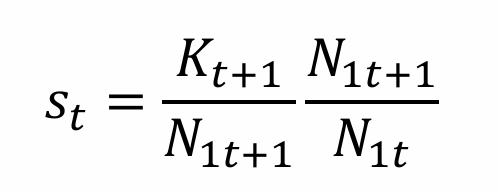
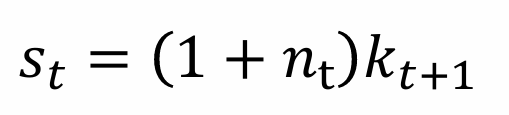
Given capital fully depreciates in the next period, what is capital in the next period equal to?
What does it suggest savings are used for?

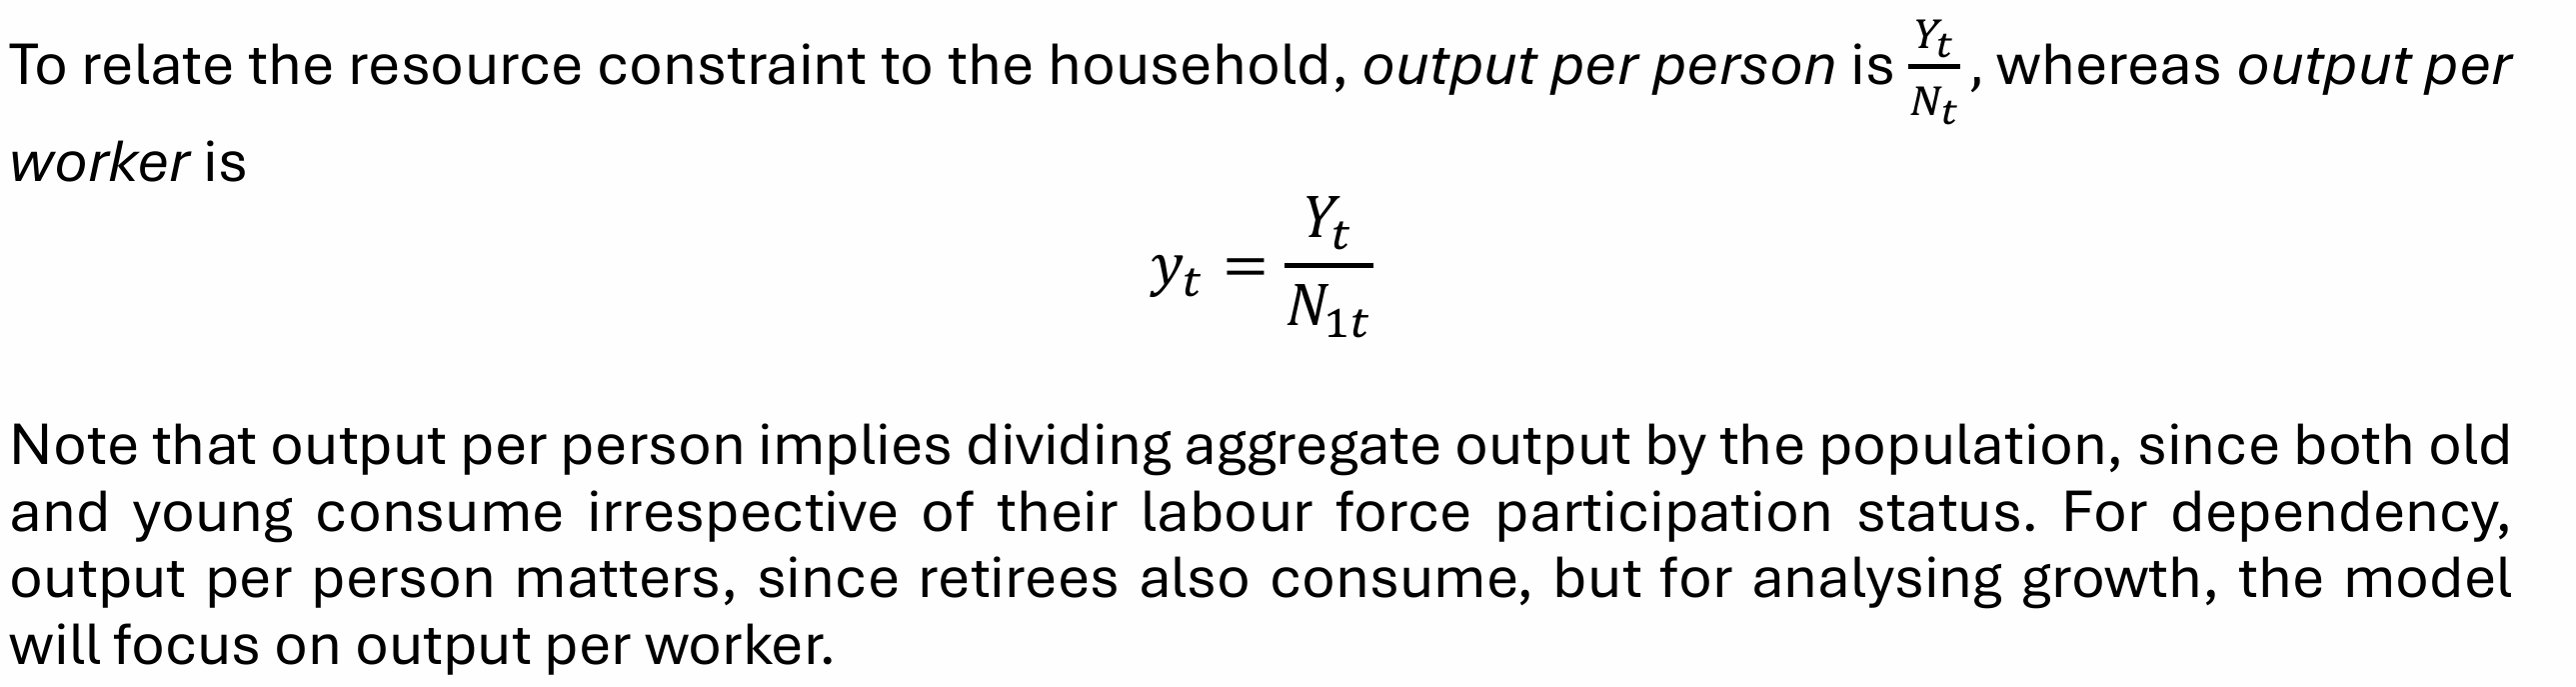
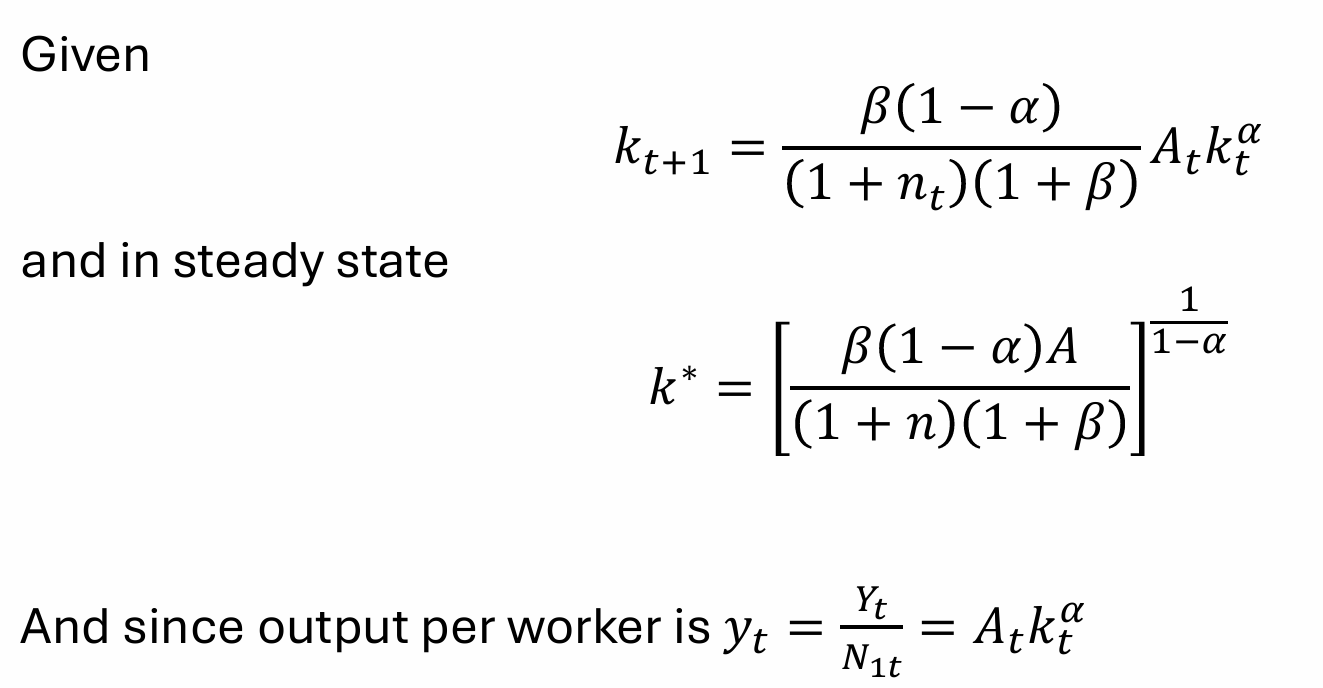
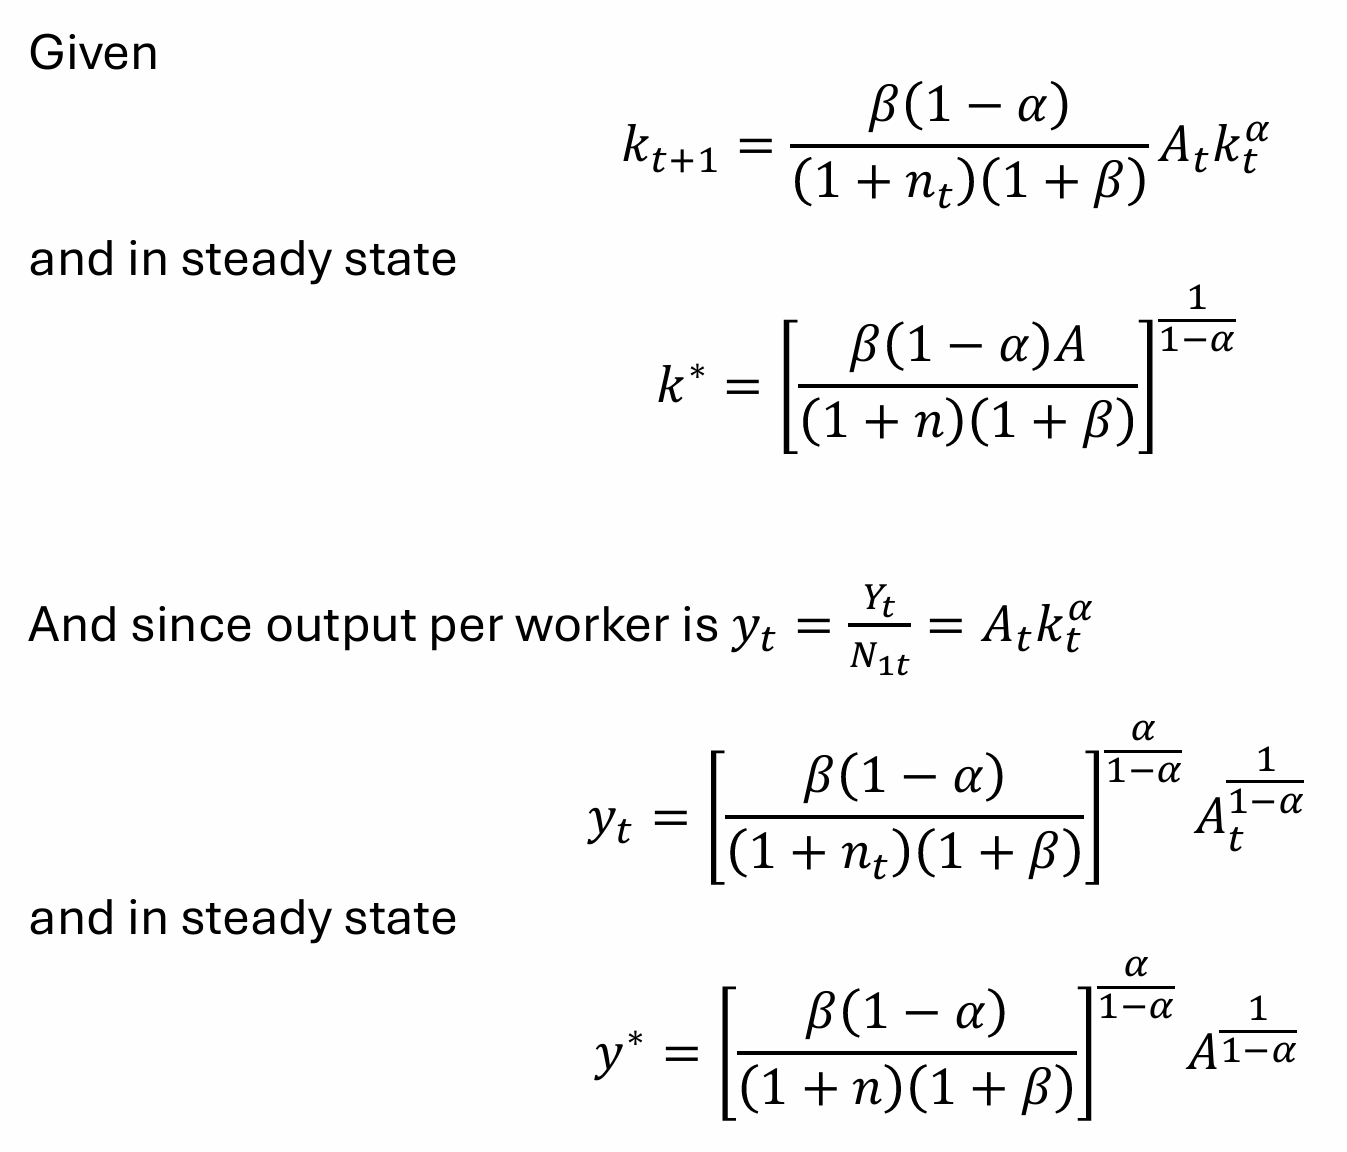
What is the equation for output per person and per worker?


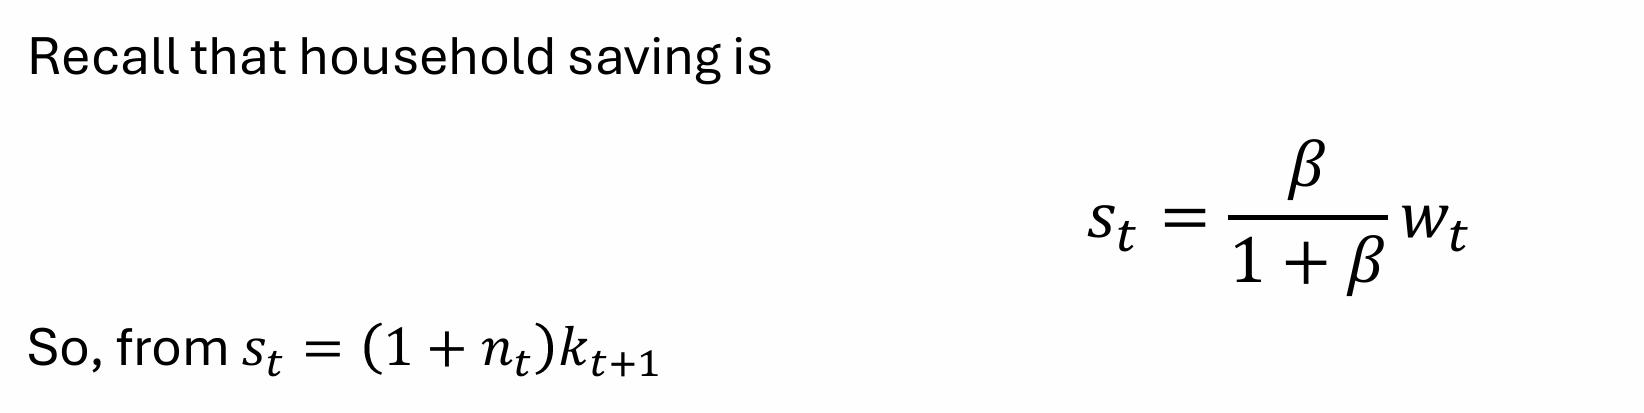
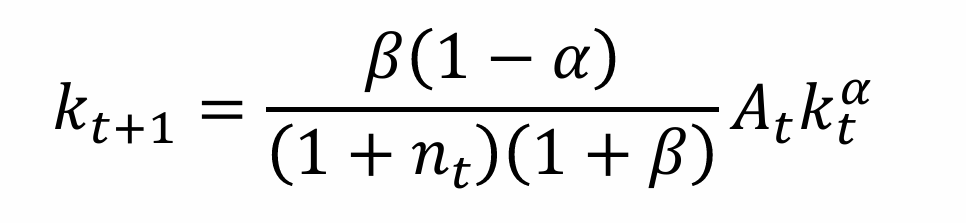
Rearrange for kt+1
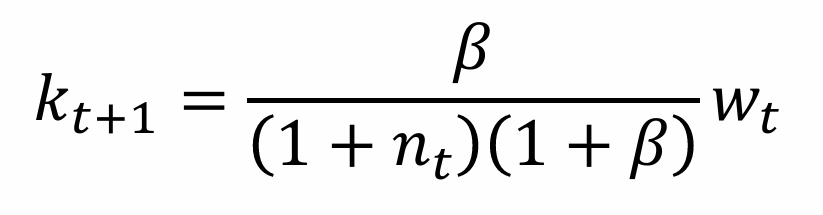


What is this known as?
Fundamental equation governing the evolution of capital
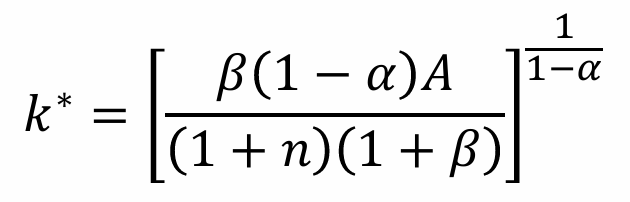
What is the steady state equation for k*?
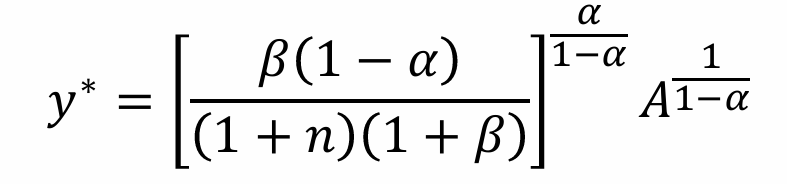
Rewrite yt
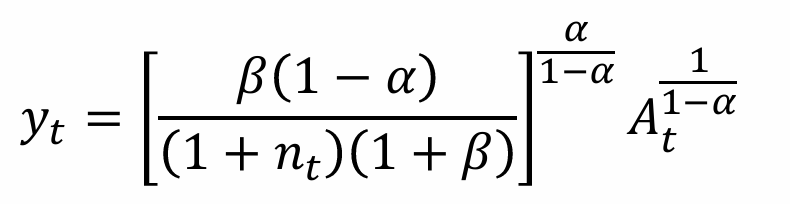

Write yt in steady state
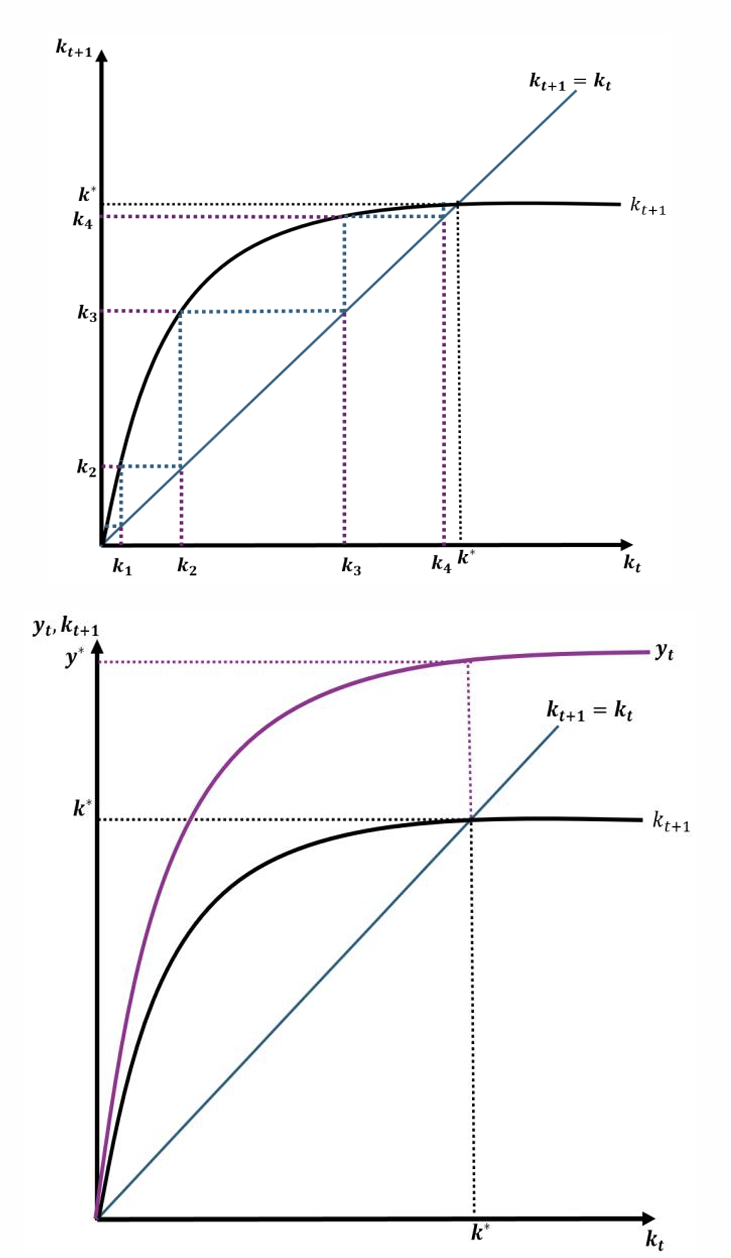
What is the graphical interpretation of the steady states?
The figures show the transition path for the economy and convergence to the steady-state. Convergence arises from diminishing MPK
What is the impact of higher investment?
Higher investment increases capital accumulation, a larger capital stock implies more capital per worker, higher wages and output
What is the impact of higher wages?
Higher wages imply higher subsequent investment, and the economy can accumulate more capital
What happens to capital and output per worker at lower levels of capital accumulation?
The equations and figures suggest that capital and output per worker will grow steeply at lower levels of capital accumulation
What will eventually happen to capital and output growth?
But capital and output growth per worker will decline and eventually converge to a steady state. It suggests that capital accumulation alone cannot bring about sustained output growth
How do we write a TFP shock in the OLG model?

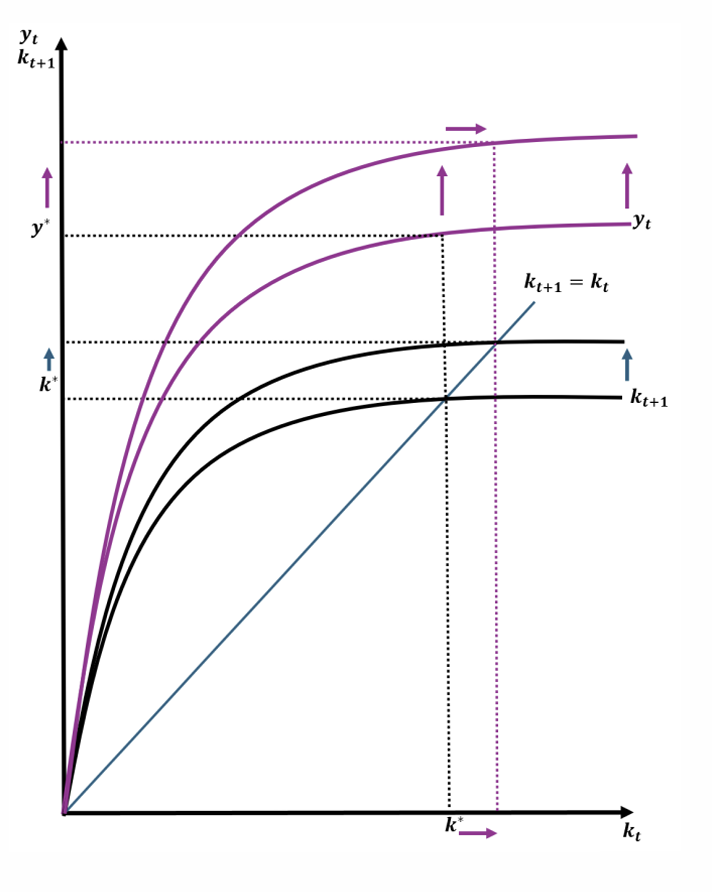
What is the impact of a positive productivity shock?
A positive productivity shock instantaneously increases output (since yt = Atkαt) because workers become more productive. This means that wages and savings rise. More saving increases investment and capital accumulation. So, capital and output converge to a higher steady state.
Policies targeted at what can feasibly ensure that the workforce can support an ageing population?
What does the OLG model not describe about a productivity shock?
The model does not describe how productivity improves and how it can be maintained. The model has no mechanism to delay/avoid convergence and sustain growth
How much of the adverse impacts of an ageing population can a productivity shock mitigate?
Some but not all, as explained by the OLG model
What does OLG suggest about a fall in nt?
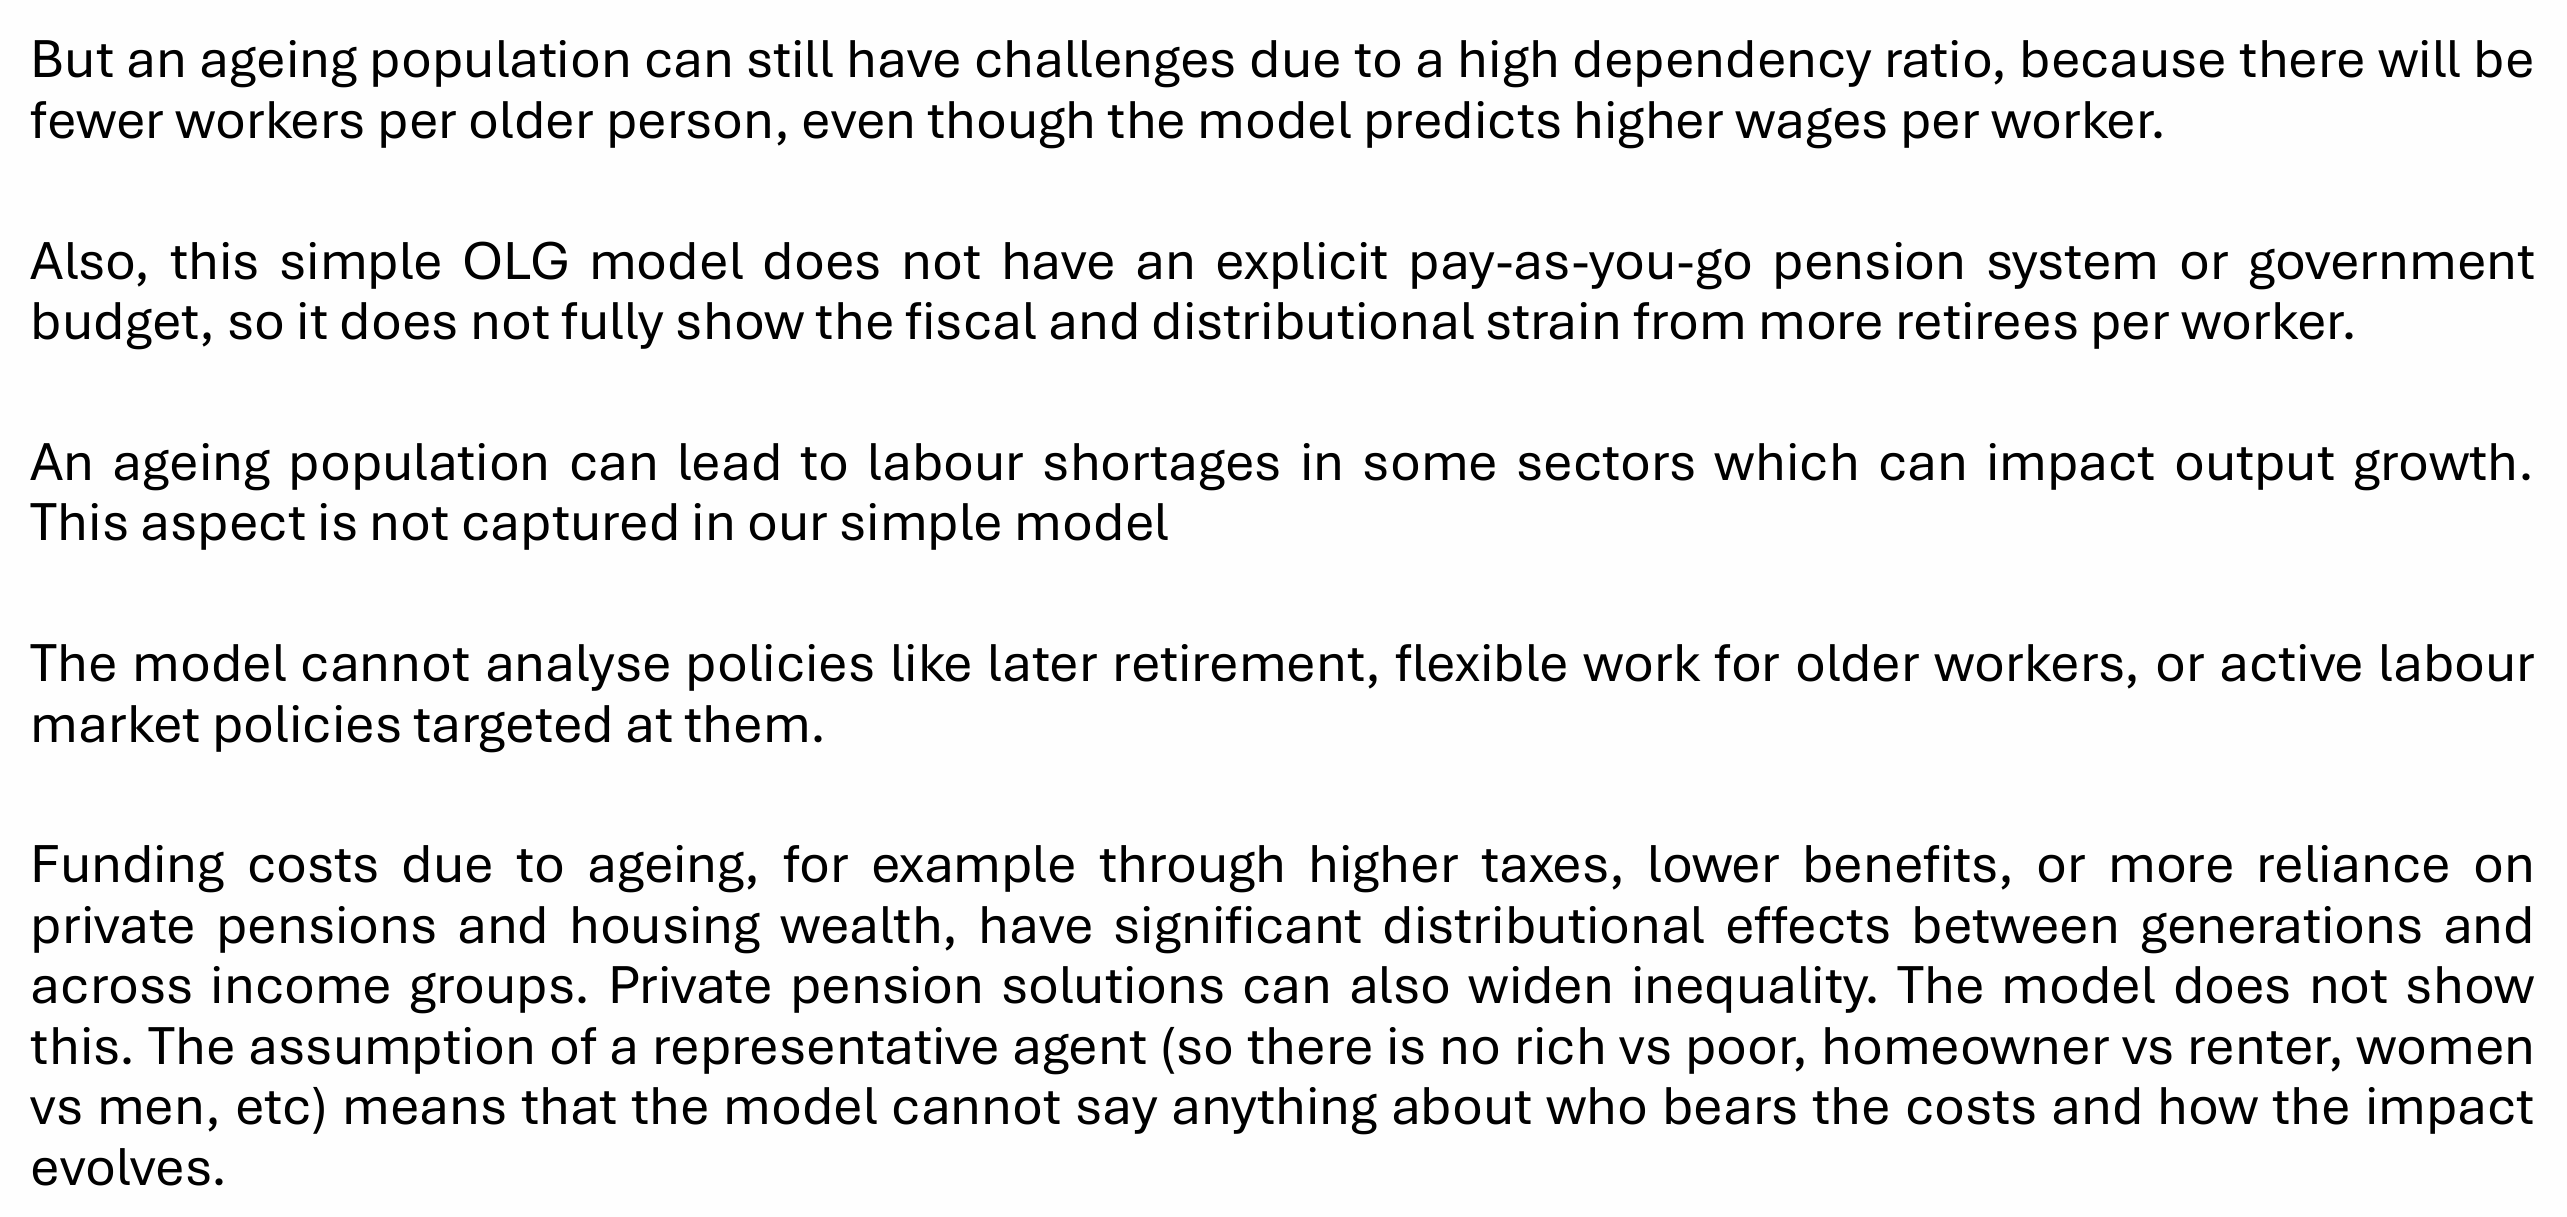
A fall in nt (slower population growth / ageing via fewer births) raises capital and wages per worker but does not fix the support/dependency-ratio problem
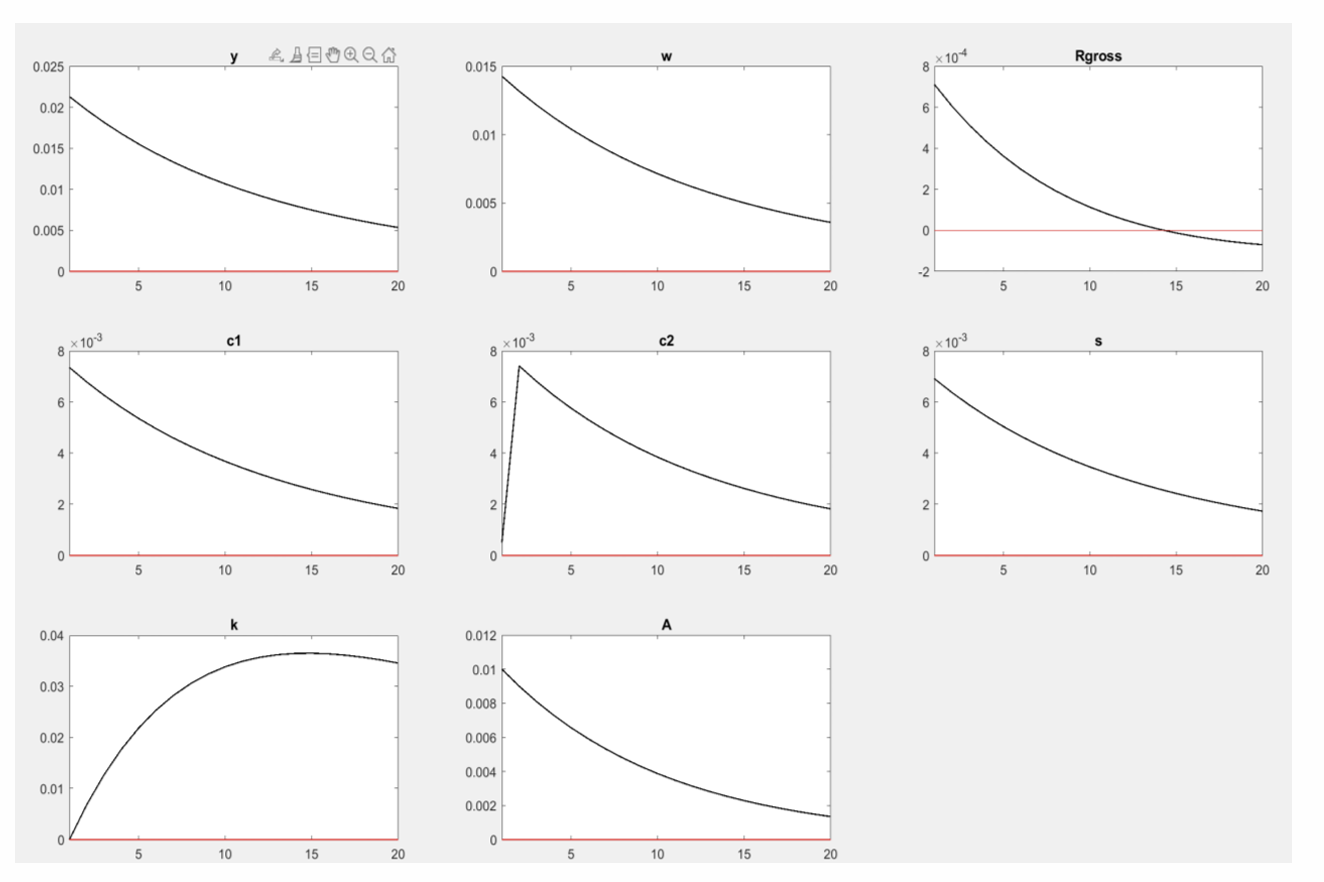
What do the IRF show about the impact of a temporary productivity shock?
What does this imply for our earlier argument that policies targeted at consistently increasing productivity will increase wages and output, and will more feasibly ensure that the workforce can support the UK’s aging population?
What is the OLG model unable to explain?
How does the population, production function and workforce change in a 3-period OLG model?

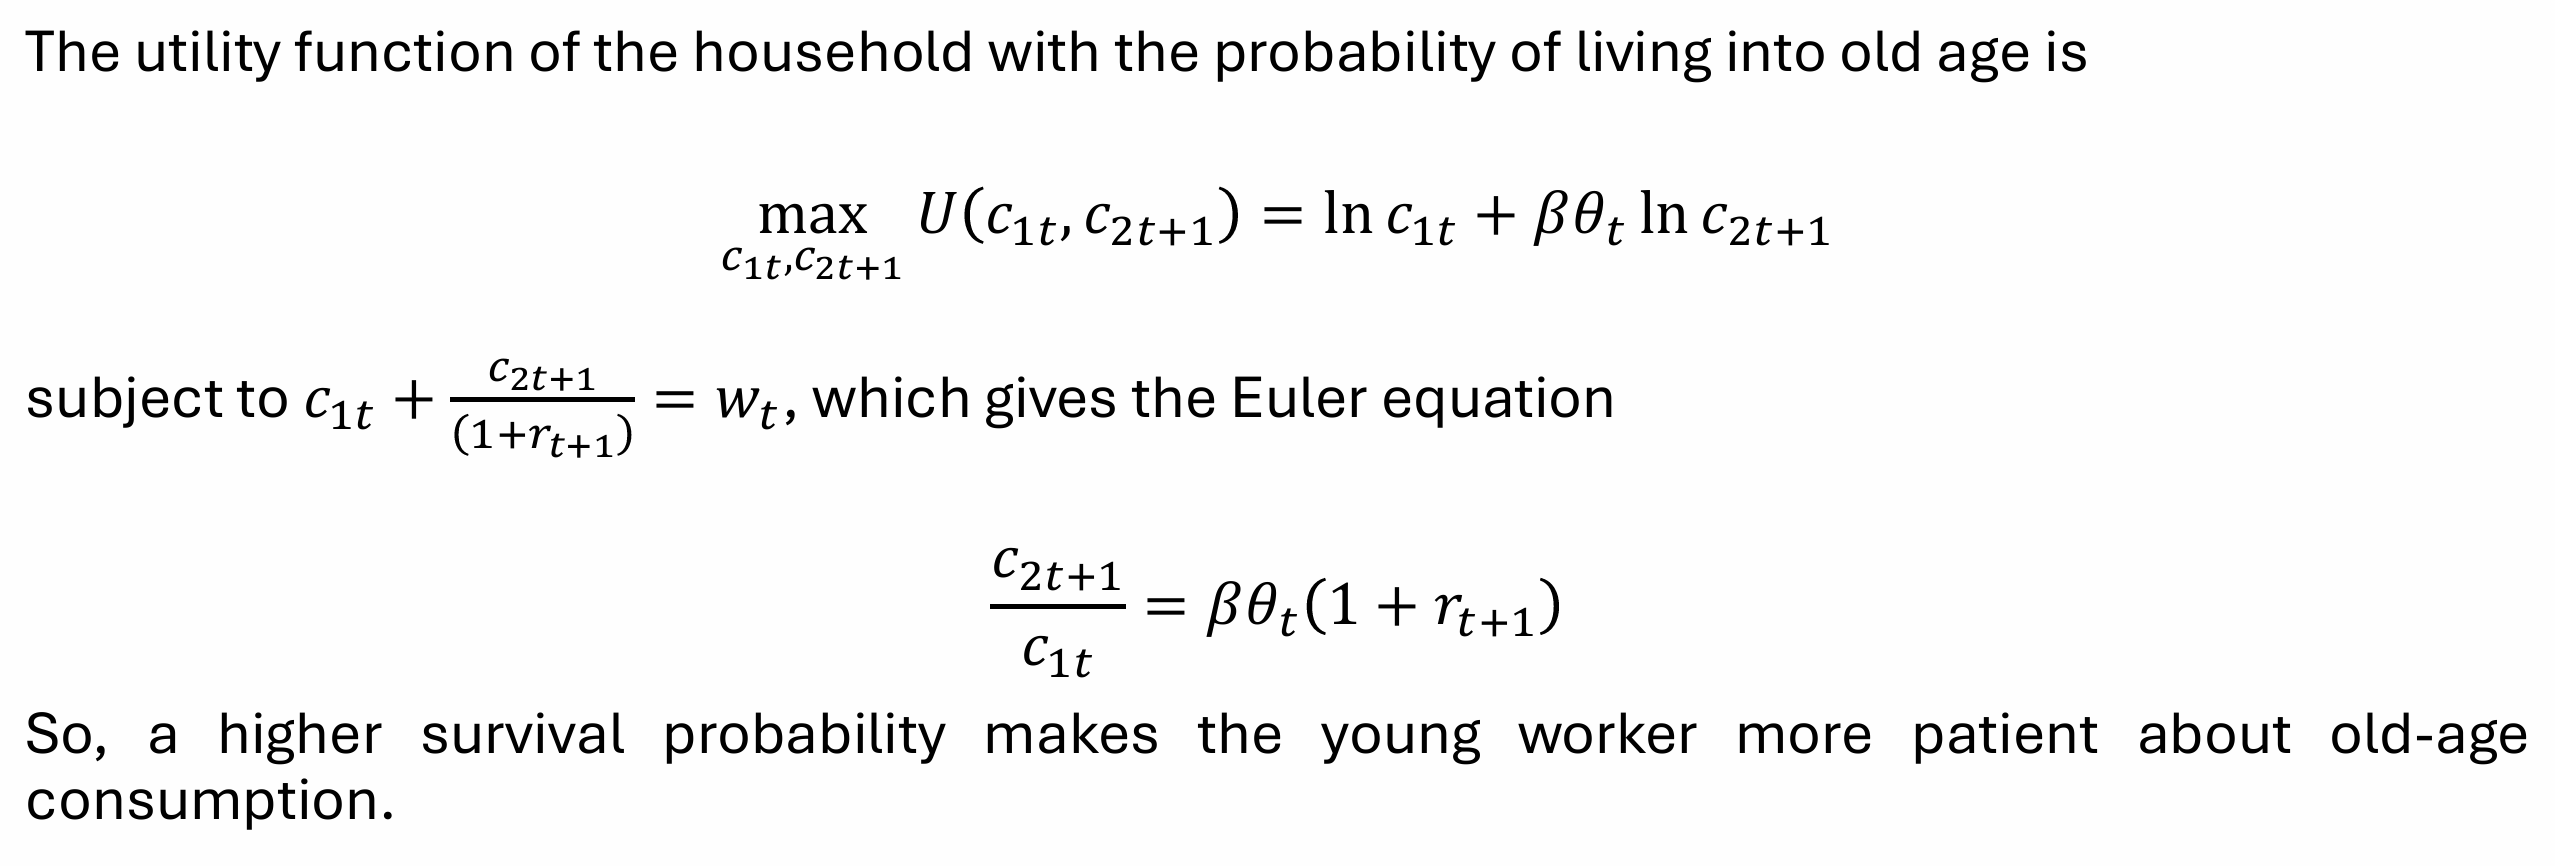
What will utility function be for the 3-period OLG?

What is the maximisation function for the household?

How does the assumptions of the OLG model differ with the inclusion of survival rates?

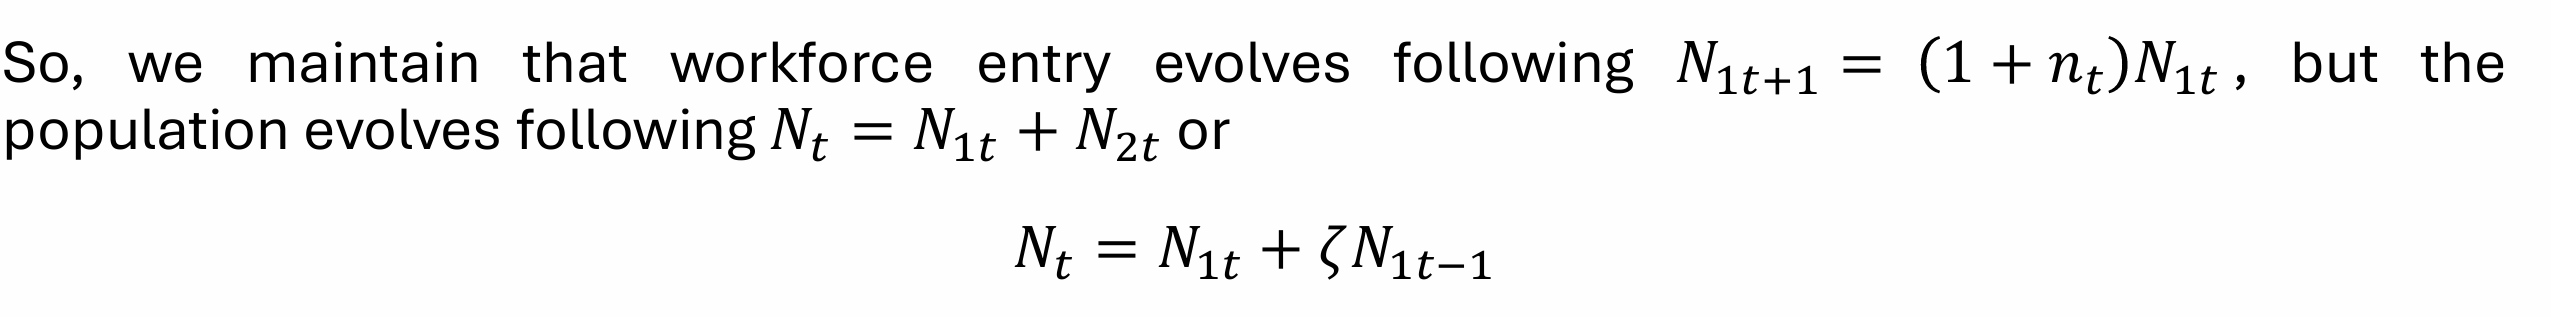
How does the evolution of the workforce differ in the OLG with survival rates?
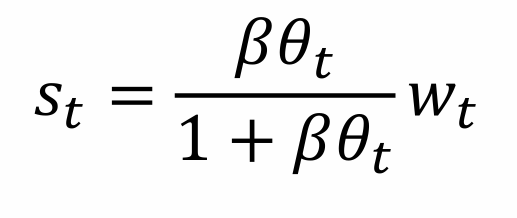
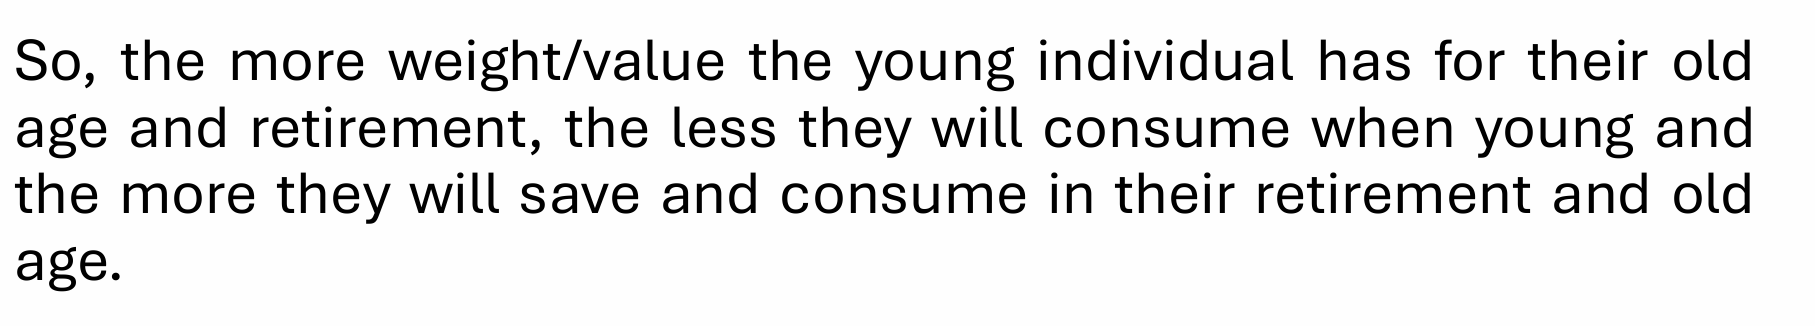
What is the maximisation problem for the household when survival rates are included?
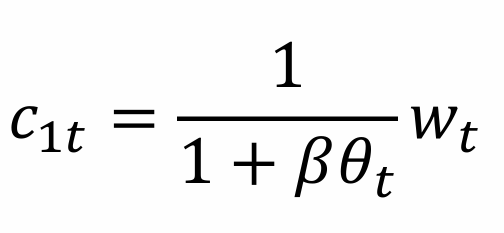
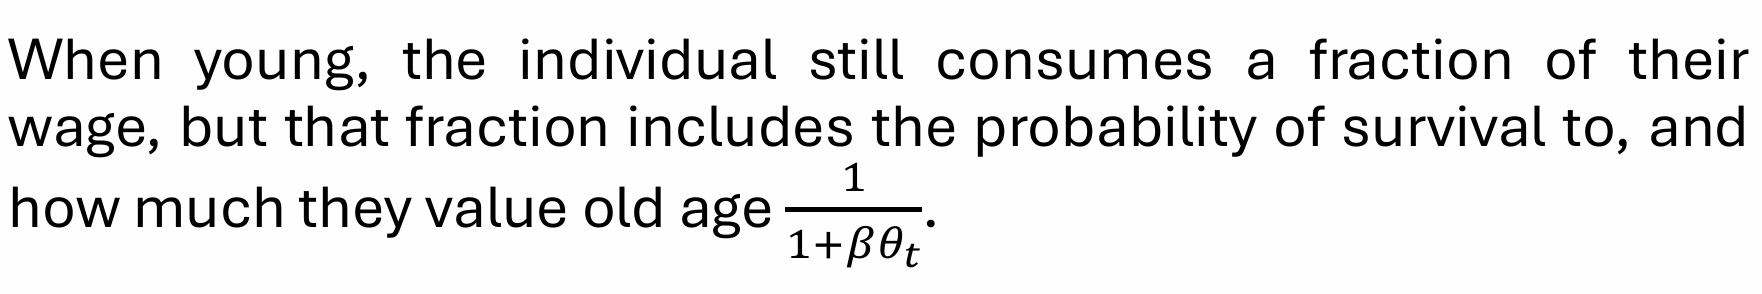
What does this tell us about consumption when young?
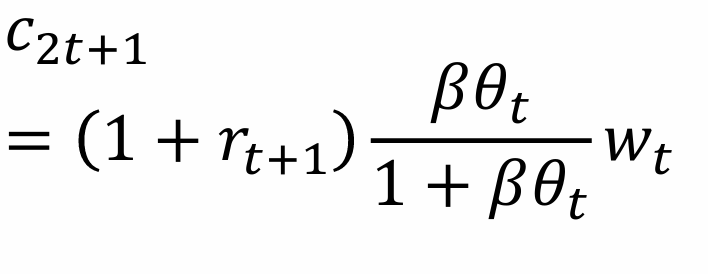
What does this tell us about consumption when old?

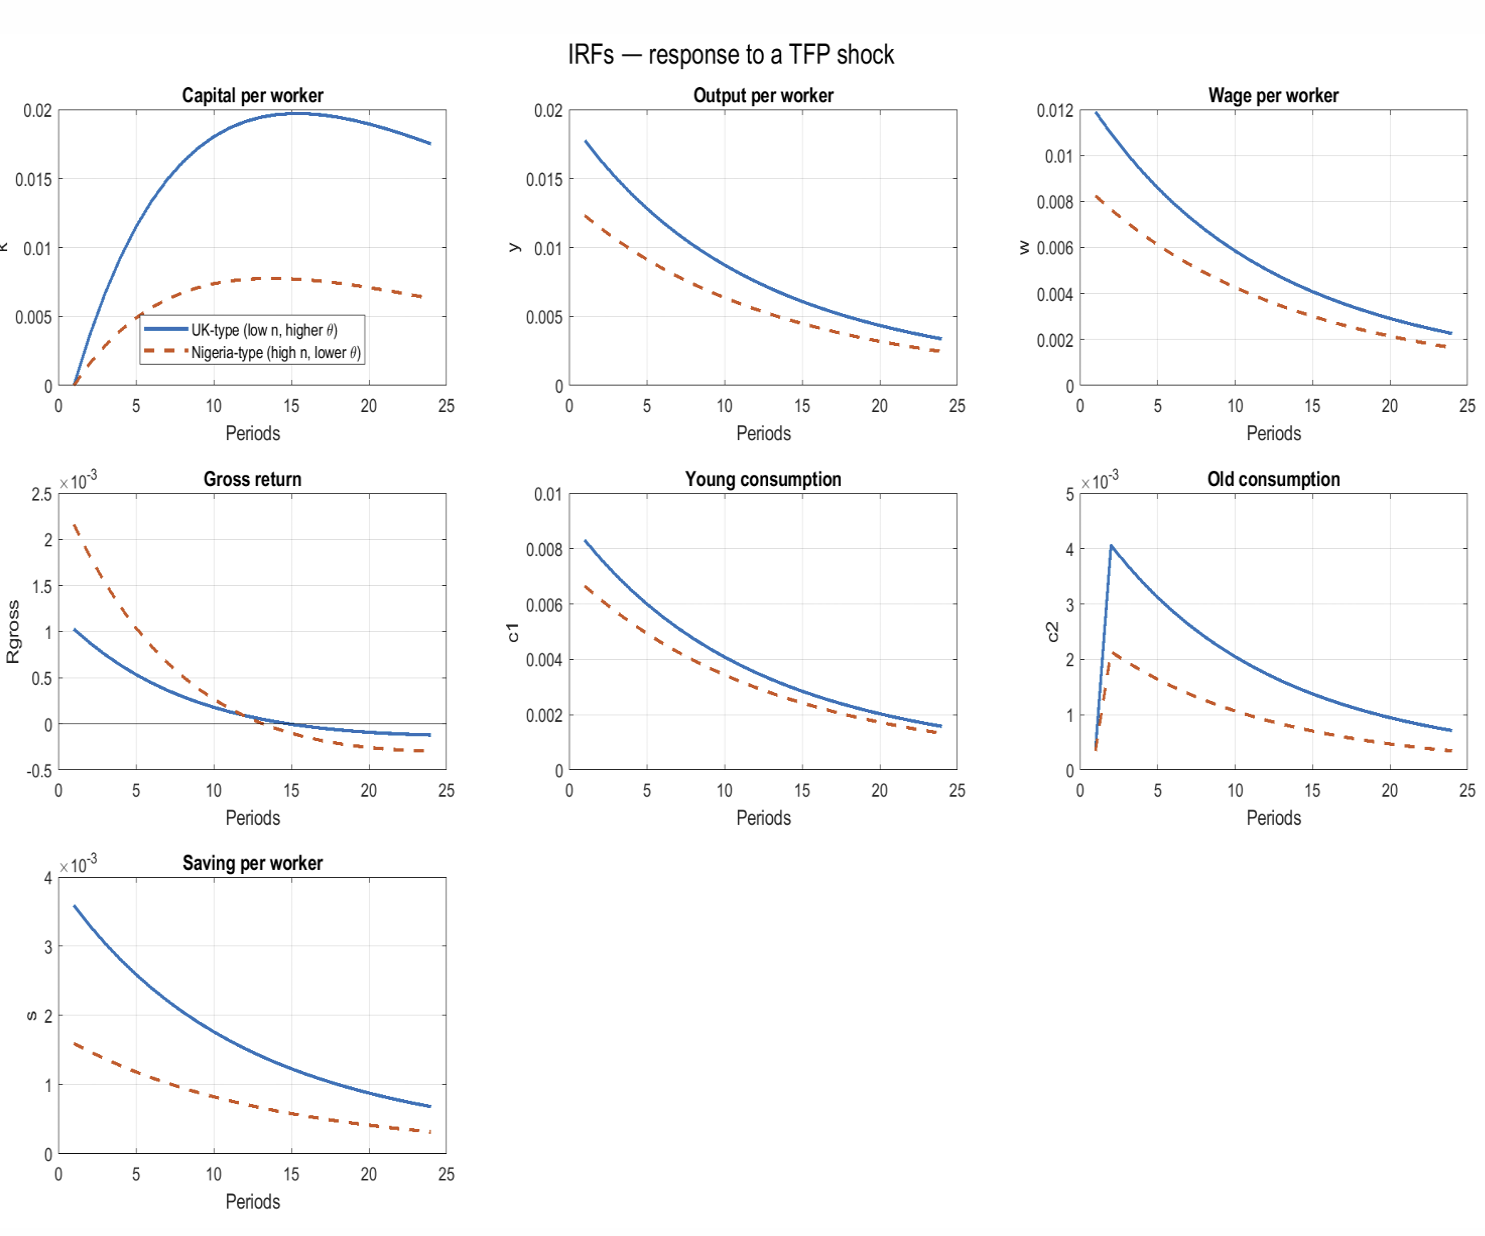
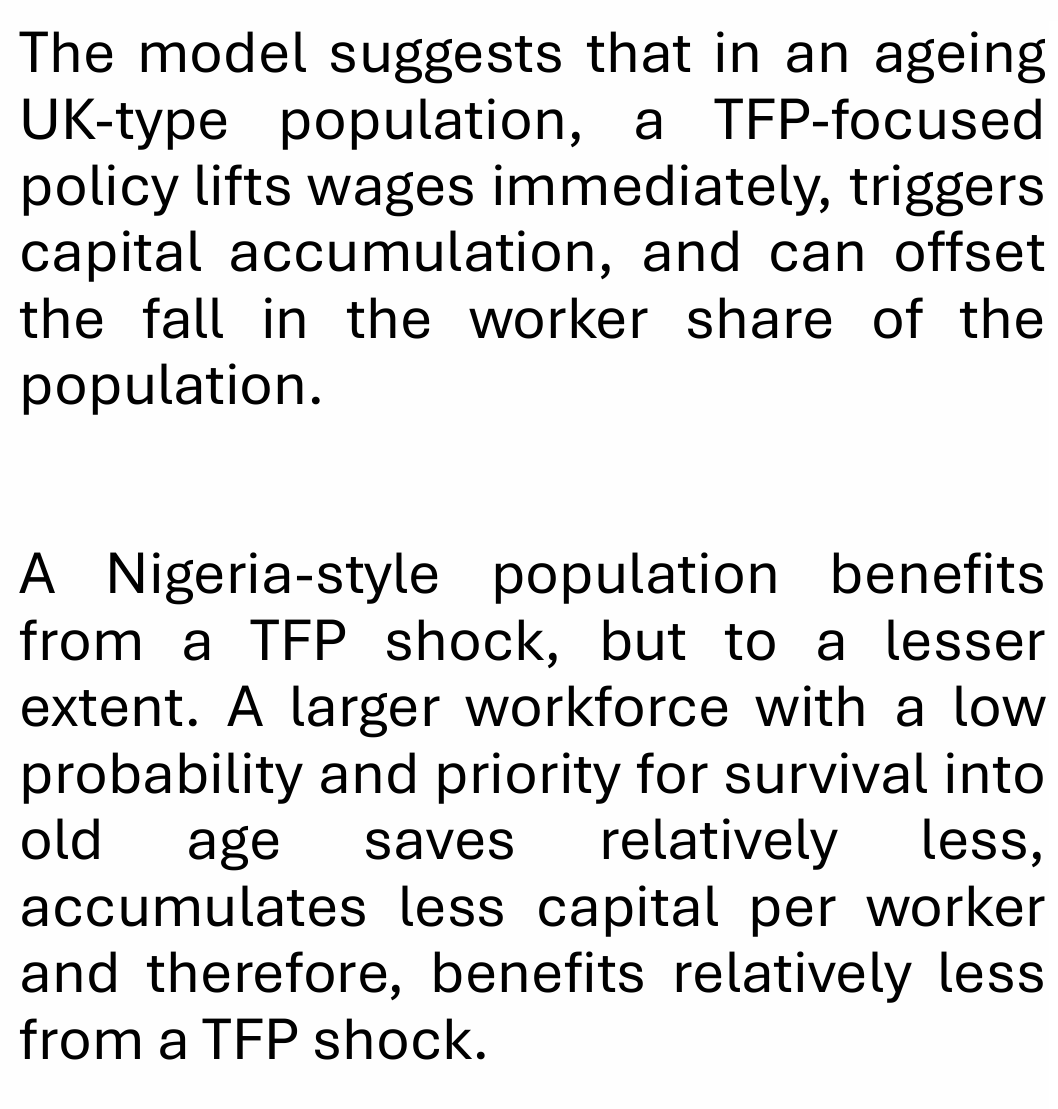
How does the response of a Low n High 𝜽 (UK) vs. High n Low 𝜽 (Nigeria) differ to a TFP shock?
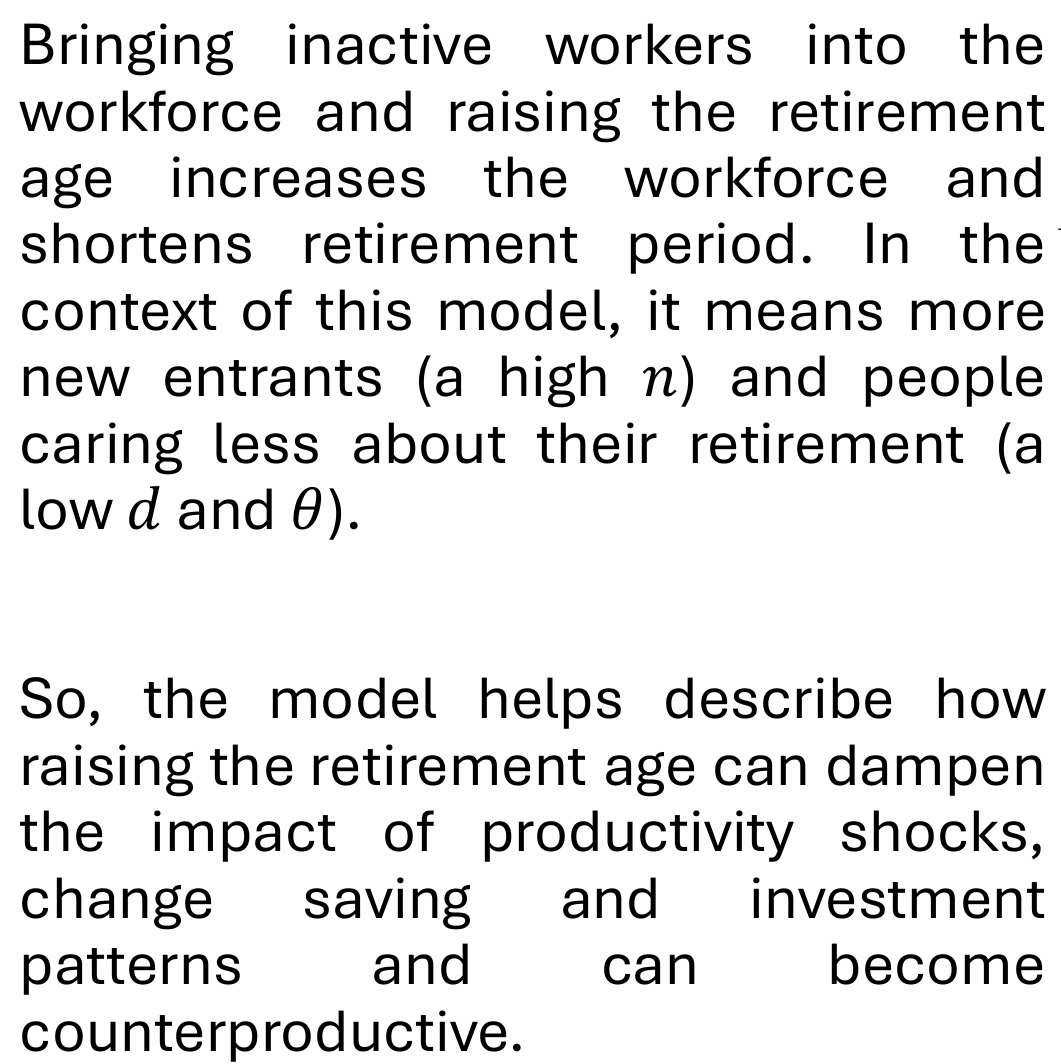
How does the inclusion of inactive workers and raising the retirement age impact the results?
What is a two-period/three-period OLG model better suited to analysing?
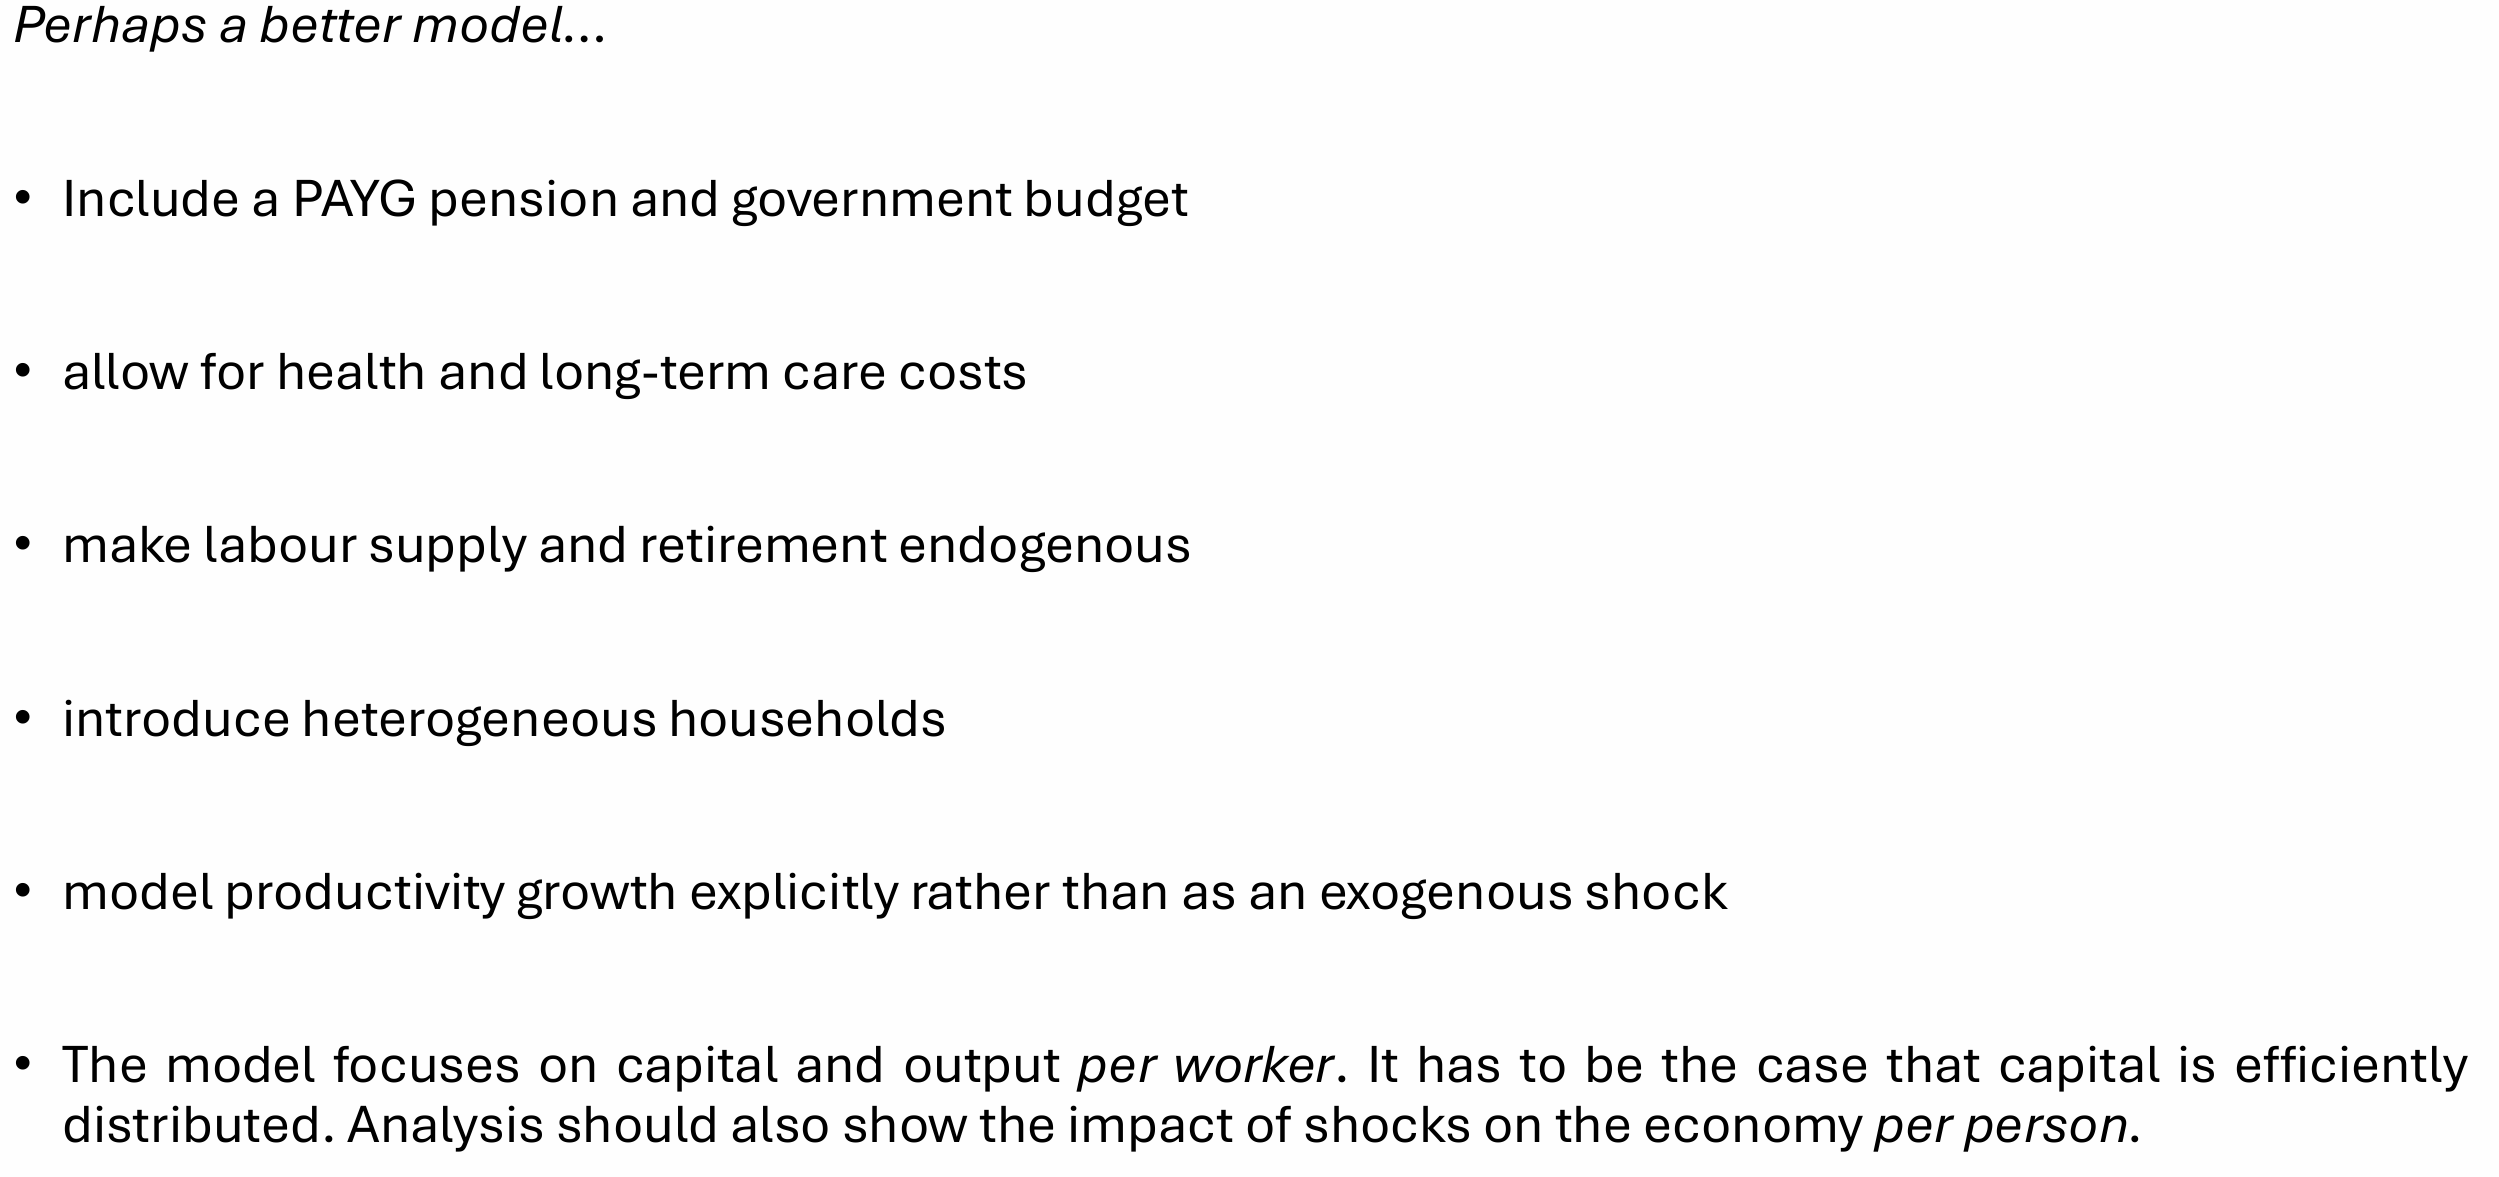
What could we include to improve the OLG model?