Data Analysis Final Part 3
1/44
There's no tags or description
Looks like no tags are added yet.
Name | Mastery | Learn | Test | Matching | Spaced | Call with Kai |
|---|
No analytics yet
Send a link to your students to track their progress
45 Terms
Confidence Interval
provides additional information about the variability of the estimate, provides more information about a population characteristic than a point estimate
Confidence Interval Estimate
gives a range of values, takes into consideration variation in sample statistics from sample to sample, based on observations from 1 sample, gives information about closeness to unknown population parameters, stated in terms of level of confidence (ex. 95% confident)
Impossible Confidence Level
100% confidence
What Confidence Intervals are for
to get to know population parameters when working with sample statistics, it gives you a range of values
Alpha
1 - confidence level = __
(ex. 1 - .95 = .05)
also known as the level of significance
When Standard Deviation is Known …
use the z distribution for the confidence interval
When the Standard Deviation is Unknown …
use the t distribution for the confidence interval
Critical Value
a table value based on the sampling distribution of the point estimate and the desired confidence level
T Distribution
used when the population standard deviation is unknown, relies on degrees of freedom
Degrees of Freedom
n - 1
(n = sample size)
Can Confidence Intervals be used with Categorical Data?
yes, for proportions measuring items of interest in a population
Determining the Required Sample Size for the Mean
you must know the desired level of confidence, the acceptable sampling error, and standard deviation to determine this
Determining the Required Sample Size for the Proportion
you must know the desired level of confidence, acceptable sampling error, and the true proportion of events of interest to determine this
Hypothesis Definition
a claim about a population parameter
What Sign Does the Null Hypothesis Have to Have?
equal sign (=)
Null Hypothesis
begins with the assumption that this hypothesis is true, represents the current belief in a situation, may or may not be rejected
Alternative Hypothesis
challenges the status quo, is generally the hypothesis that the researcher is trying to confirm
If the Null Hypothesis is Rejected …
the alternative hypothesis is NOT proven to be correct
Type I Error Definition
the null hypothesis is true but we rejected it
Probability of Type I Error
alpha
Type II Error Definition
the null hypothesis is false but we did not reject it
When do you reject the null hypothesis?
when the p value is less than the level of significance (alpha)
One Sample t Minitab / T Mean Excel
use when testing the hypothesis of the mean
data needed → null hypothesis, level of significance, sample size, sample mean, sample standard deviation
Two sample t Minitab / Pooled variance t excel
use when testing for differences in two means/variances
data needed → hypothesized difference, level of significance, sample size of both samples, sample mean of both samples, and sample standard deviation of both samples
Paired t test Minitab / Paired t test excel
use in testing means for two related or dependent or same populations
data needed → hypothesized mean difference, level of significance, individual data entries
Two proportions Minitab / Z two proportions excel
use when finding the differences in two proportions
data needed → hypothesized difference, level of significance, number of items of interest for both groups, sample size for both groups
Two variances Minitab / f two variances excel
for numerical data, if two samples are from independent populations, compare variances of each sample
data needed → level of significance, sample size for both samples, sample variance for both samples
When Samples Should be Independent
the samples are from unrelated populations
When the Samples Should be Paired
when the samples are from related populations
Anova One Way
compares three or more means (are they equal or not)
Tukey Kramer
used for to establish significant differences among groups
Chi Square Test
used for multiple groups of people with proportions
Regression
two numerical variances used to predict the y value (quality of variances)
Anova Assumptions
random sample, the distribution is normal, the sample size is greater than 30
Regression Analysis
used to predict the value of a dependent variable based on the value of at least one independent variable (explains the impact of changes in an independent variable on the dependent variable)
Dependent Variance in Regression
y , the variable we wish to predict or explain
Independent Variable in Regression
x , the variable used to predict or explain the dependent variable
Linear Regression Relationship
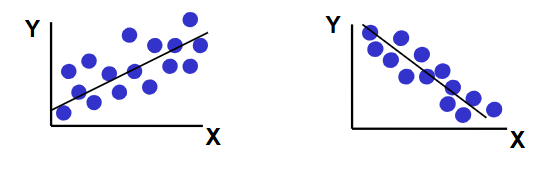
Curvilinear Regression Relationship
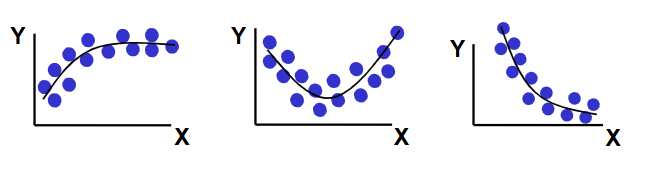
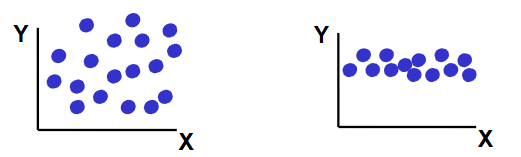
No Regression Relationship
regression is always used on …
two numeric variables.
In regression charts, the dependent variable goes on the _-axis. (enter one lower case letter)
y
in regression charts, the independent variable goes in the _-axis (enter one lower case letter)
x
in regression lines, the R2, the coefficient of determination, measures …
how much of the variation in Y can be explained by the variation in X, according to the model, basically how well the points in the scatter plot fit the line (he said it’s the longest one)
In multivariable regression, each independent numerical variance – in minitab these are called “continuous predictors” — that correlates to the dependent variable (the “response” in minitab” gets its own …
slope coefficient