Understanding the Production Possibility Curve
1/21
There's no tags or description
Looks like no tags are added yet.
Name | Mastery | Learn | Test | Matching | Spaced | Call with Kai |
|---|
No study sessions yet.
22 Terms
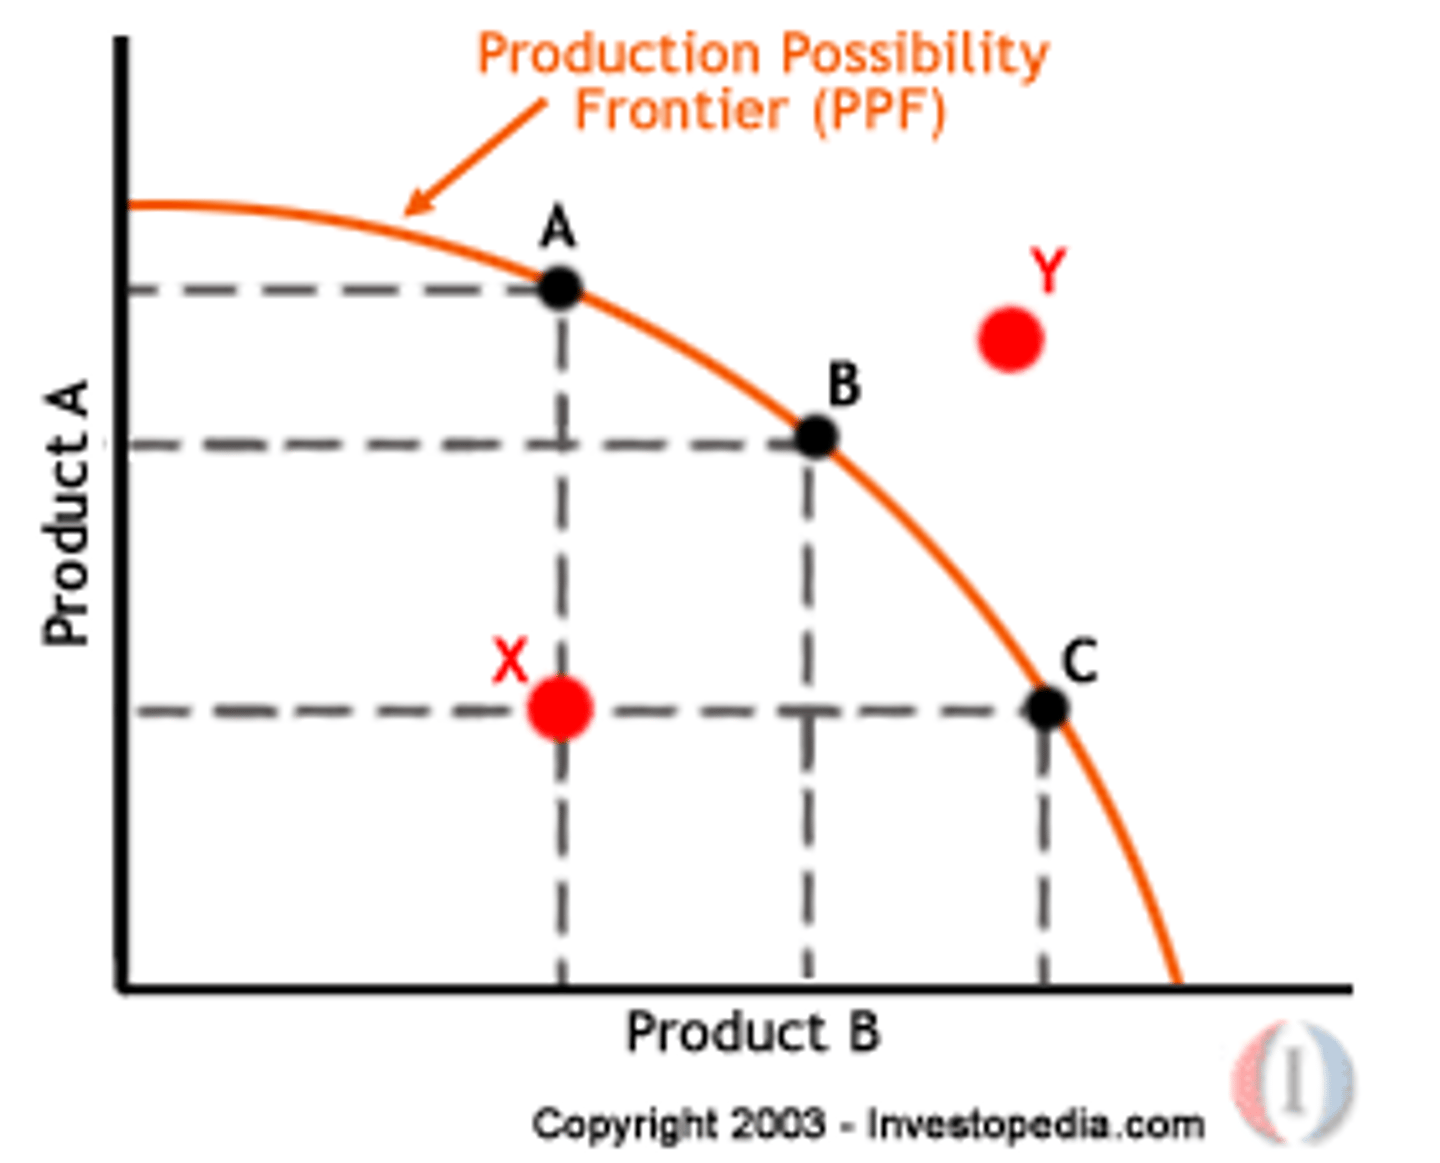
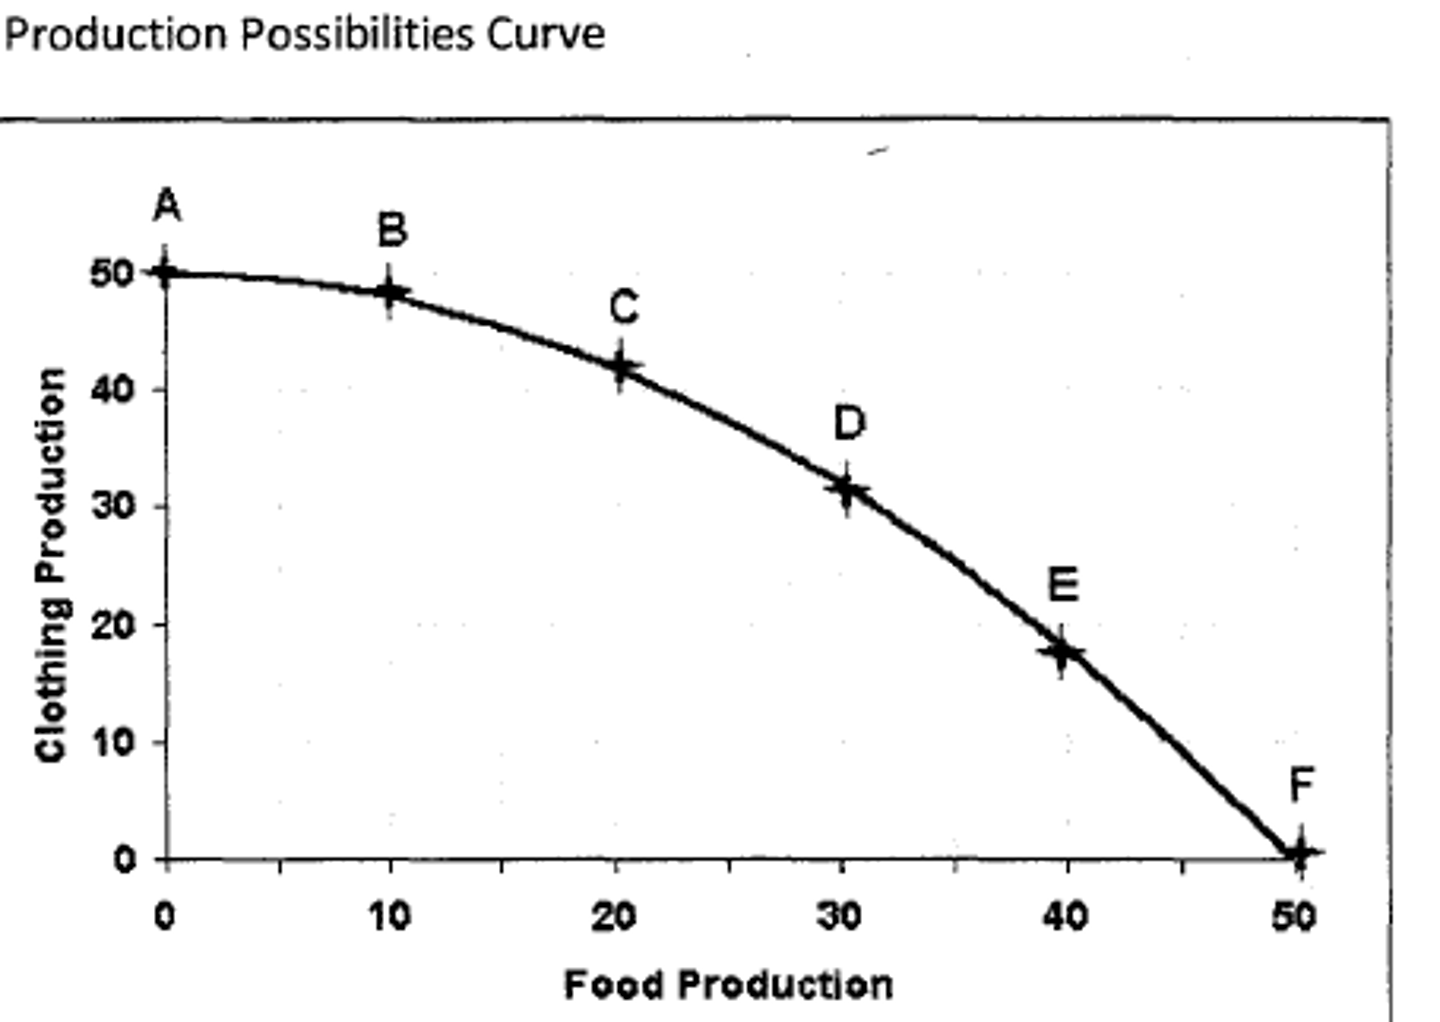
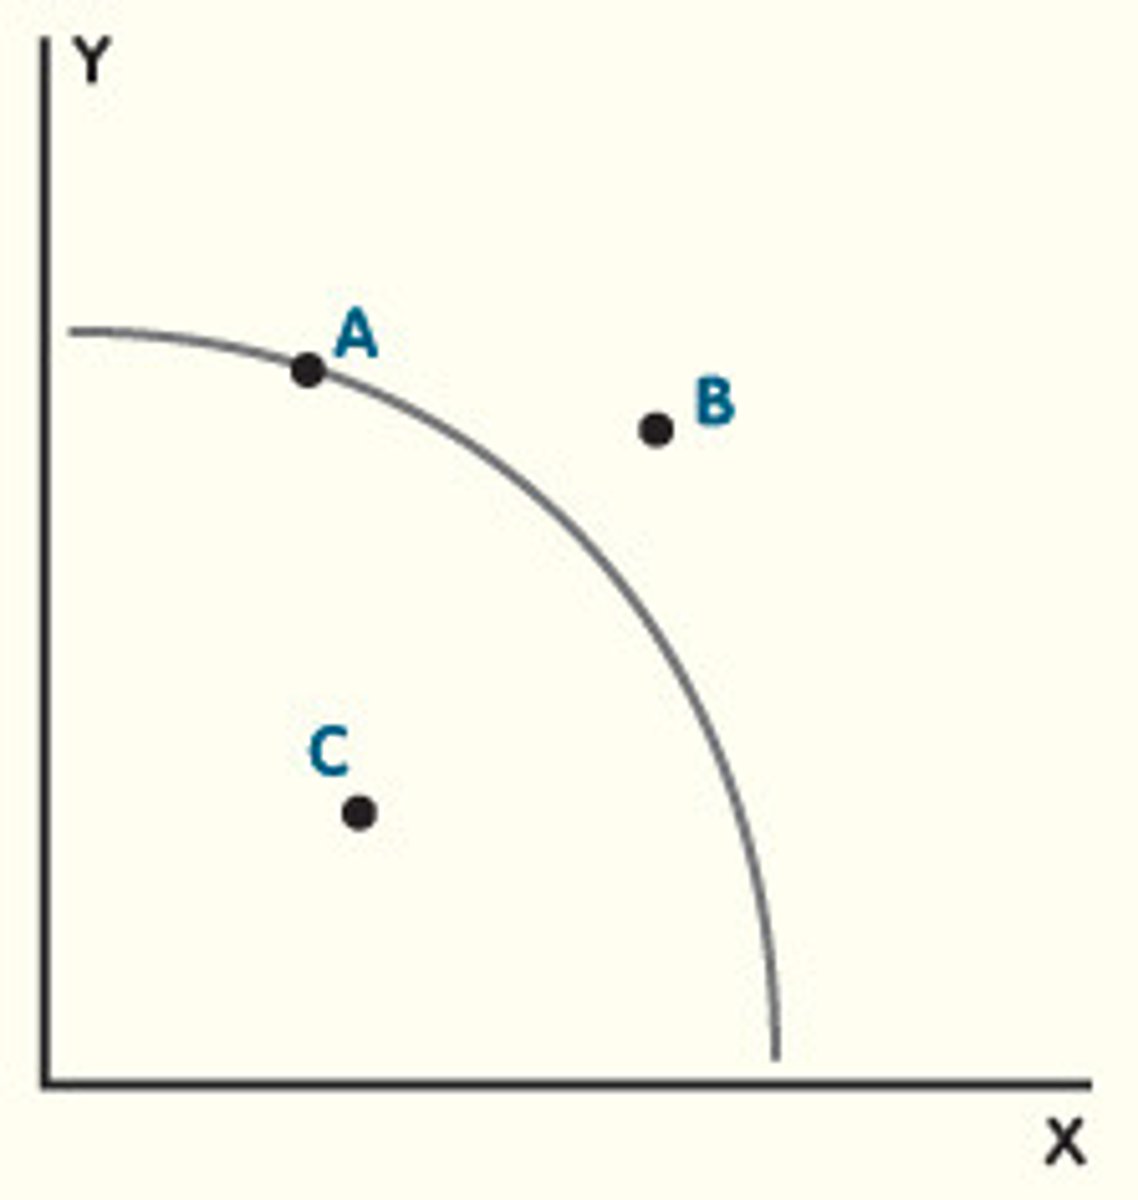
Production Possibility Curve (PPC)
Graph showing maximum production combinations of goods.
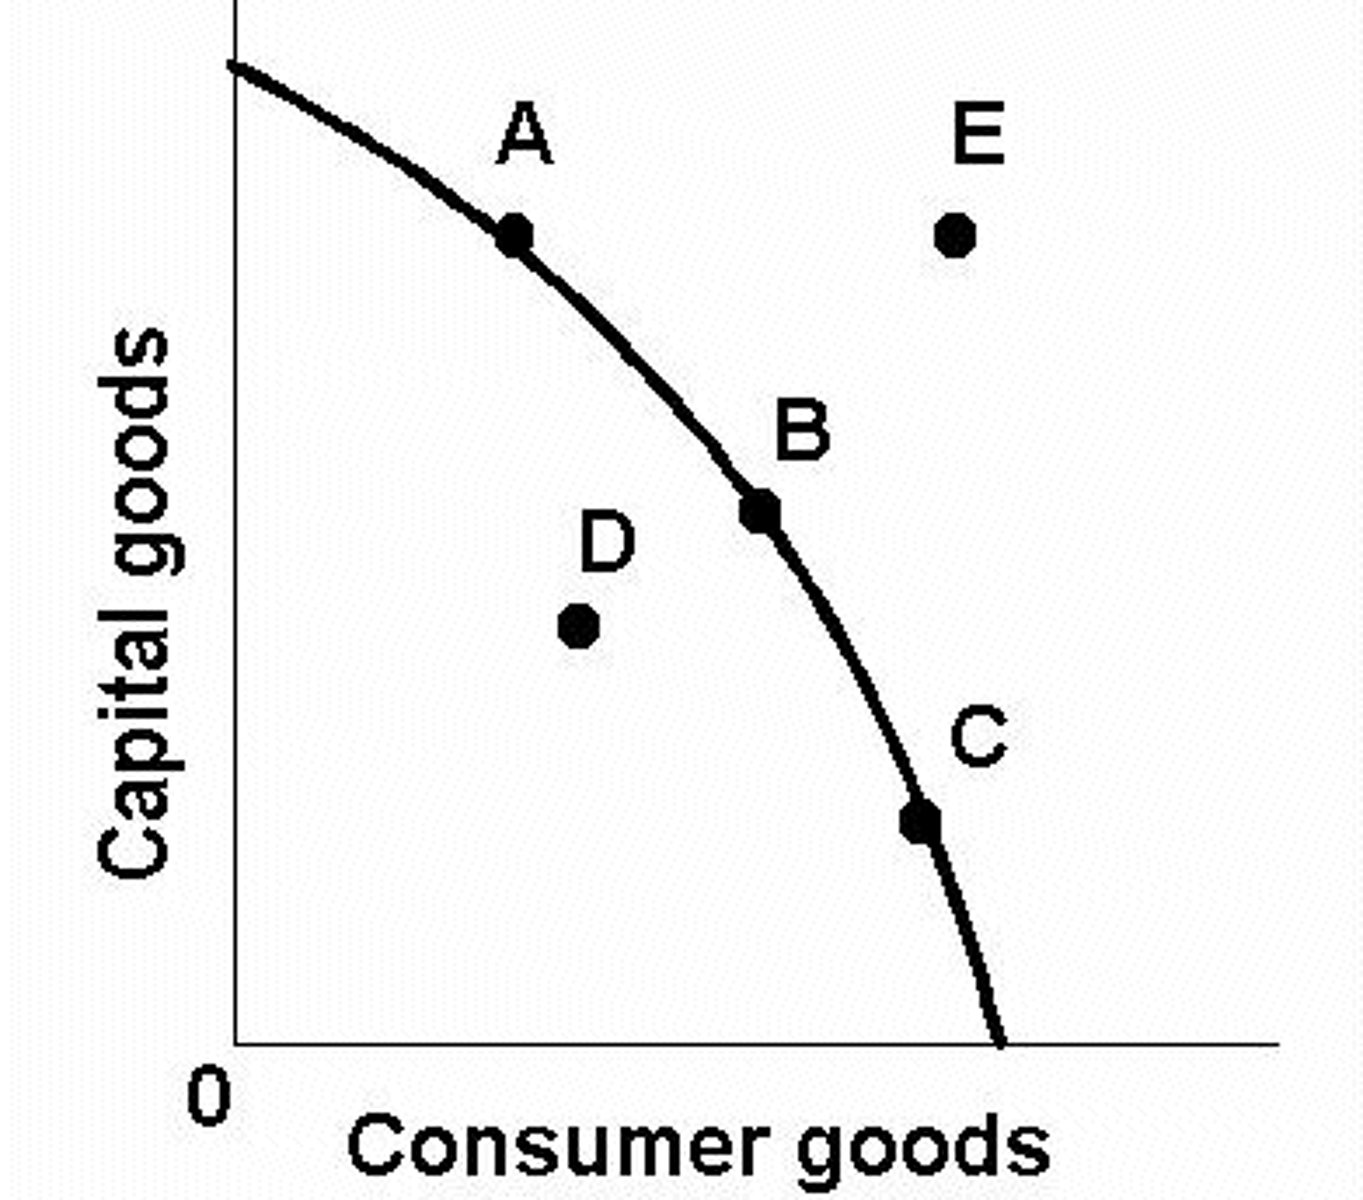
Point inside PPC
Represents inefficient resource use in production.

Point on PPC
Indicates efficient production using all resources.

Point outside PPC
Represents unattainable production levels with current resources.
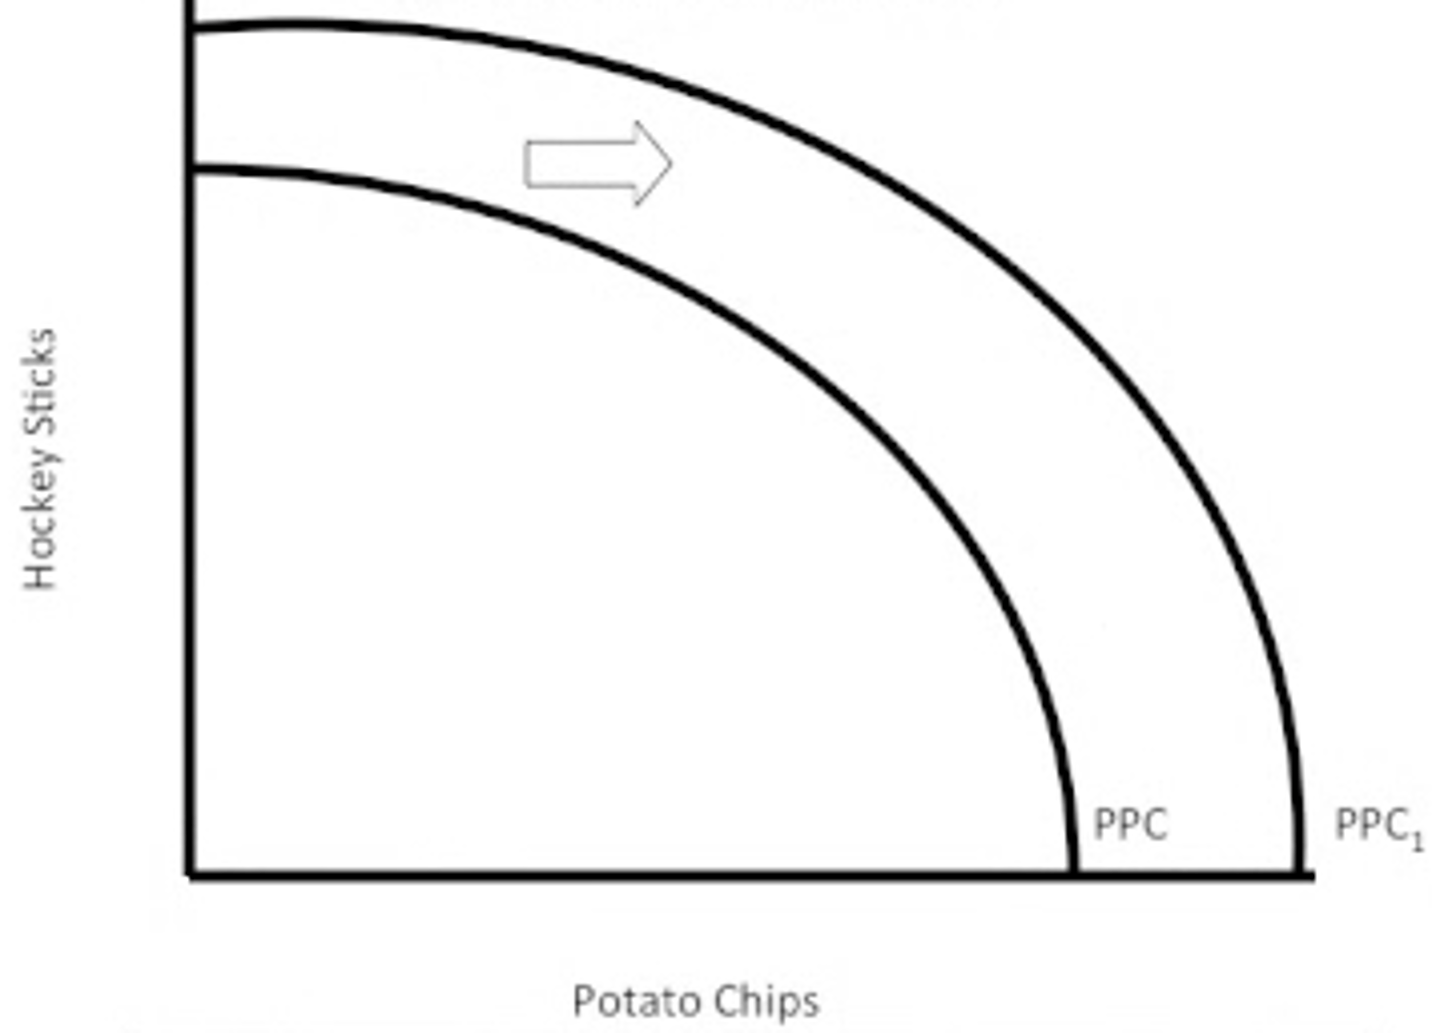
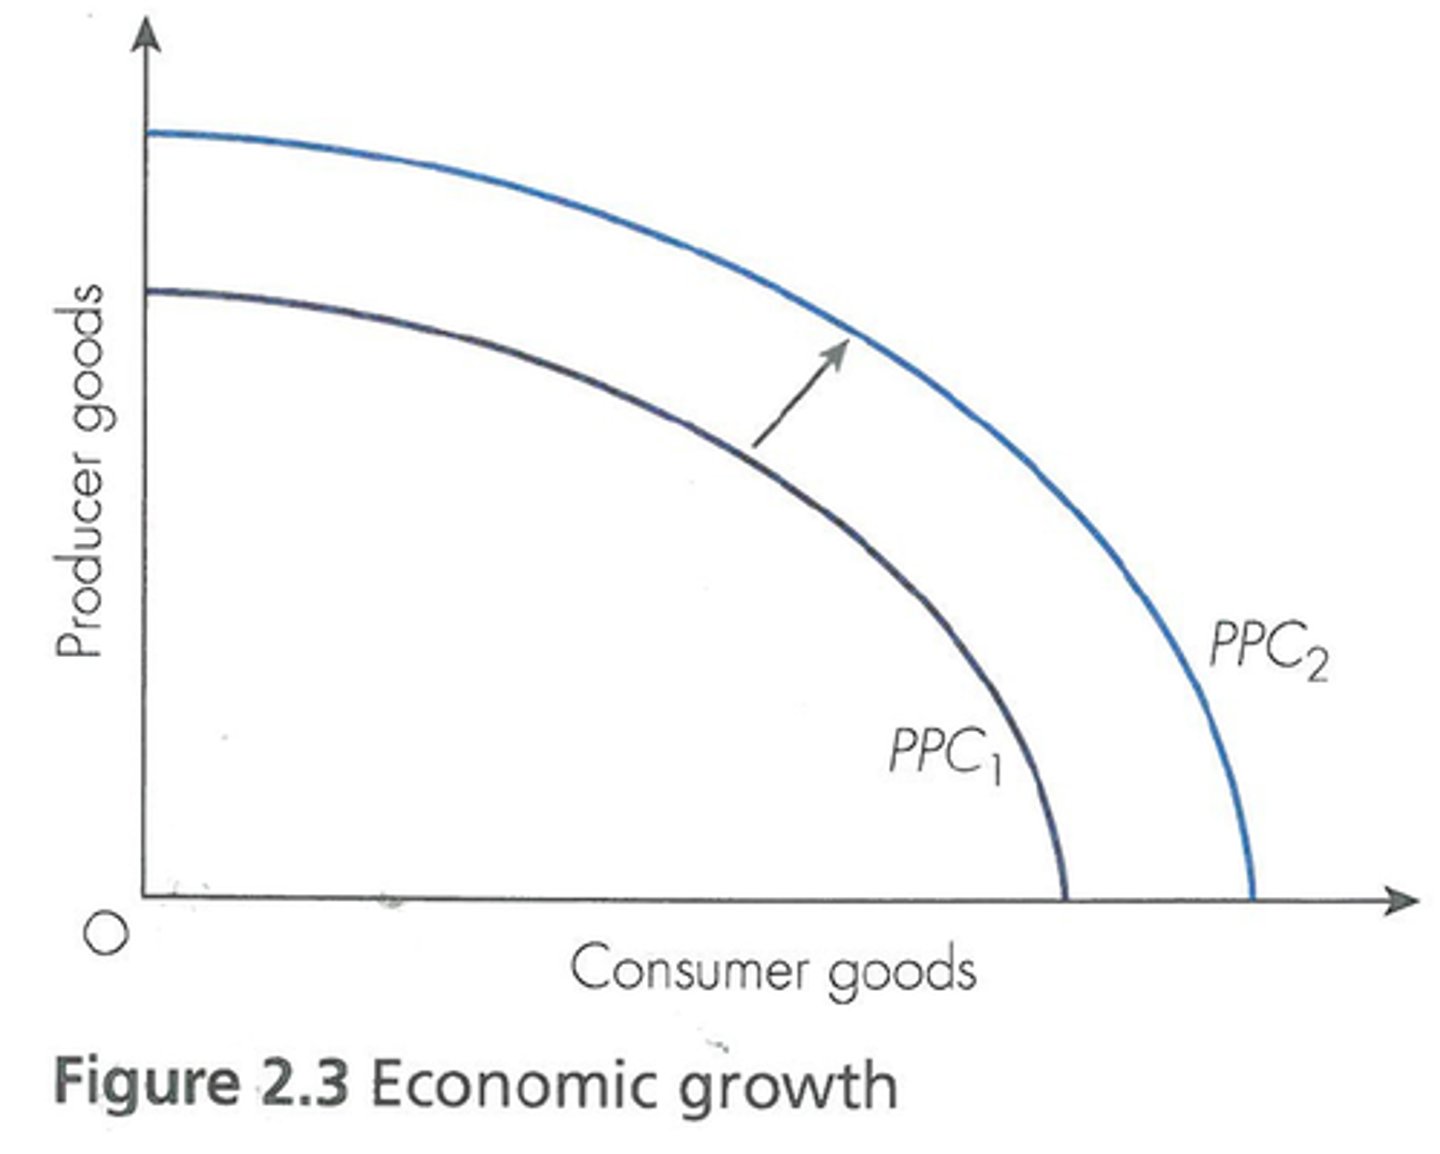
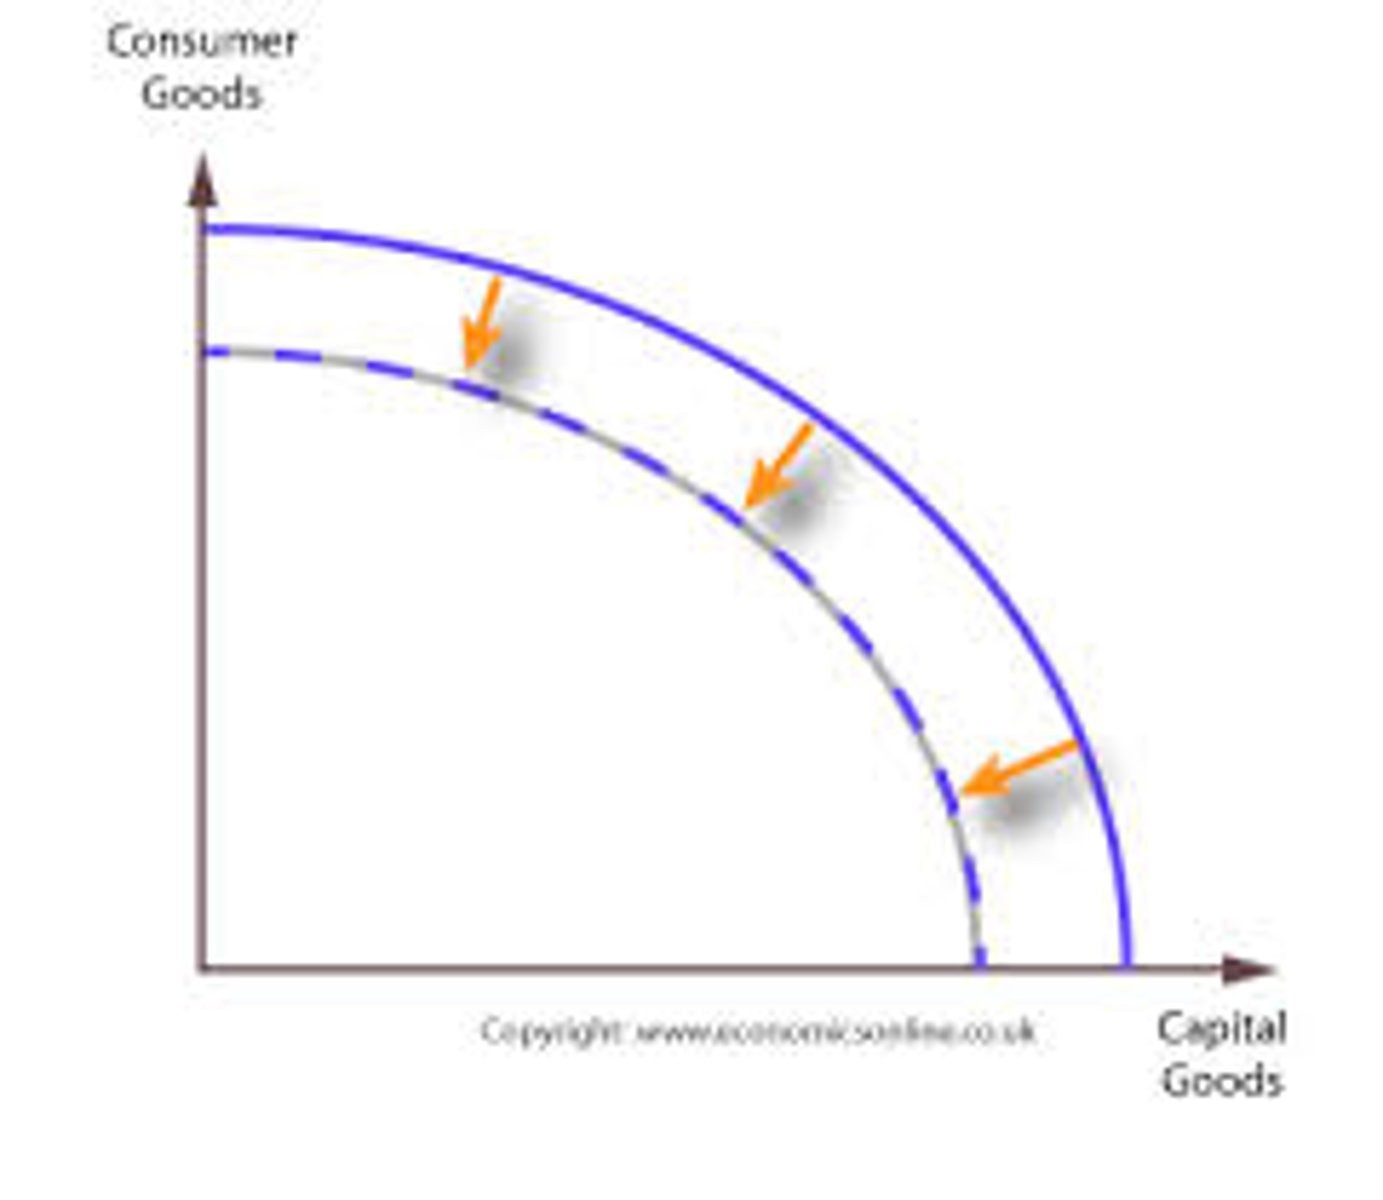
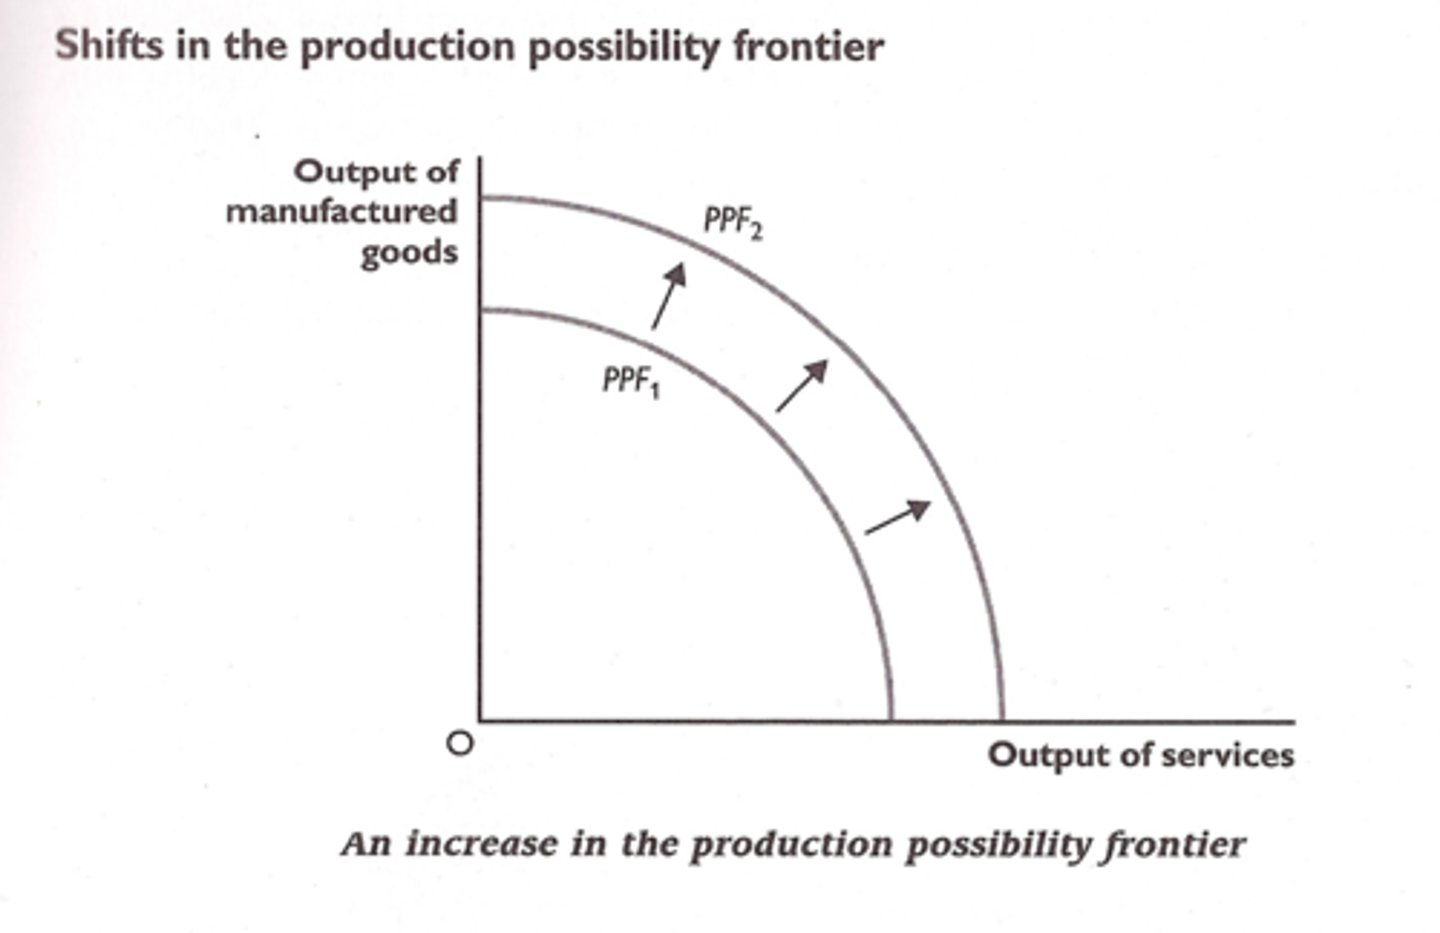
Shift in PPC
Change in output capacity of an economy.

Economic growth
Increase in an economy's capacity to produce goods.
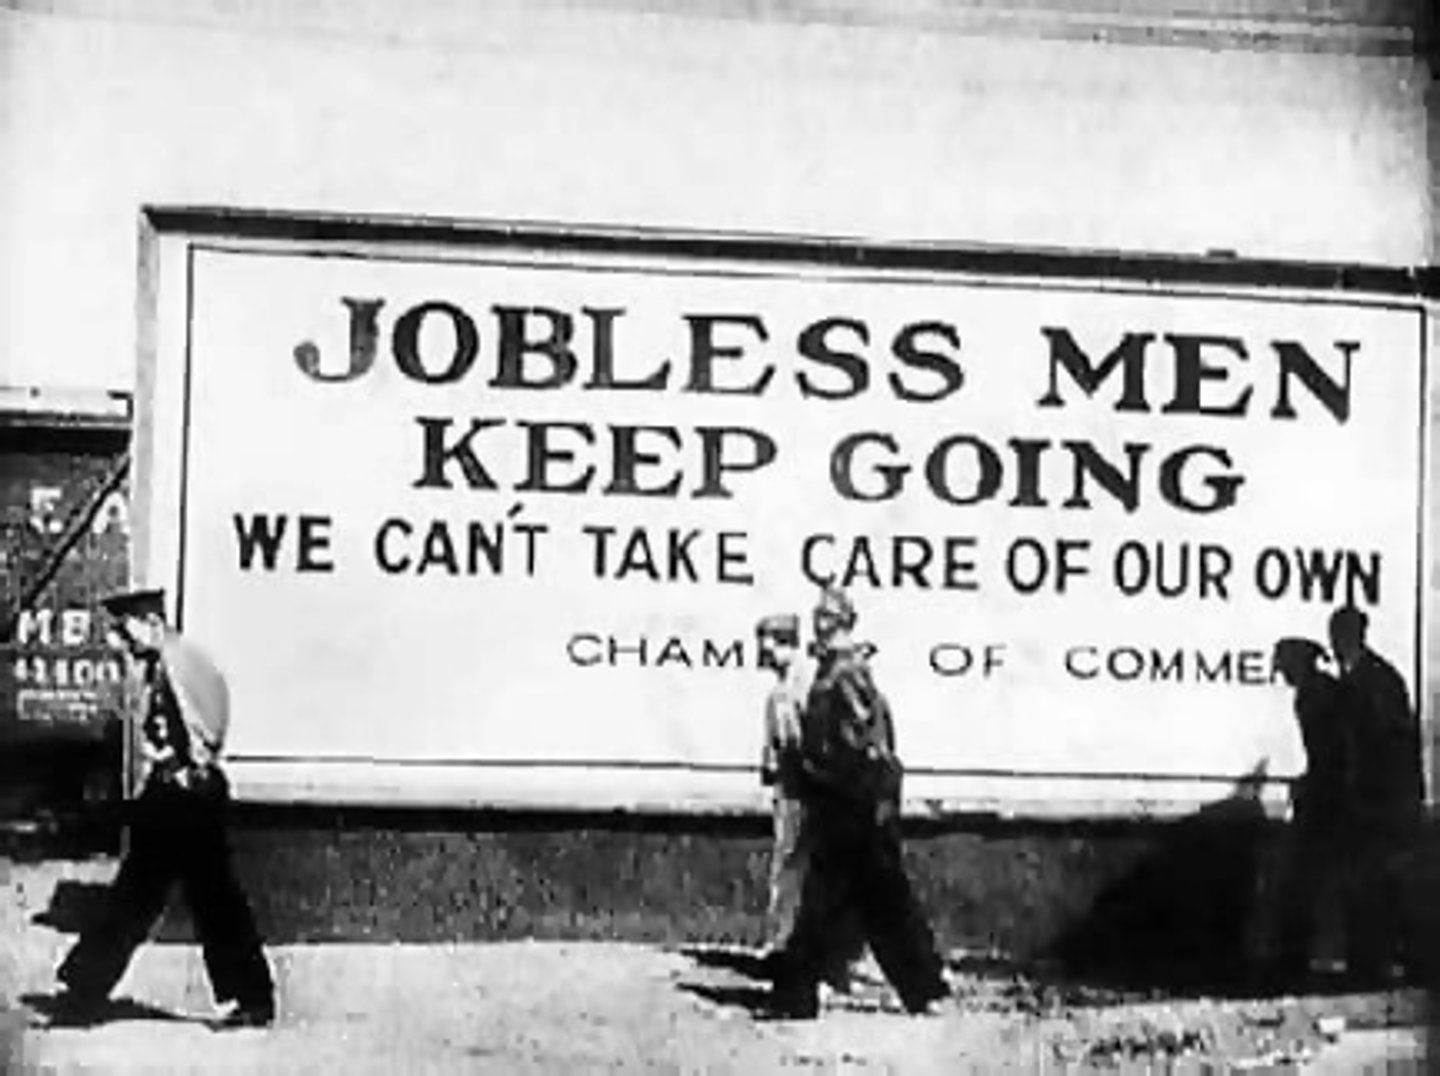
Economic disaster
Significant reduction in an economy's production capacity.
Increase in resources
More inputs available for production, shifting PPC outward.
Decrease in resources
Fewer inputs available, shifting PPC inward.
Technological changes
Advancements that improve production efficiency, shifting PPC outward.
Change in labor force
Alterations in workforce size or skill affecting production.
Human capital
Skills and knowledge of the workforce impacting productivity.

Changes in institutions
Regulatory or structural shifts affecting economic output.
Scarcity
Limited resources versus unlimited wants and needs.
Opportunity cost
Value of the next best alternative forgone.
Trade-off
Sacrifice of one good to produce another.
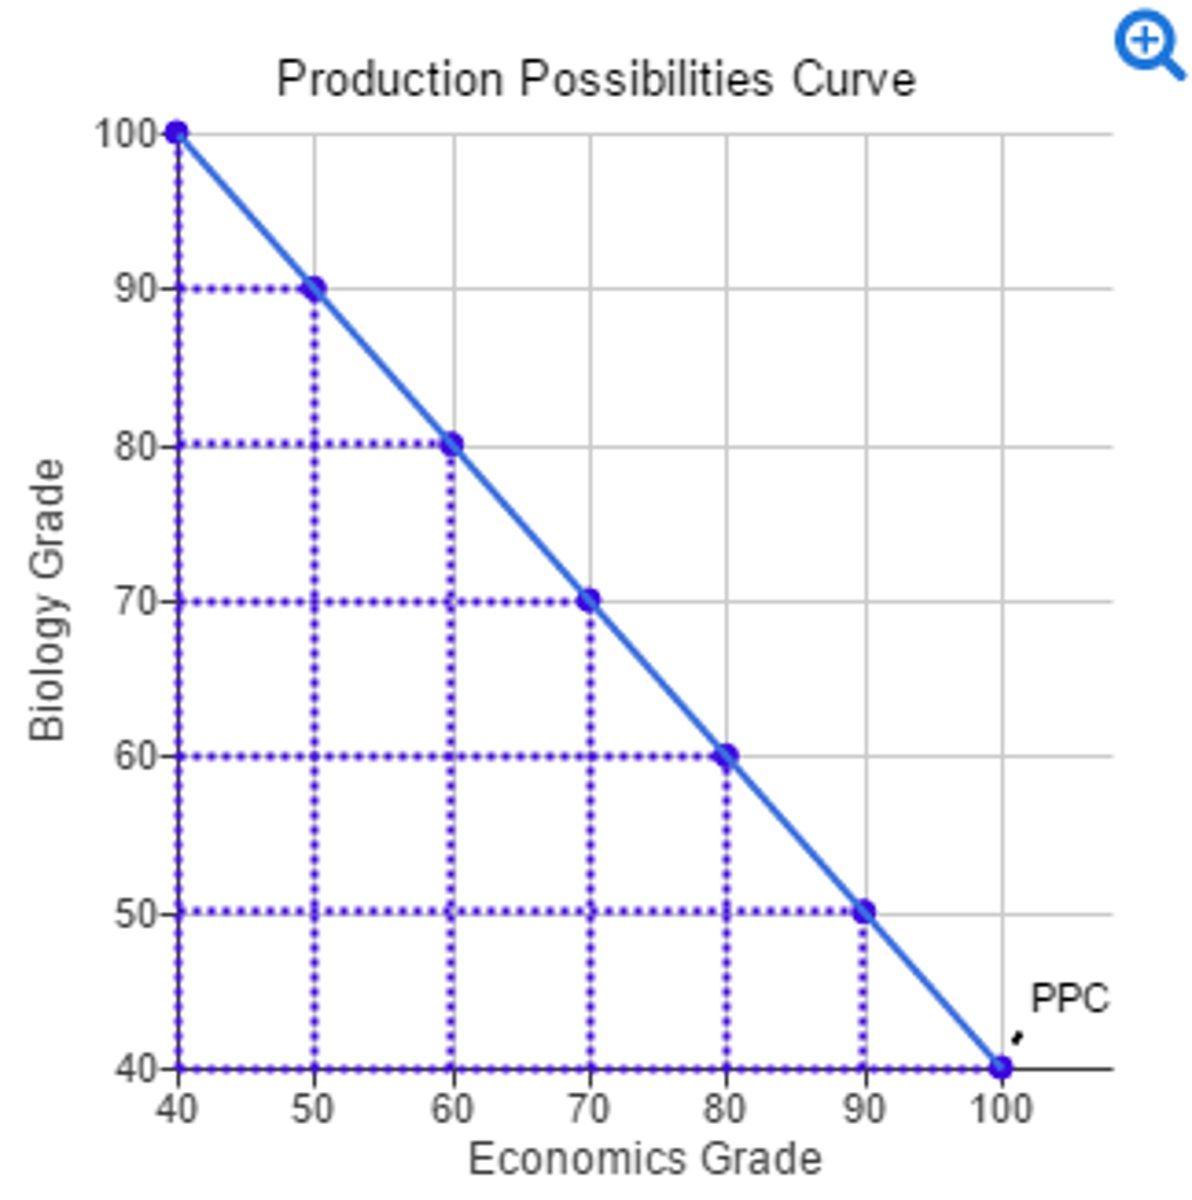
Downward-sloping PPC
Indicates trade-offs between two goods' production.
Efficient production
Maximizing output with available resources.
Inefficient production
Underutilization of resources, represented by points inside PPC.

Unattainable production
Production levels beyond current resource capabilities.
Slope of PPC
Indicates opportunity cost; steeper slope means higher cost.
Production Possibility Frontier (PPF)
Another term for the Production Possibility Curve.