Machine Learning Exam 2 (with examples)
1/192
There's no tags or description
Looks like no tags are added yet.
Name | Mastery | Learn | Test | Matching | Spaced | Call with Kai |
|---|
No analytics yet
Send a link to your students to track their progress
193 Terms
Data Understanding
- examining key summary characteristics
- find problems (invalid values, missing values, unexpected distributions, outliers)
- visualize data
Single variable summaries
mean and standard deviation
mean
simple average of all the values
standard deviation
spread of the distribution, most often needed in the normal distribution
Descriptive statistics
organize, describe, and summarize data to help you better understand it
examples of descriptive statistics
frequency, min/max, centra tendency (mean, median,mode), dispersion or variability (range, variable, SD)
What descriptive statistics are good for
- finding unusual data
- screening the range and shape of the data
- determining the central tendency
- drawing preliminary conclusions
FREQ procedure
proceeds a one-way frequency table for each variable named in the tables statement
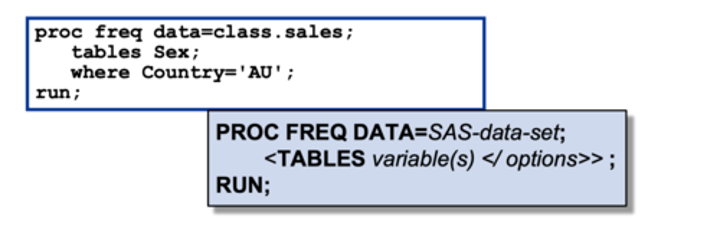
TABLES statement
defines the variable in a proc FREQ procedure
If the TABLES statement is omitted, a one-way frequency table is produced for every variable in the data set. This can produce a large amount of output and is seldom preferred.
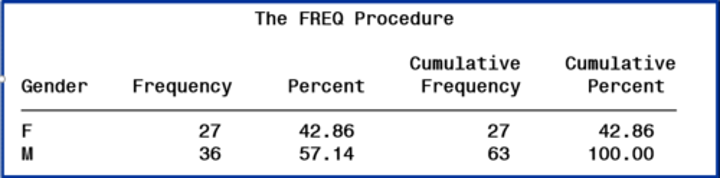
FREQ procedure outputs
The default output includes frequency and percentage values, including cumulative statistics.
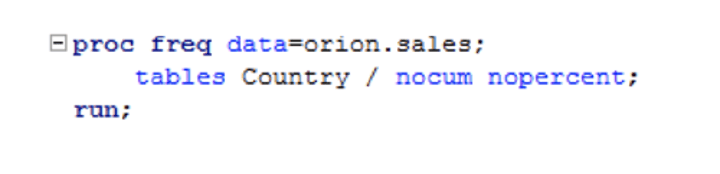
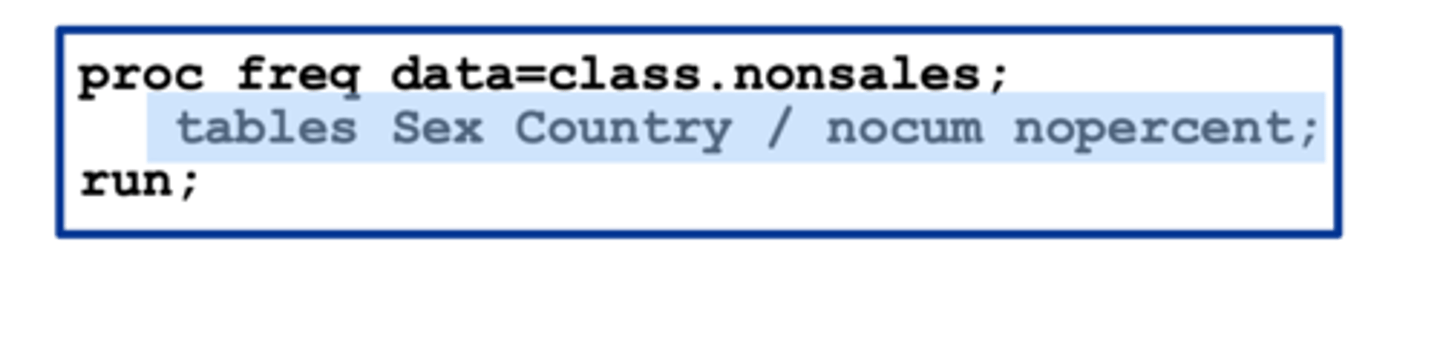
2 options to suppress statistics in a FREQ procedure (used in the TABLES statement)
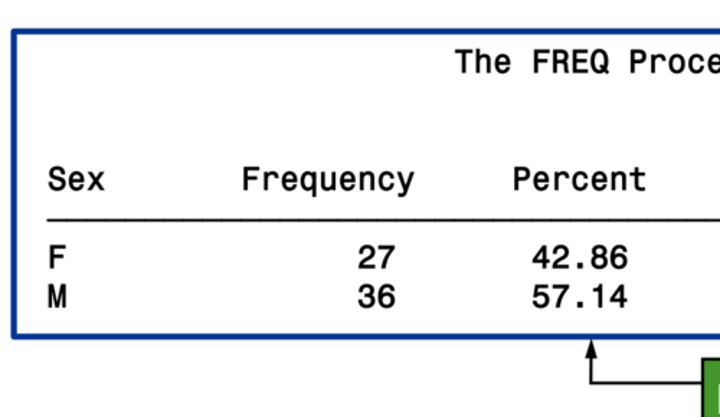
nocum
nopercent
suppress statistics
use options in the tables statement to suppress the display of selected default statistics
(tables variable(s) / options;)
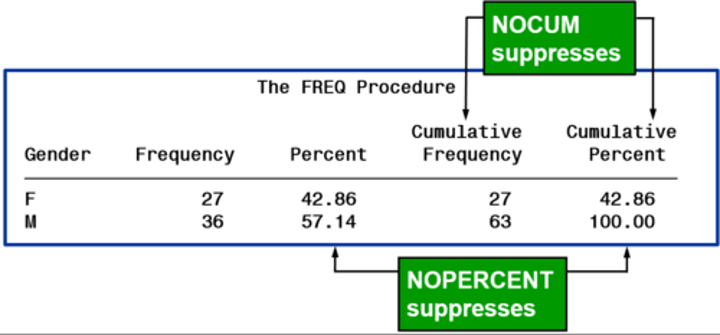
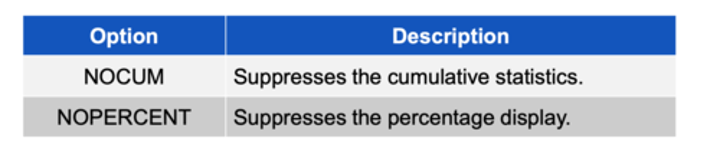
nocum
suppress the cumulative statistics
- cumulative frequency
- cumulative percent
both are standard with FREQ procedure
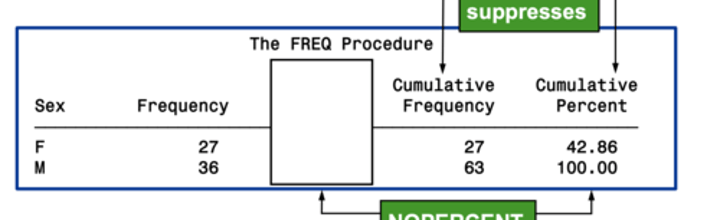
nopercent
surpasses the percentage display
standard with REQ procedure
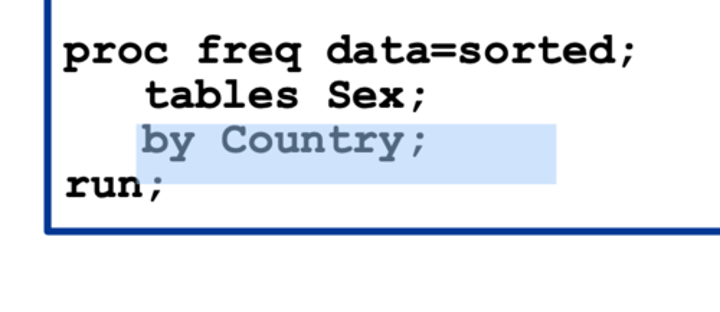
BY statement
used to request separate analyses for each BY group
- the data set must be sorted or indexed by the variable(s) named in the BY statement
goes in a proc freq
cross-tabulation table
an asterisk between two variables generates a two-way frequency table, or cross tabulation table
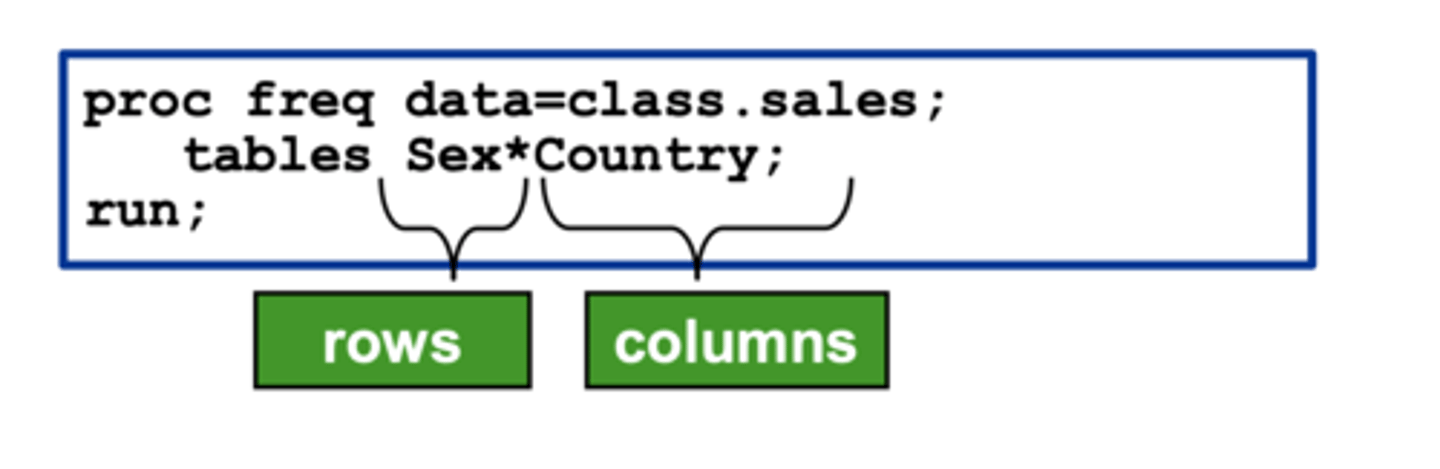
3 ways to say cross-tabulation table
1. cross-tabulation table
2.contingency table
3.. two-way frequency table
cross-tabulation table output
a single table with statistics for each distinct combination of values of the selected variables.
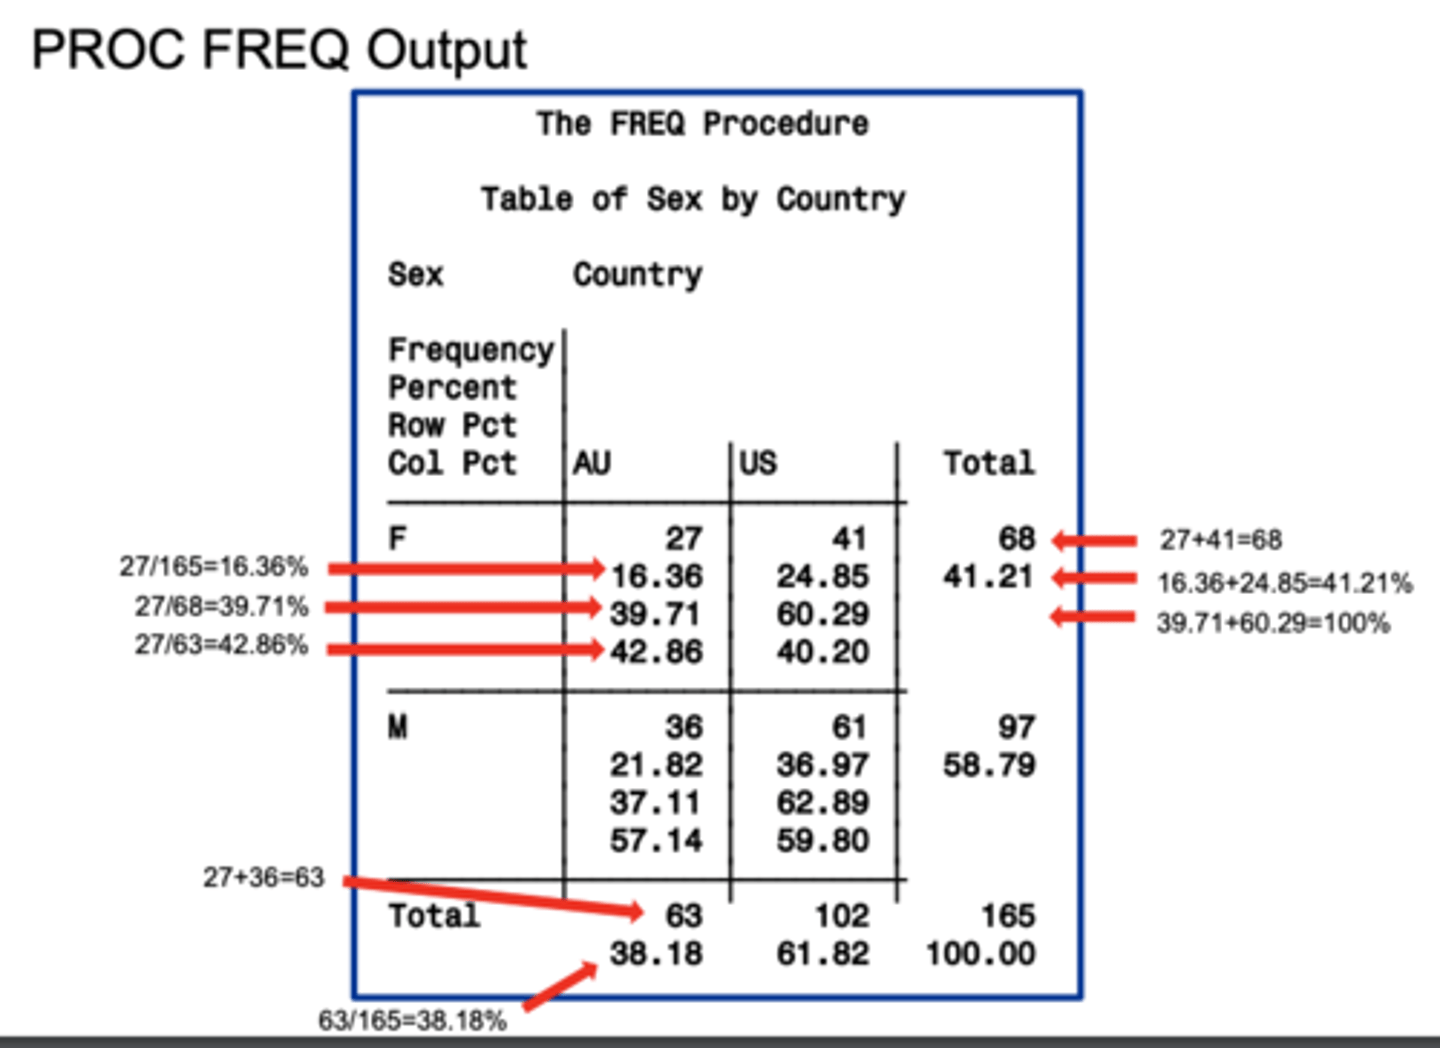
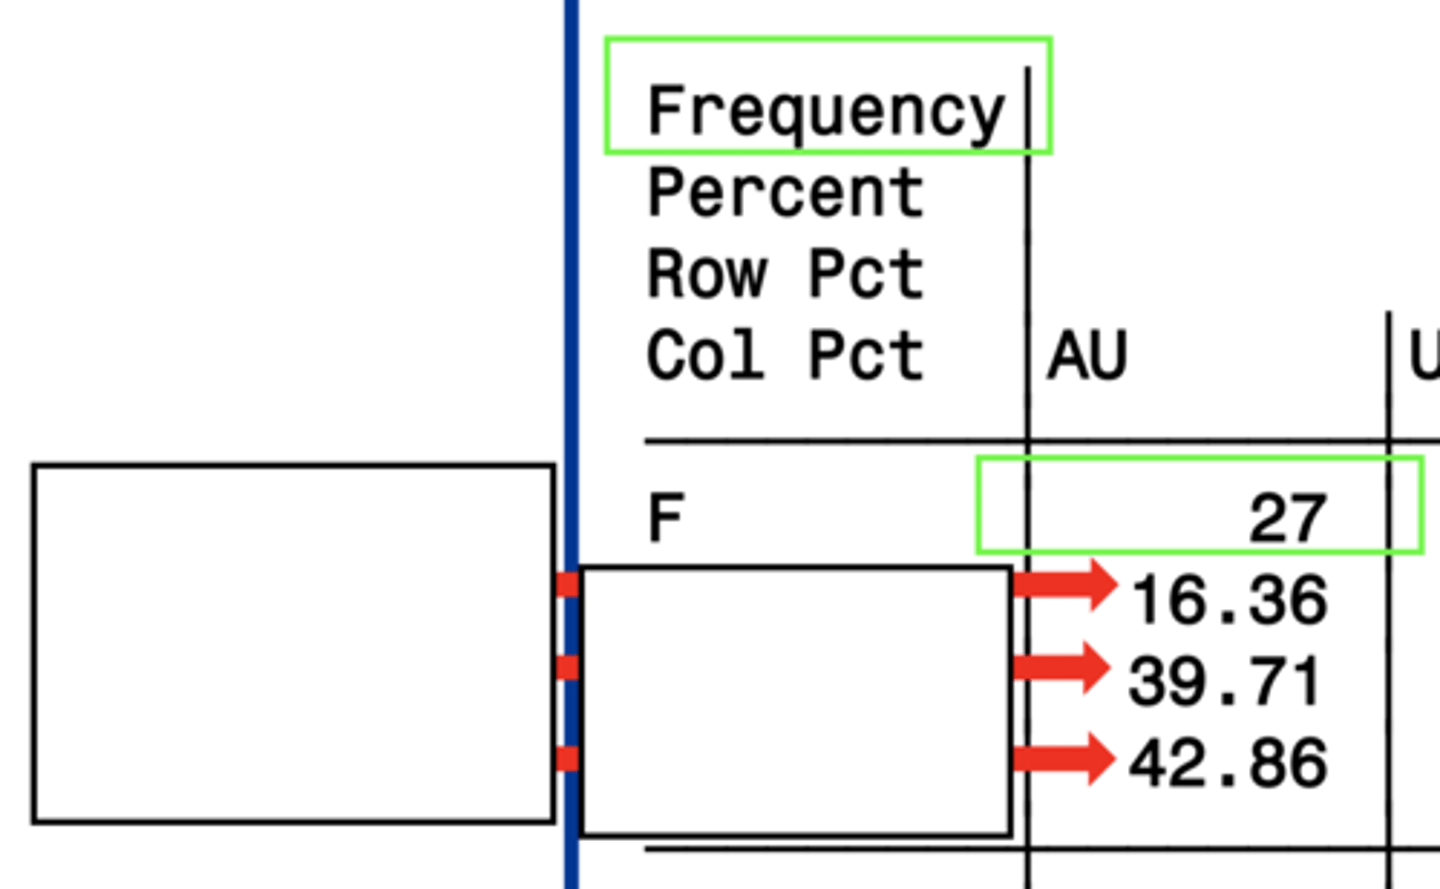
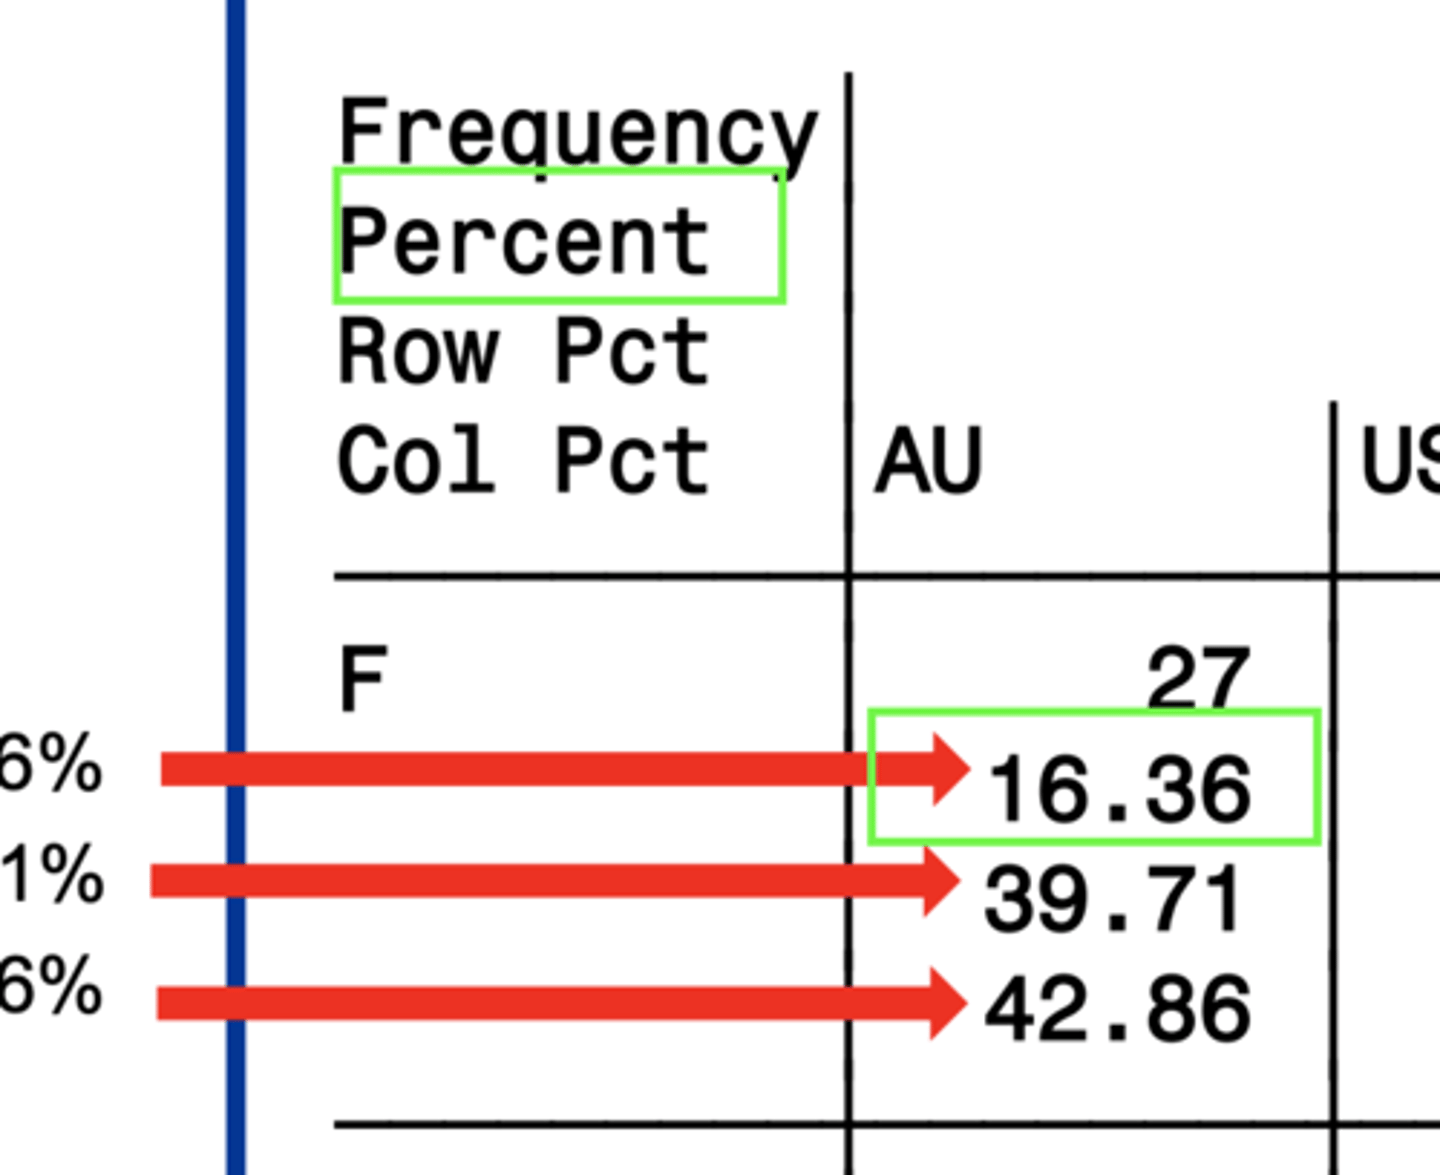
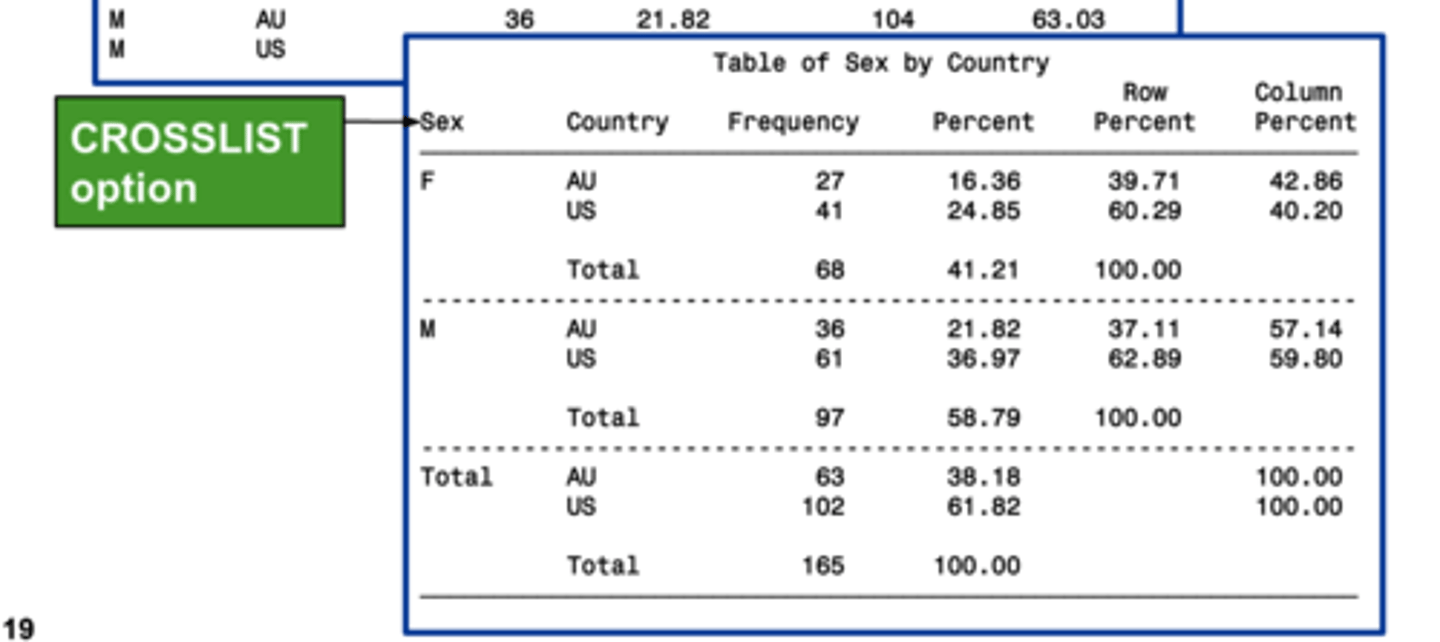
4 standard statistics on cross-tabulation table output
1. Frequency
2. Percent
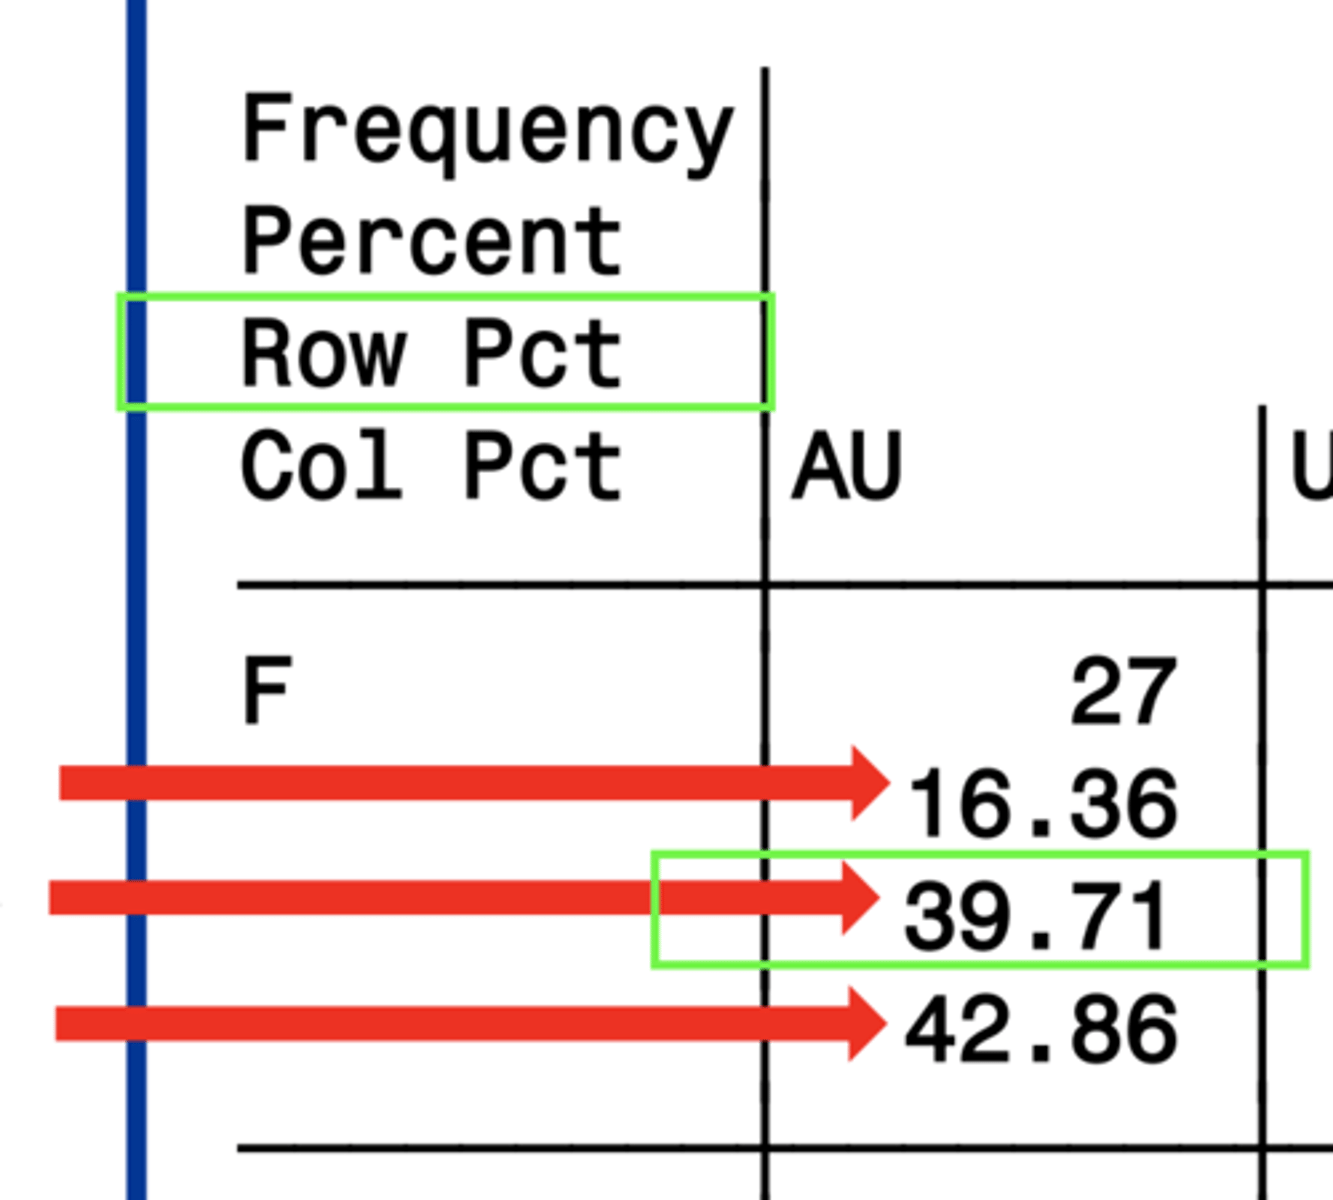
3. row pct
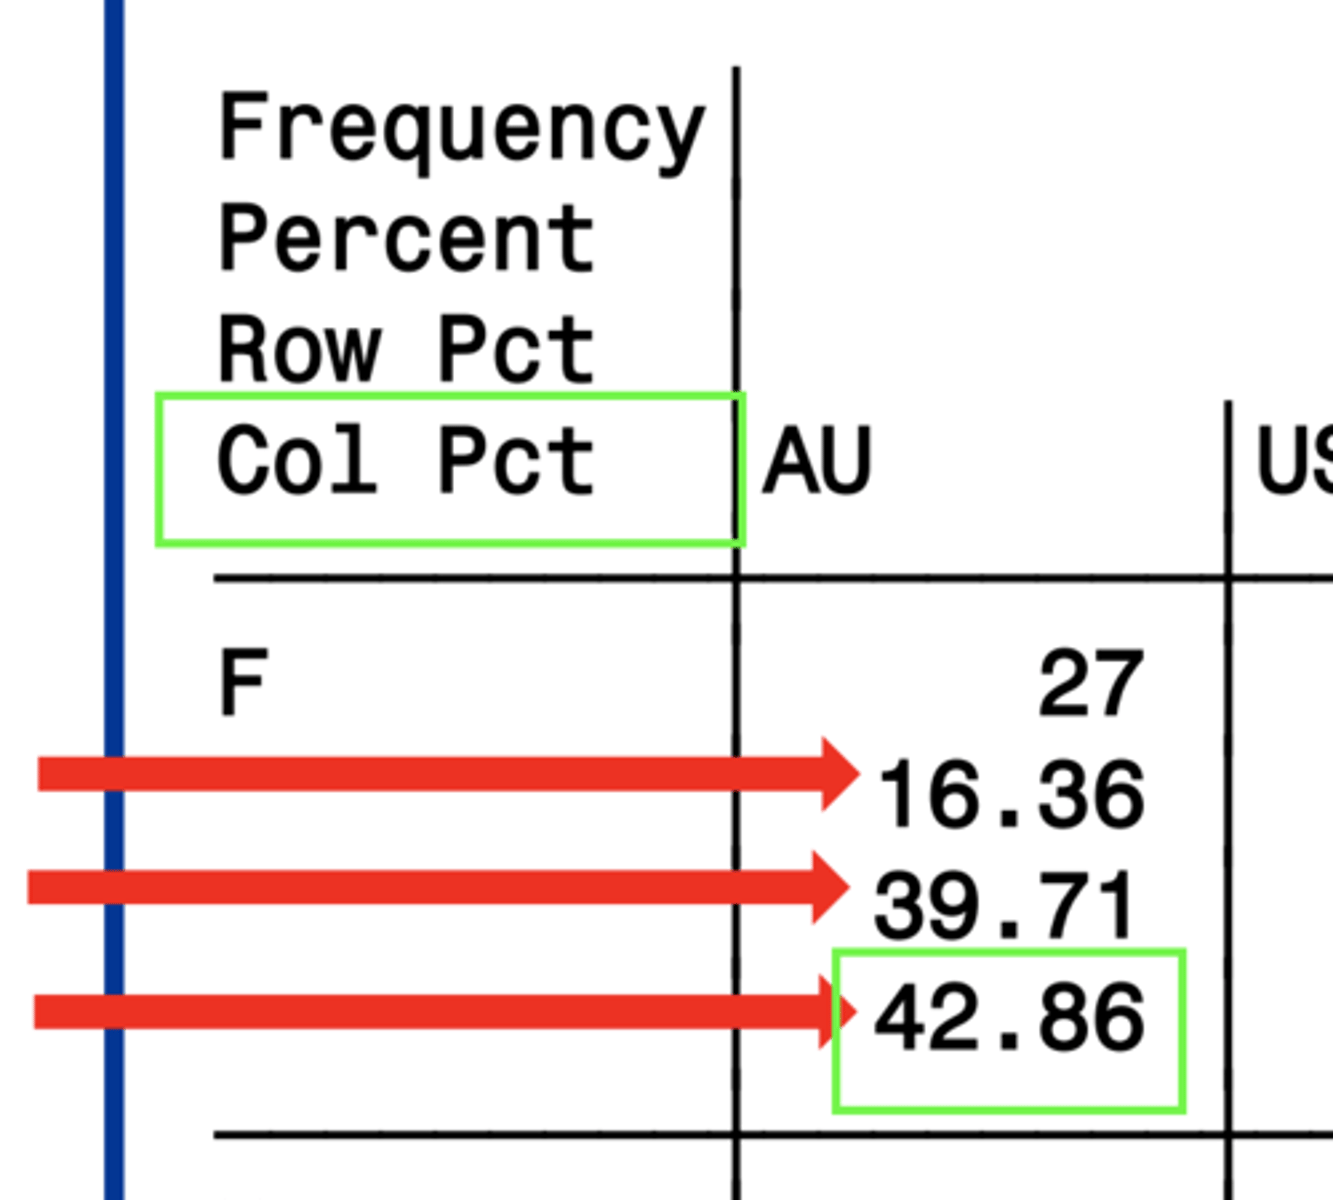
4. col pct
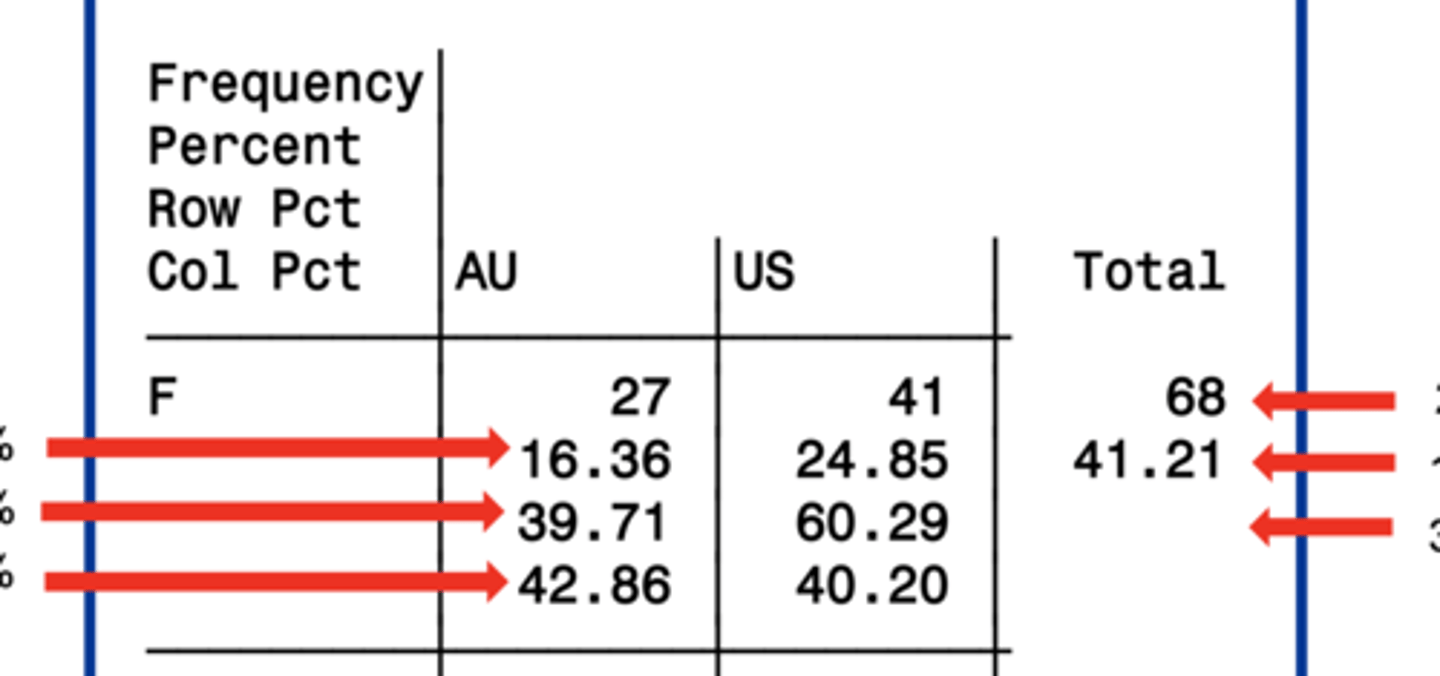
Frequency
the numbers that meet the criteria for the given box
Percent
the percentage of the total that meet the criteria for the given box
row pct
the percentage of the row that meet the criteria for the given box
col pct
the percentage of the column that meet the criteria for the given box
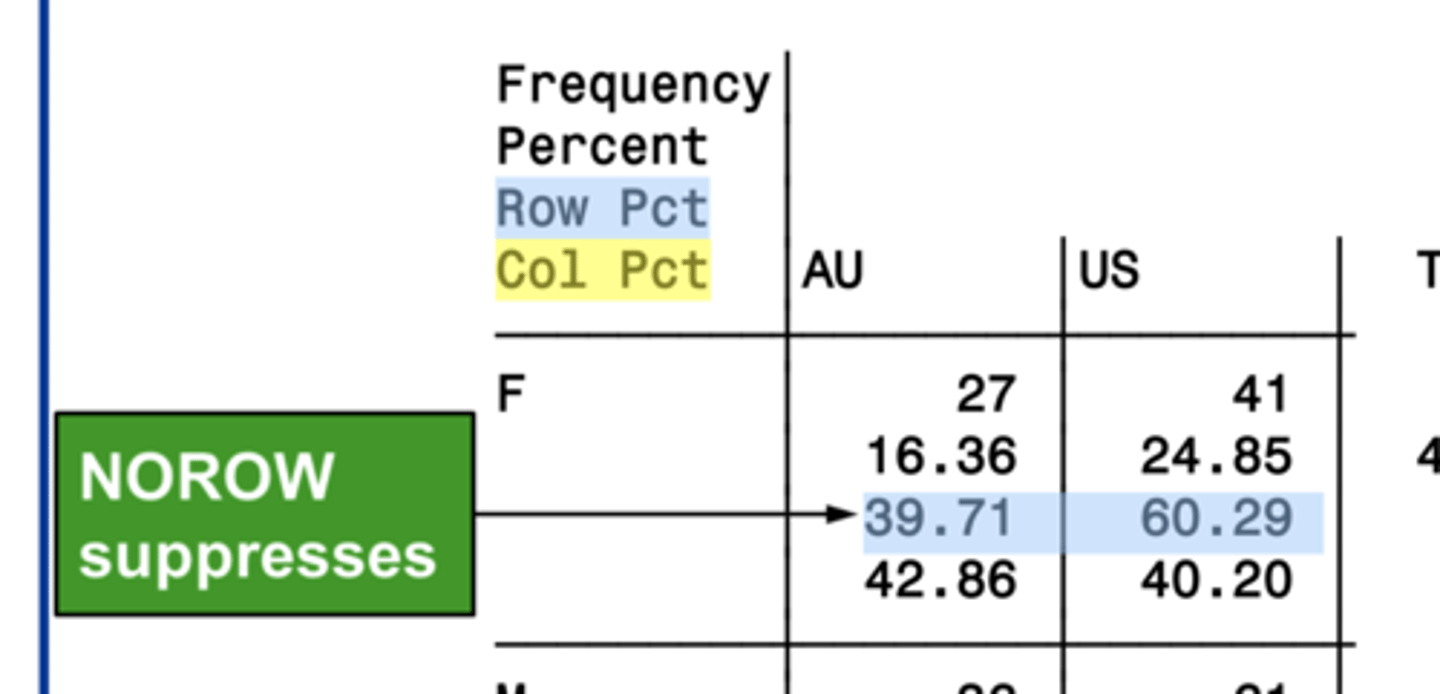
4 options to suppress statistics in a cross-tabulation table
norow
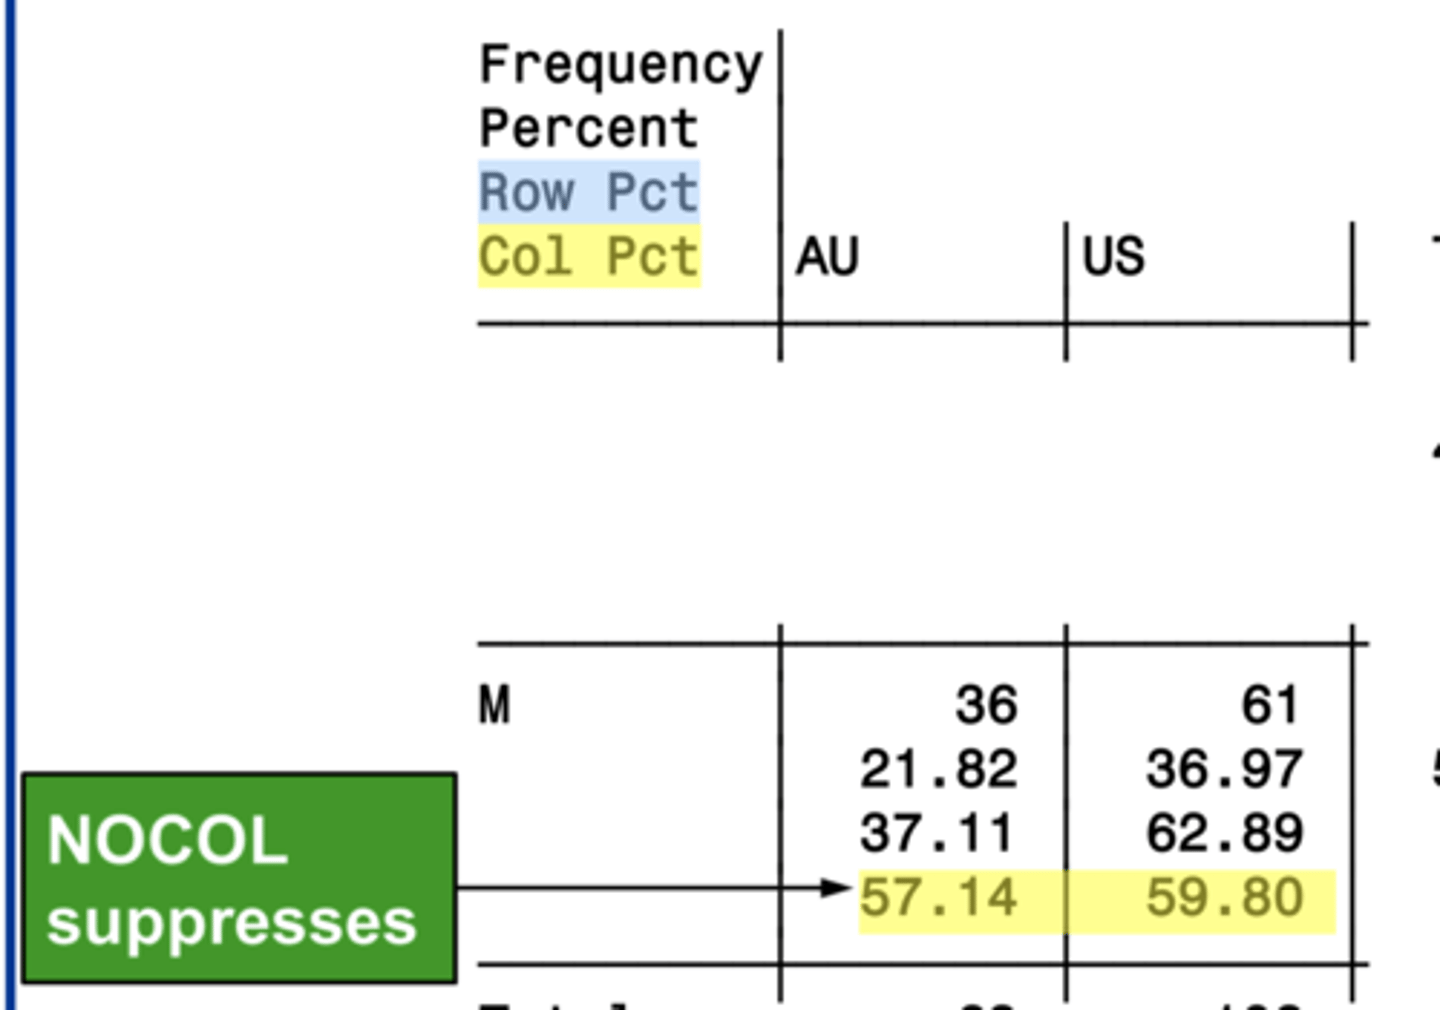
nocol
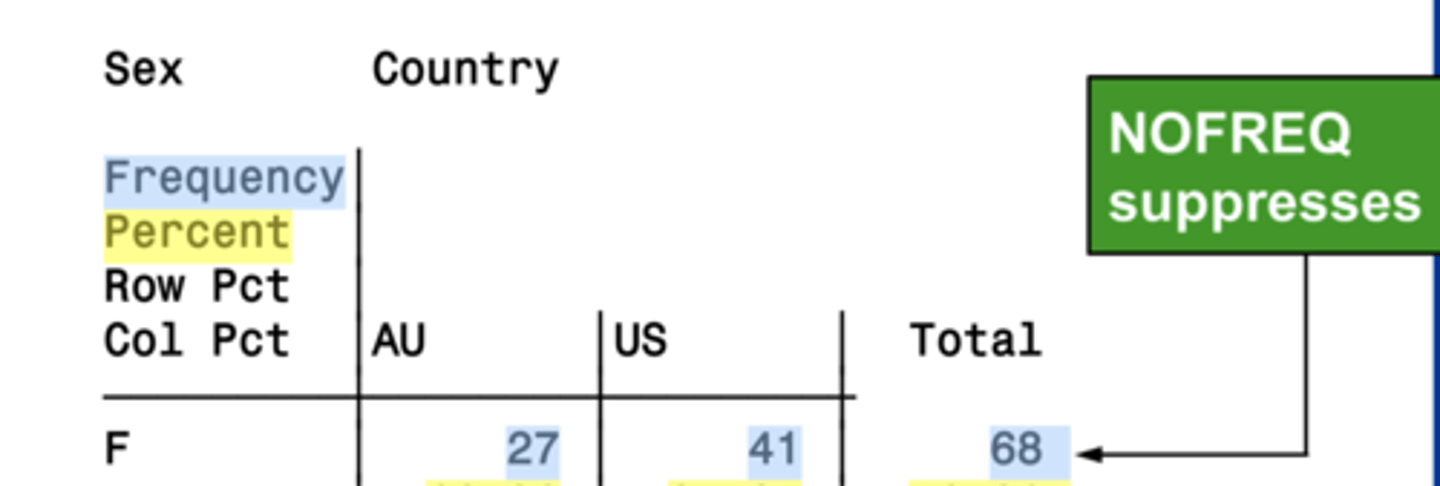
nofreq
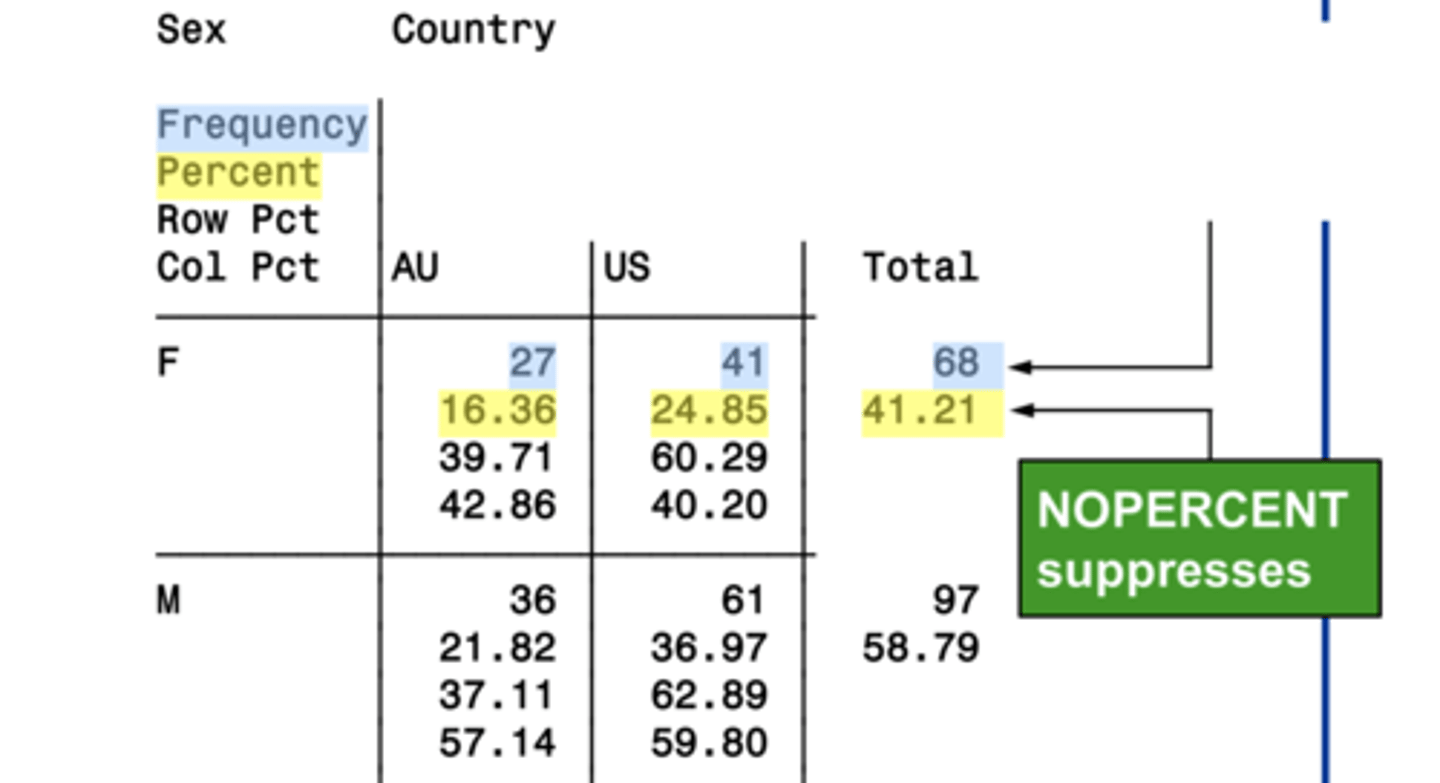
nopercent
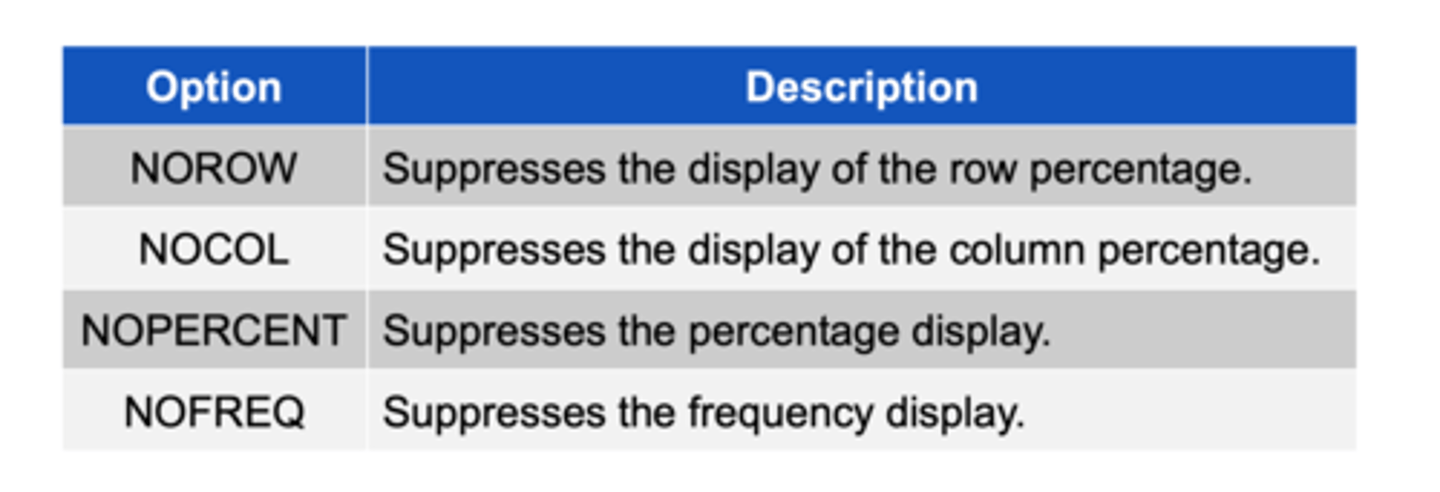
norow
suppresses the display of the row percentage
nocol
suppresses the display of the column percentage.
nofreq
suppresses the frequency display
nopercent
suppresses the percentage display
2 options to change the look of the cross-tabulation table output
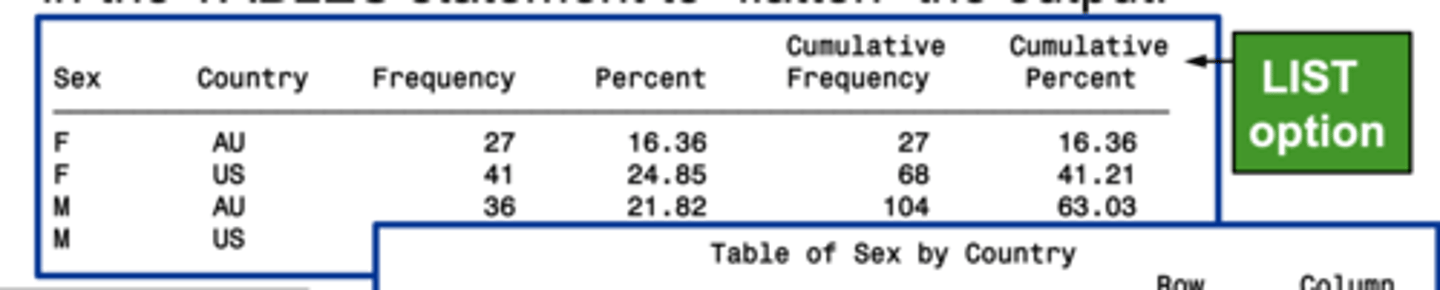
1. LIST
2. CROSSLIST
Included in TABLES statement
LIST
Makes the output look like a list
CROSSLIST
Displays the crosstabulation results in a segregated form
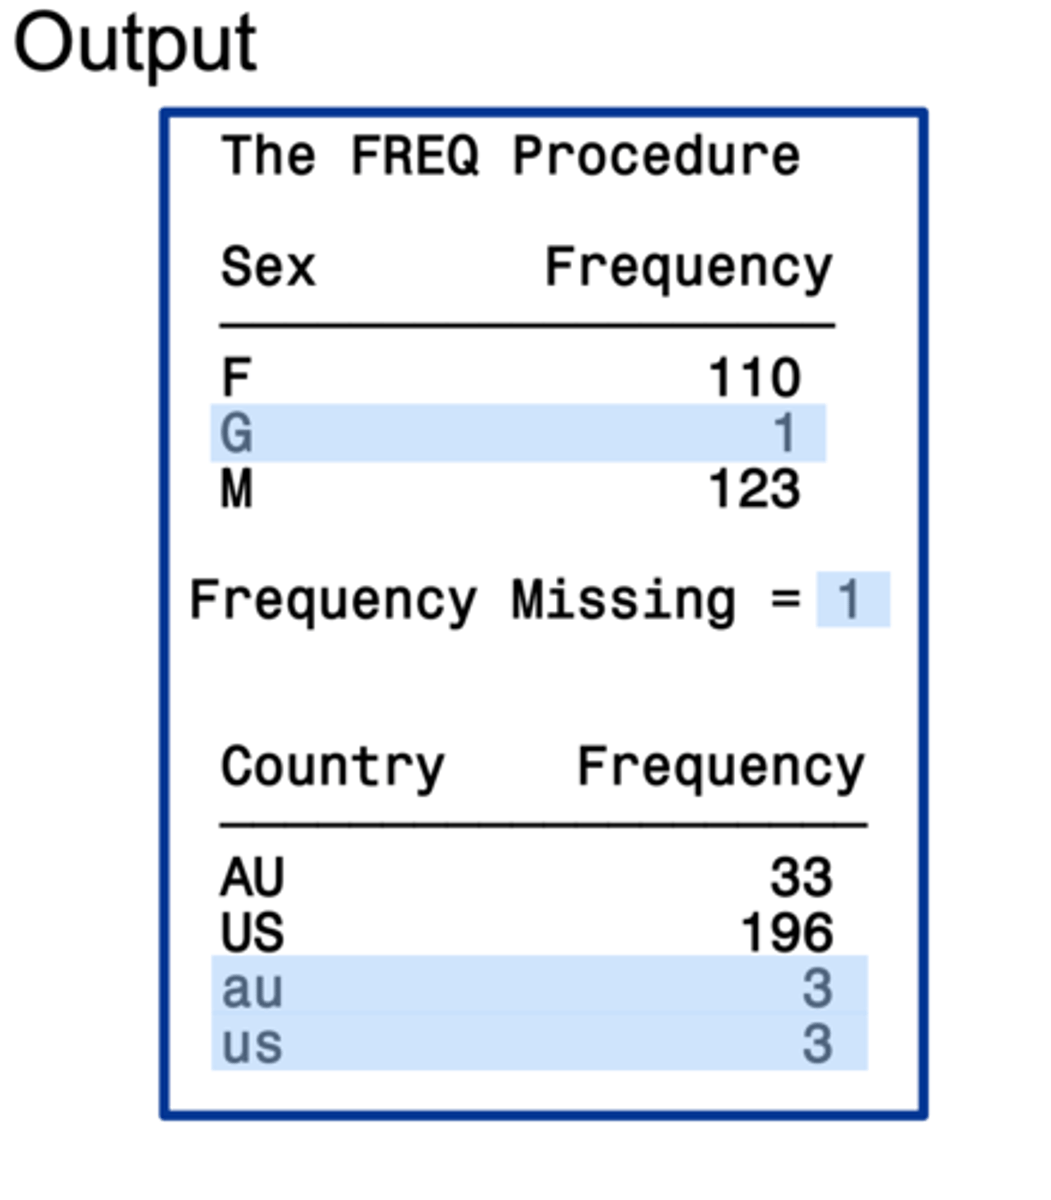
FREQ procedure with multiple variables (in TABLES statement) but no asterisks (*)
lists all discrete values for a variable and reports missing values
FREQ procedure with multiple variables (in TABLES statement) but no asterisks (*) output
Like single proc FREQ but doubled
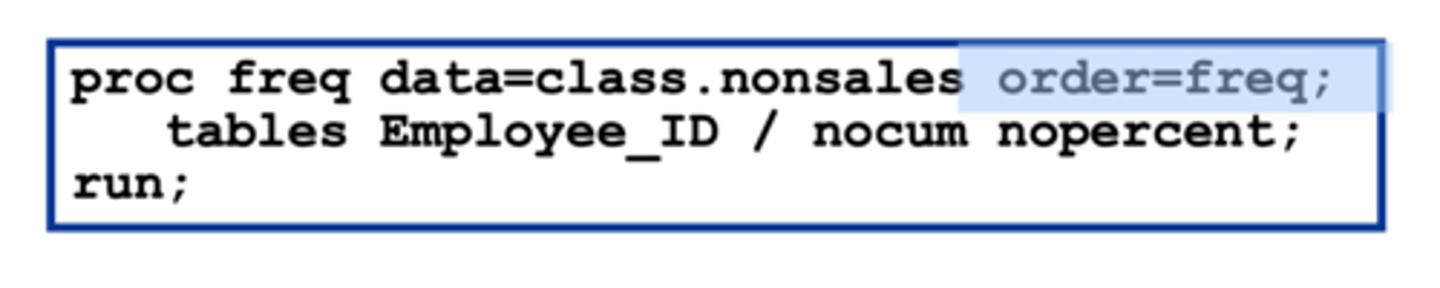
order = freq
displays the results in descending frequency order
included in proc FREQ statement
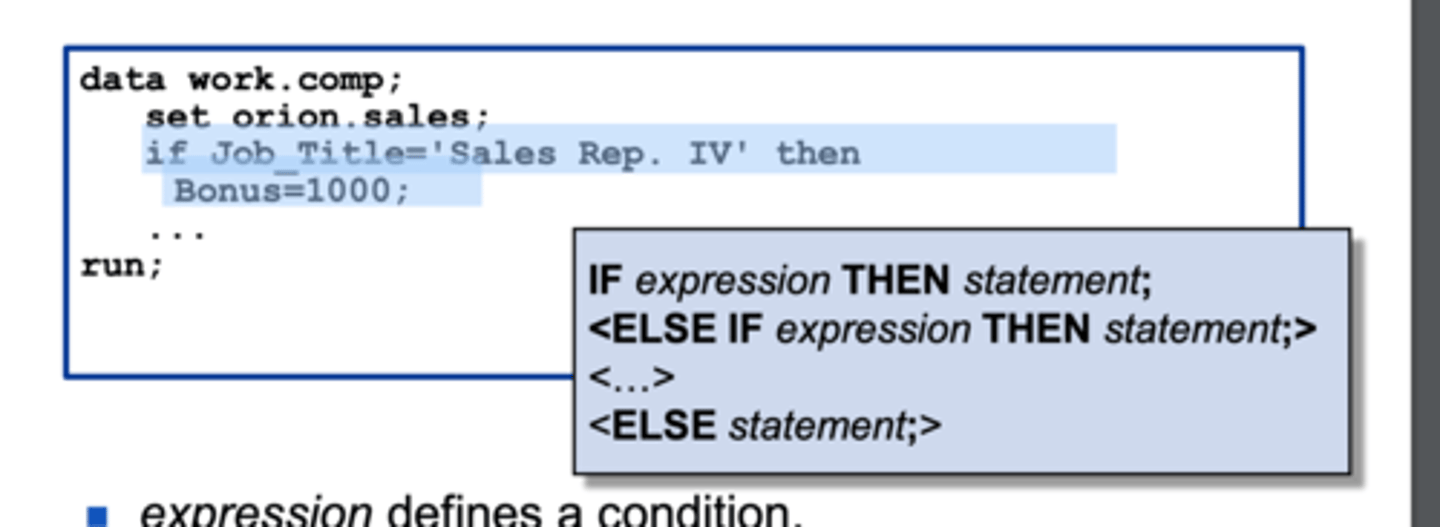
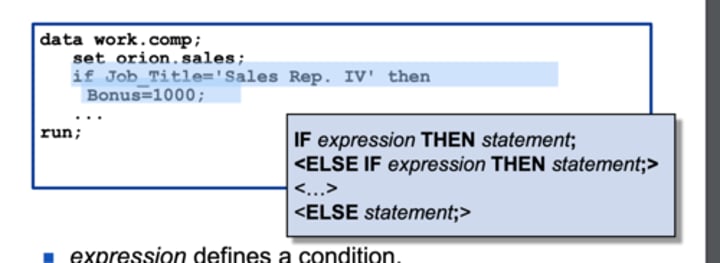
if-then statement
executes a SAS segment for observations that meet a specific condition
- defines a condition
- statement can be any executable SAS statement
- if expression is true, then statement executes
Fixing the data
must fix all problems in the data set and have a reason to fix them
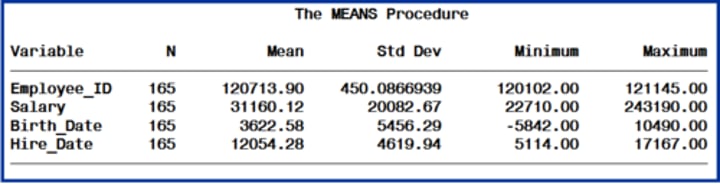
means procedure
summary reports with descriptive statistics
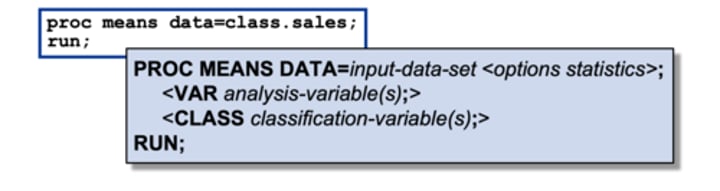
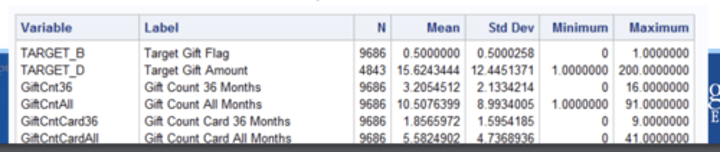
PROC MEANS output
Includes descriptive stats (mean, std dev, min, max)
analysis variables
numeric variables for which statistics are to be computed
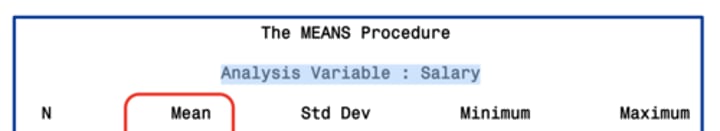
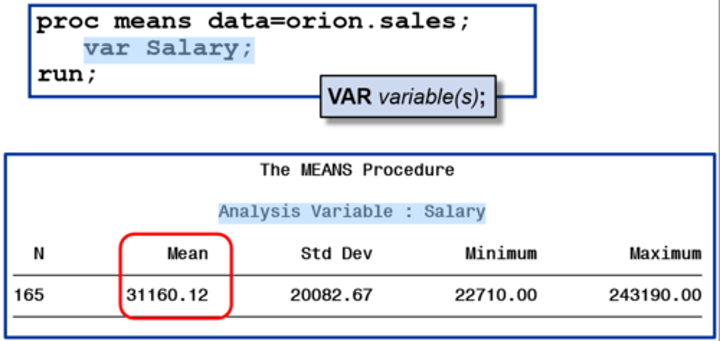
var statement
identifies then analysis variable (or variables) and their order in the output
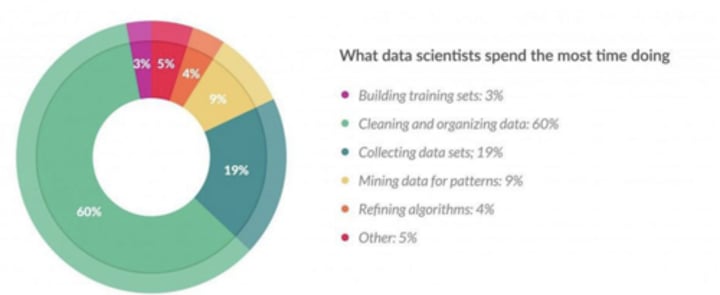
Data Preparation
Hardest most time consuming part
Takes 60-90% of the time
Most important
How models are wrong
Variable Cleaning
- incorrect variables
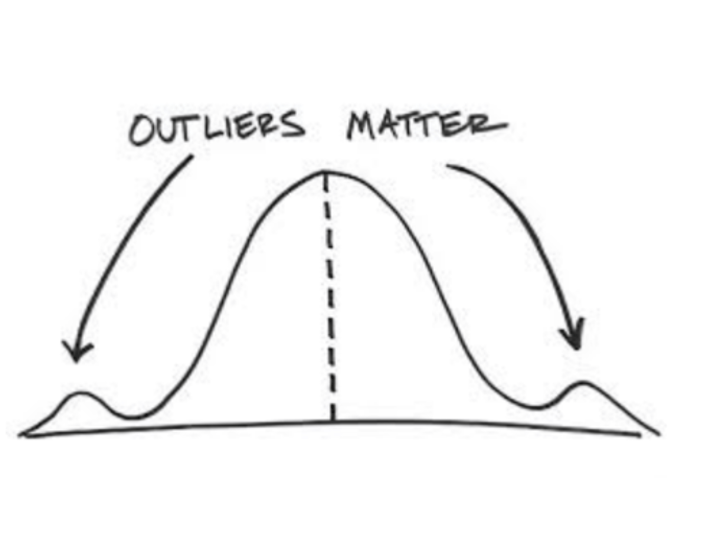
- outliers (remove, transform, bin, leave them)
- missing values

3 Types of missing values
1.MCAR
2.MAR
3.MNAR
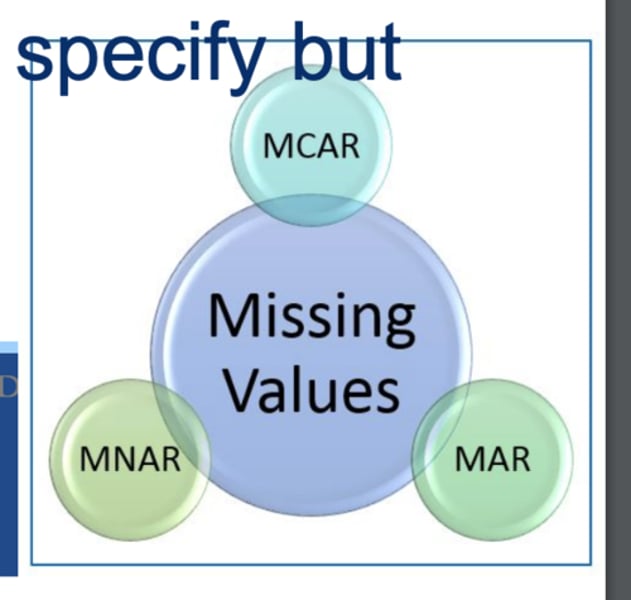
MCAR
Missing Completely At Random
- no way to determine what it should be

MAR
Missing at random
- not completely random

MNAR
missing not at random
- can probably determine what it should be
- something someone doesn't want to specify but is implied

2 ways to deal with missing values
1.Listwise delete them
2. Impute a value
listwise deletion
- delete missing values all together
- risk of biasing data

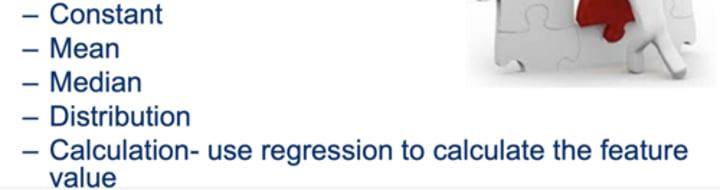
impute a value
Use a/the (constant, mean, median, distribution, calculation) to fill in missing values
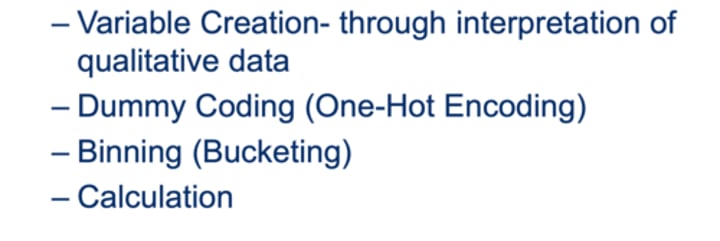
feature engineering
adds to the data by creating a variable from something that already exists
- variable creation
- dummy coding
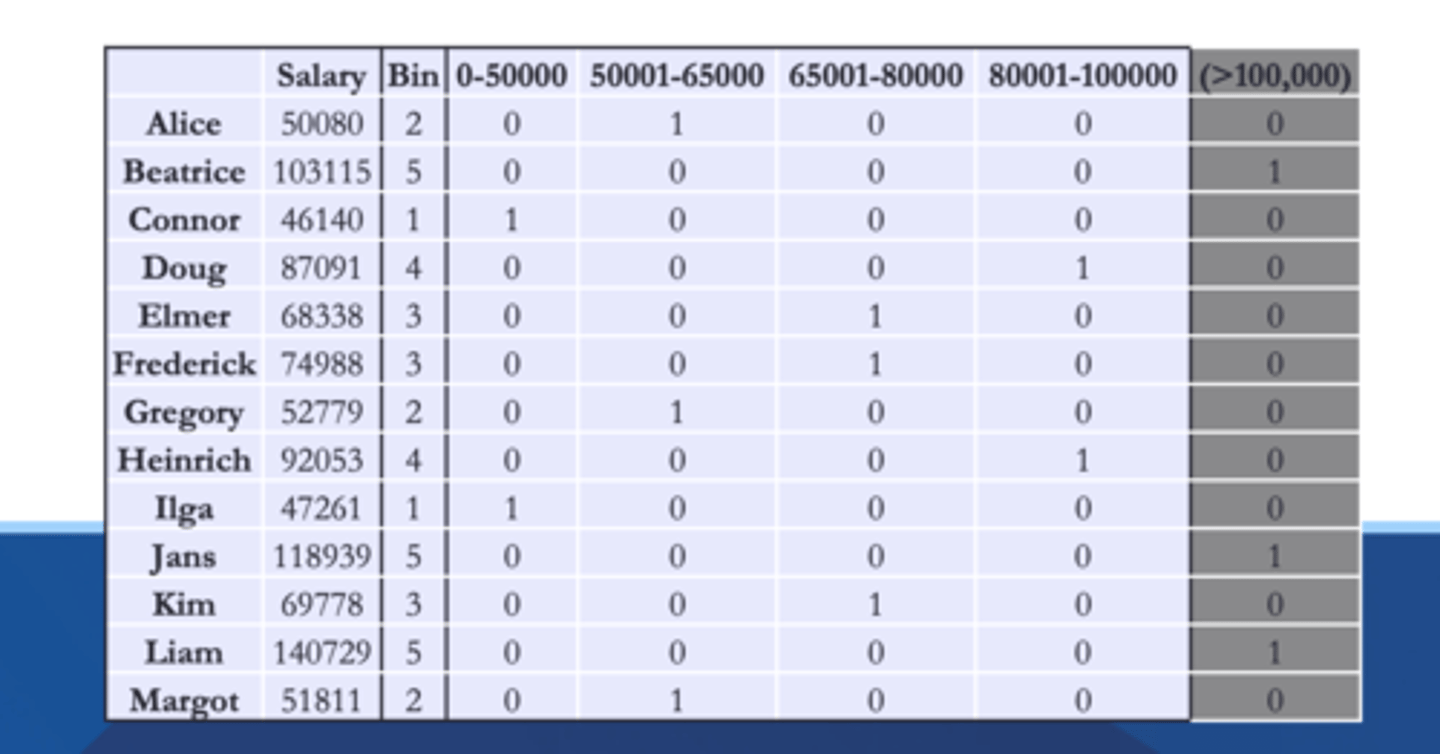
- binning (bucketing)
- calculation
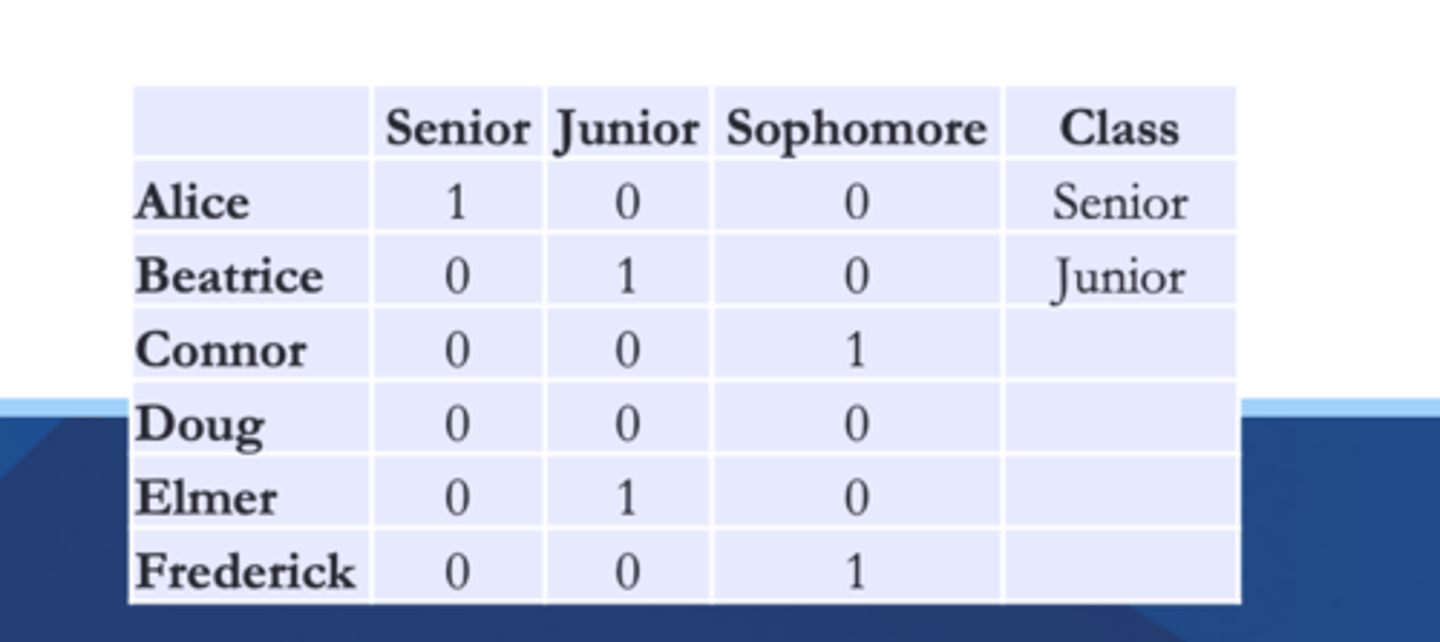
dummy coding
Numeric "1" or "0" coding where each number represents an alternate response such as "female" or "male" / "yes" , "no"
Binning
the exact value doesn't matter
- histograms
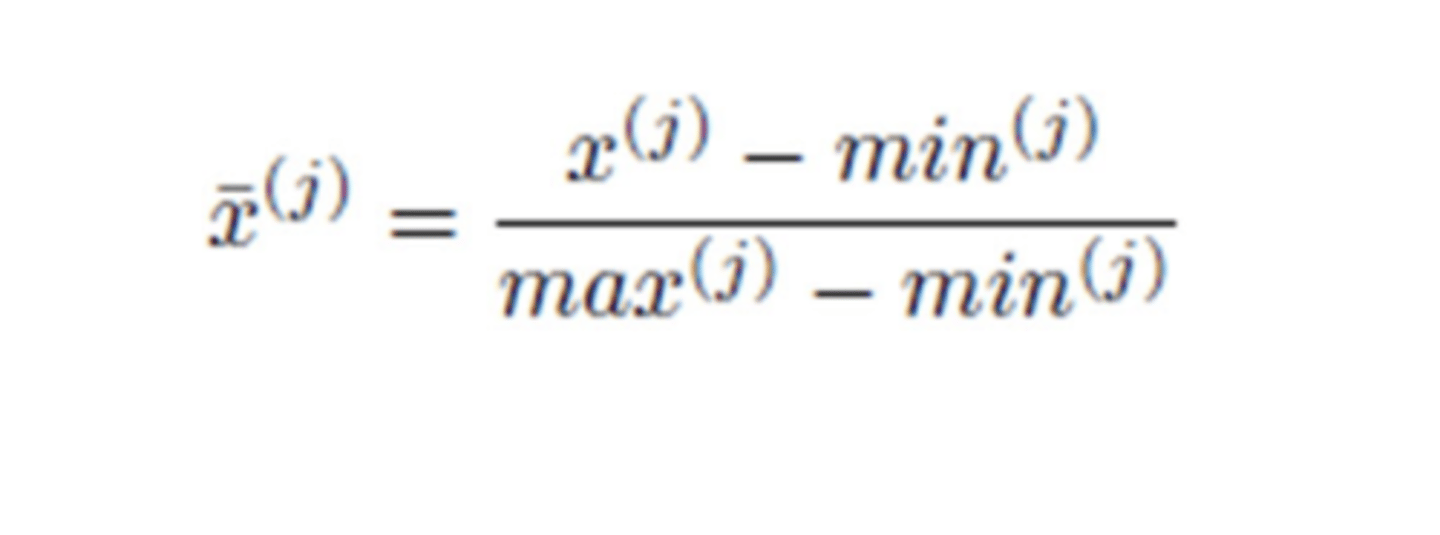
normalization
converting the range of values into a standard range
- increases the speed of learning
- reduces the computing power
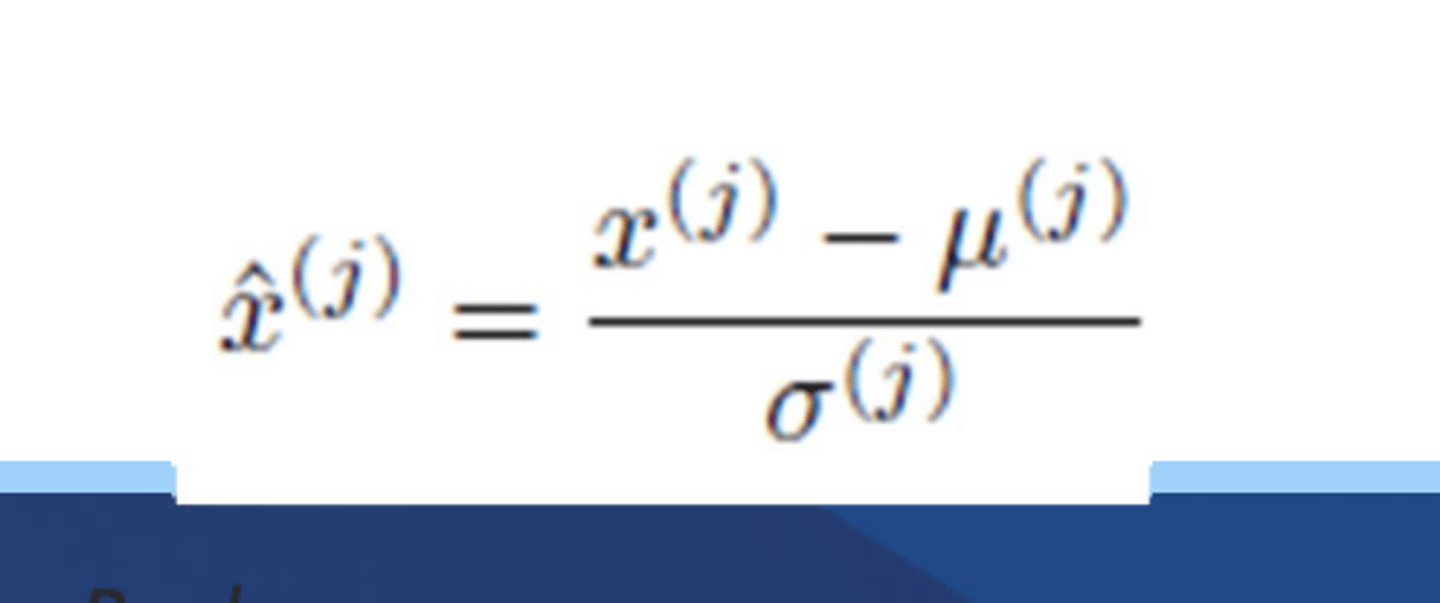
Standardization
- like normalization except uses the standard normal distribution
- Mean of 0 standard deviations of 1
- use for unsupervised learning models, if its close to a bell curve, if there are extreme outliers
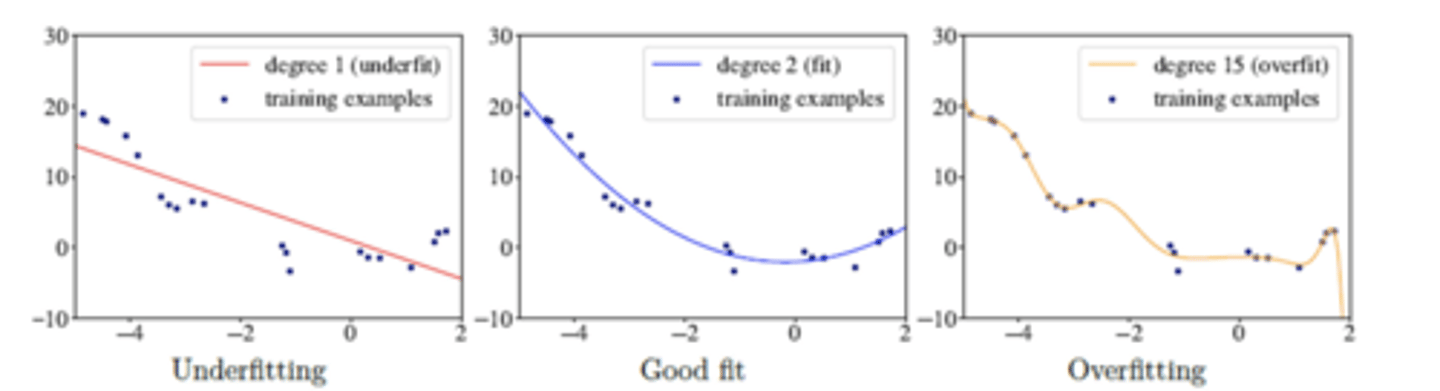
Feature engineering drawbacks
more variables are not always better
- risk of overfitting data
- risk of use of dimensionality (need more data points)
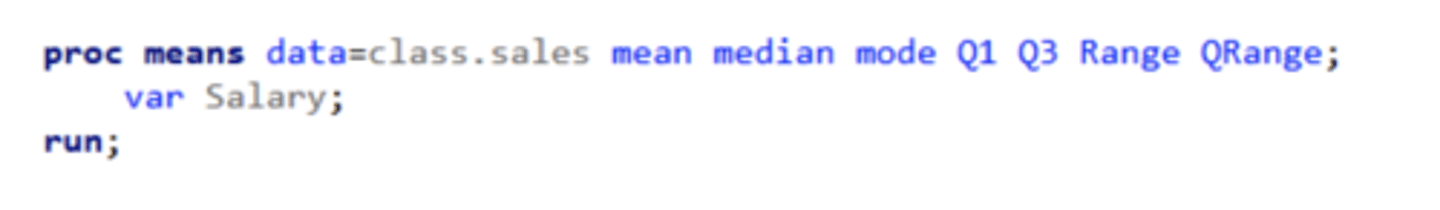
Proc means OTHER descriptive statistics available
- Median
- Mode
- Q1
- Q3
- Range
- Qrange
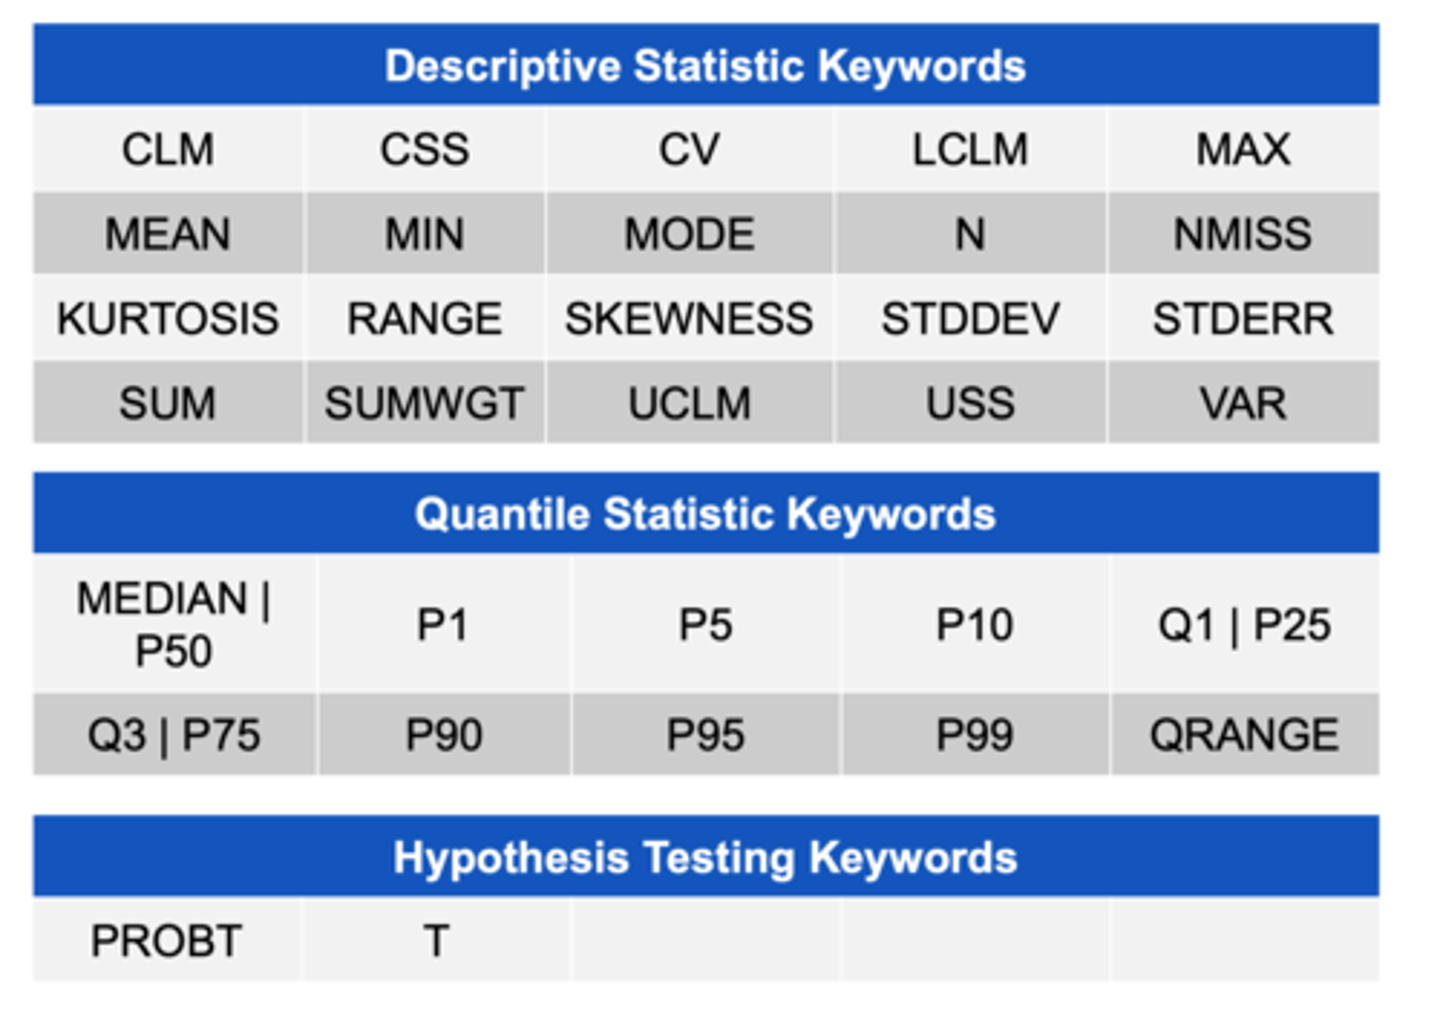
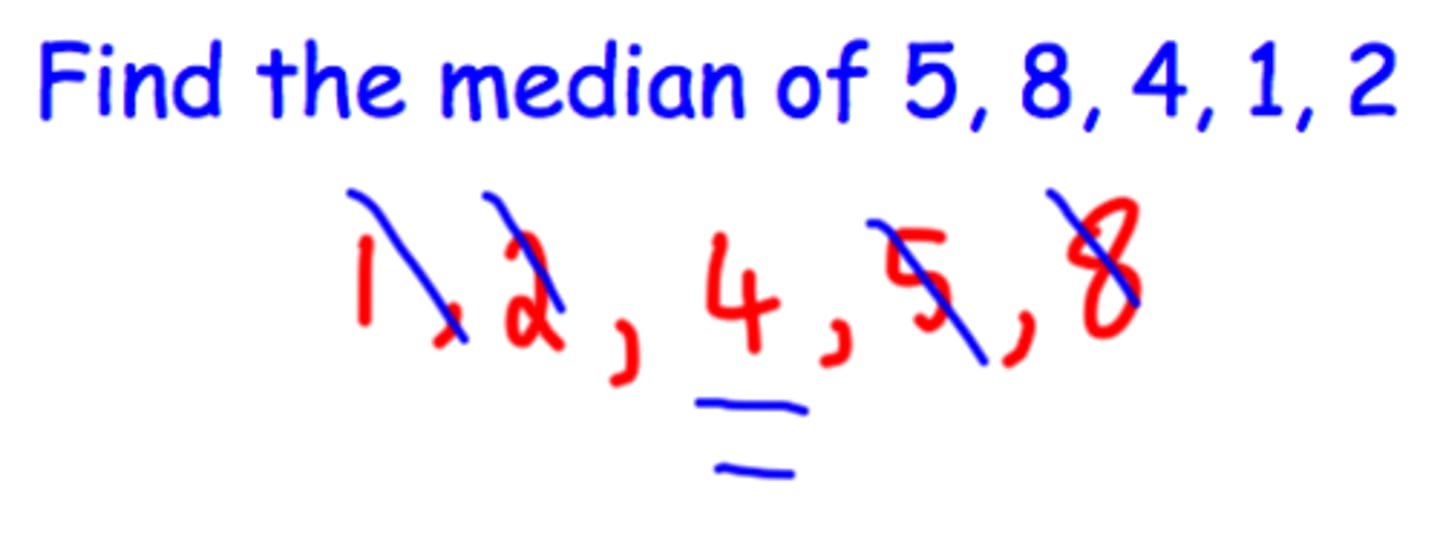
median
middle value when all the values are ordered
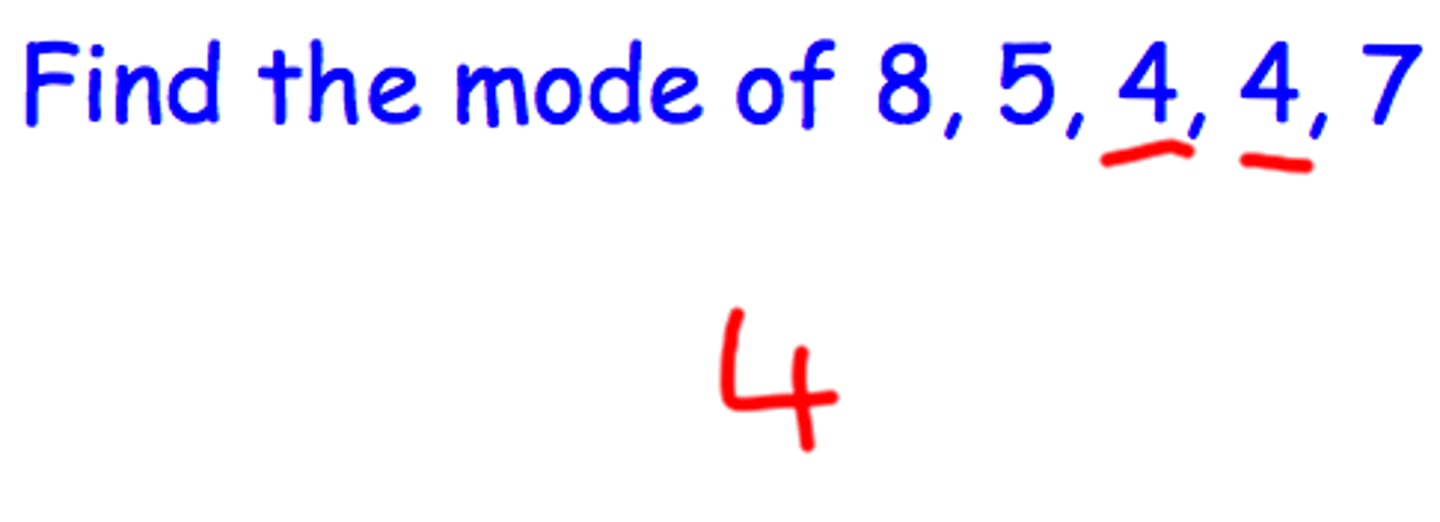
mode
the most repeated value
Q1
the value that 25% of all values are at or below
Q3
the value that 75% of all values are at or below
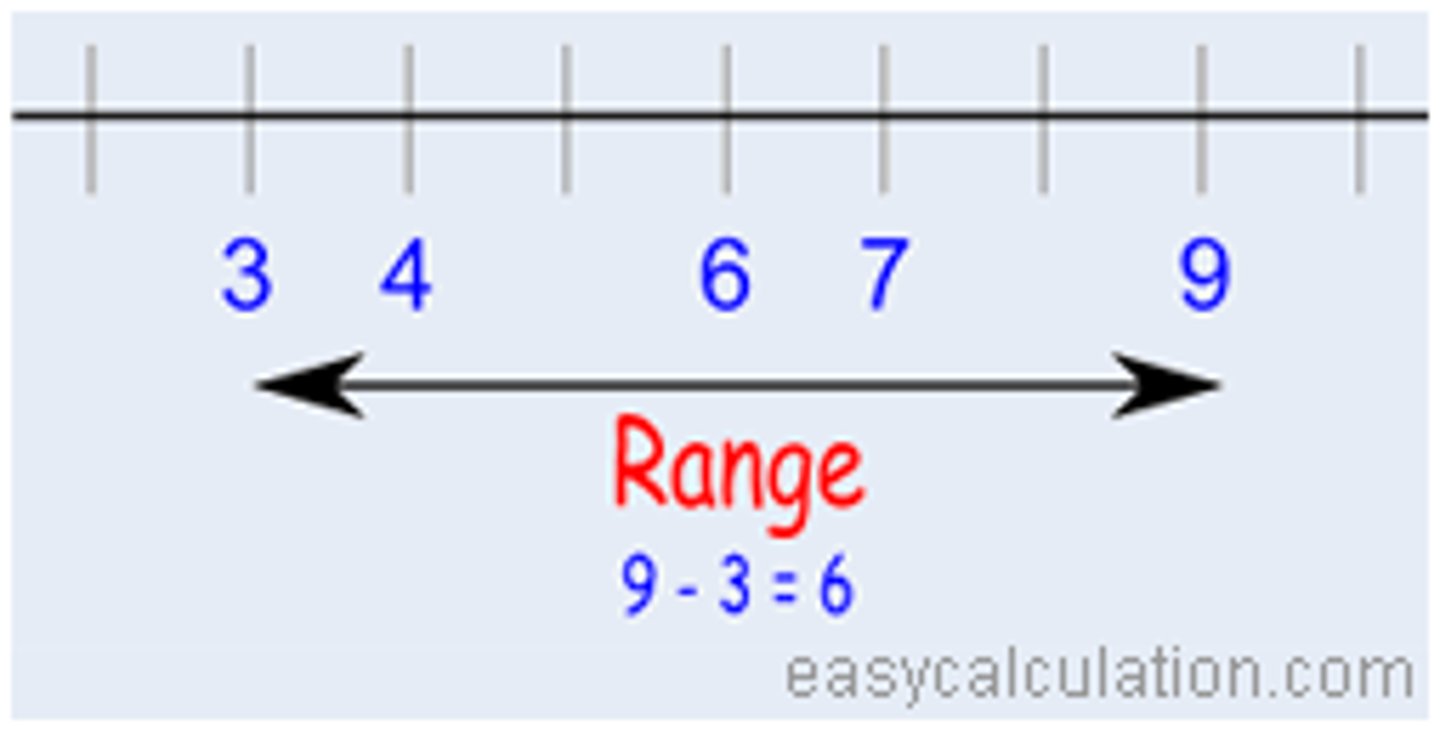
range
the largest minus the smallest
qrange
the Q3 value minus the Q1 value (essentially reduces impact of outliers)
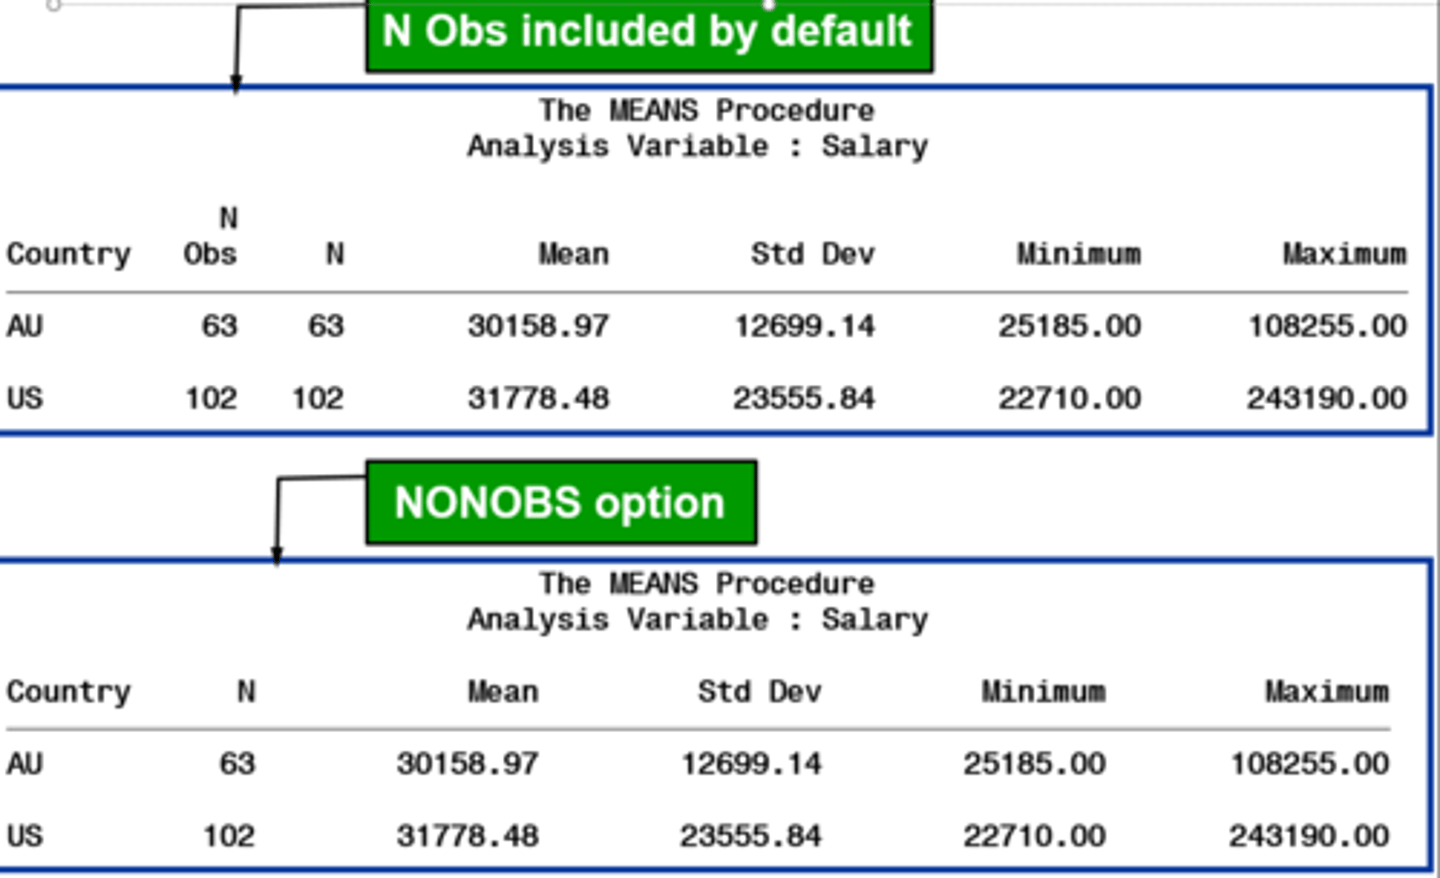
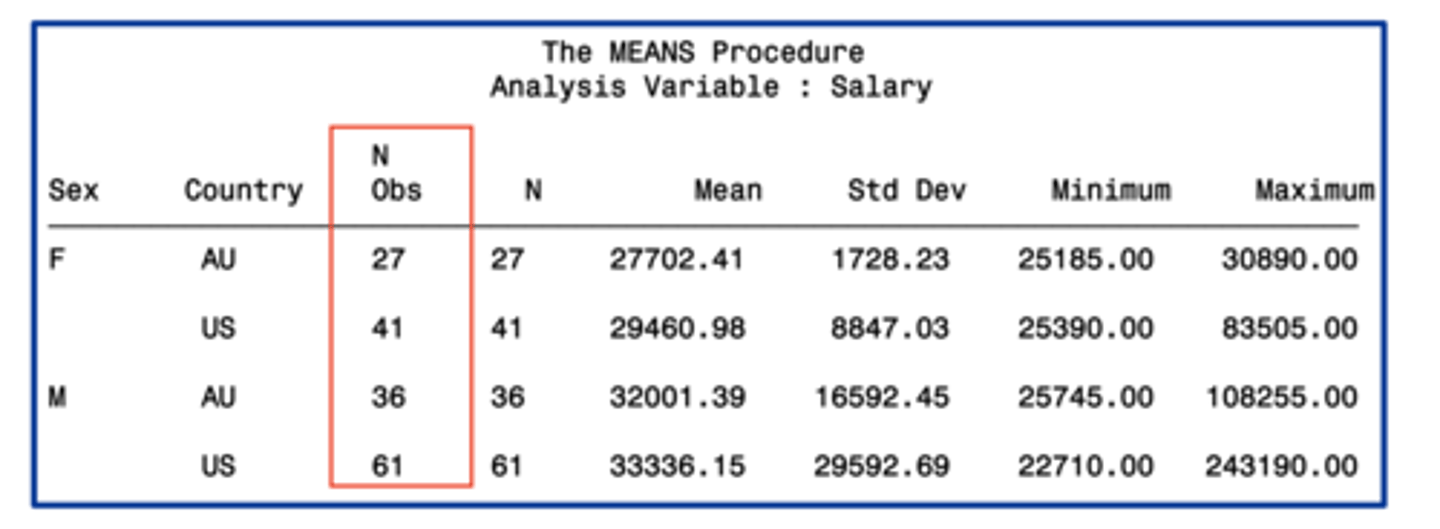
nonobs
suppresses the N Obs column
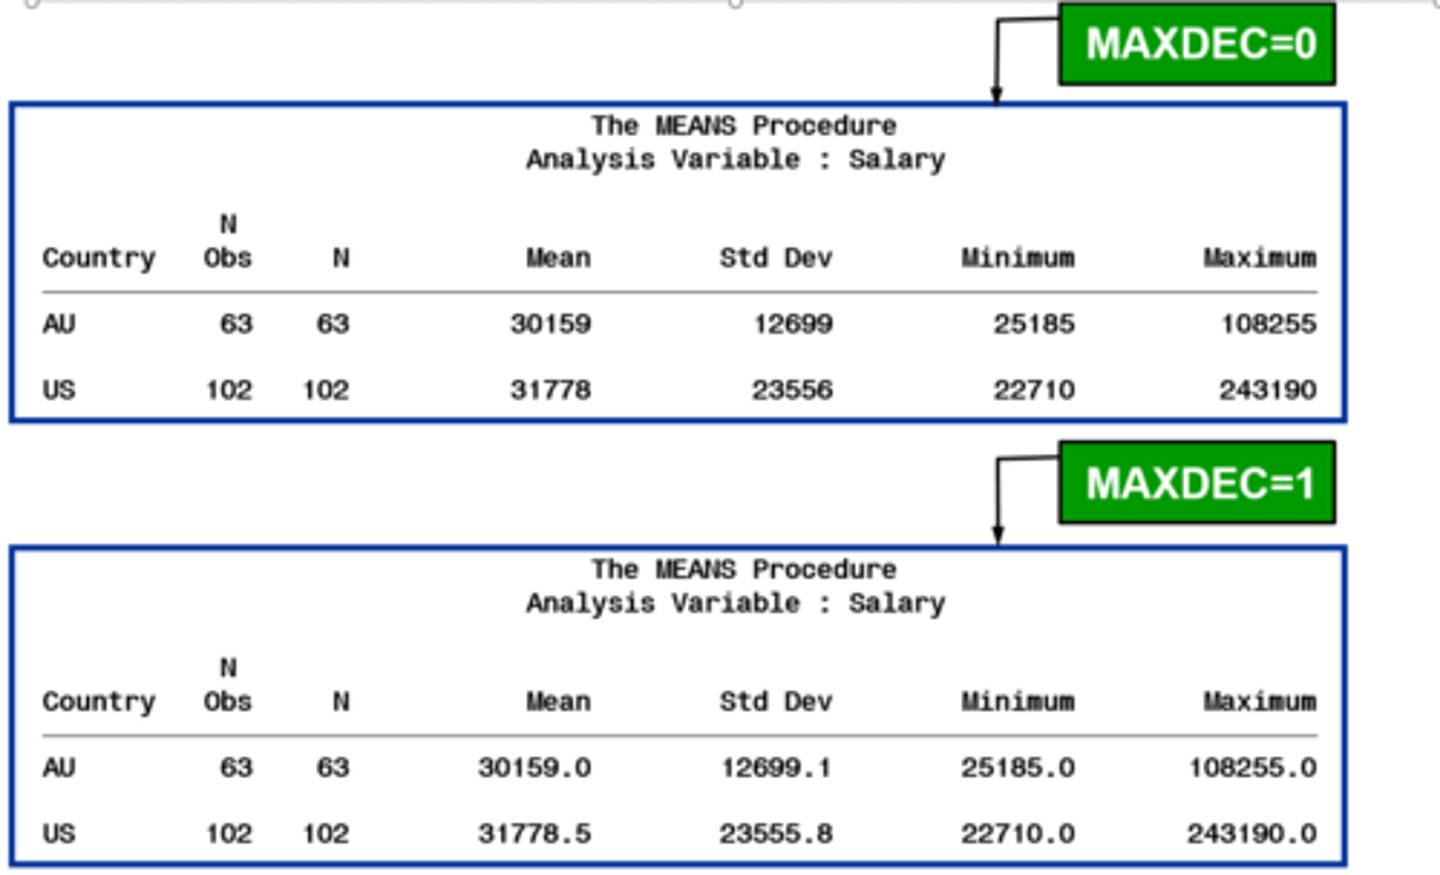
maxdec
specifies the number of decimals to display
- maxdec =1 will have one decimal place
adding statistics in the MEANS procedure
request statistics after the dataset to override the default stats (includes the OTHER descriptive statistics referred too earlier)
class statement
identifies variables whose values define subgroups for the analysis
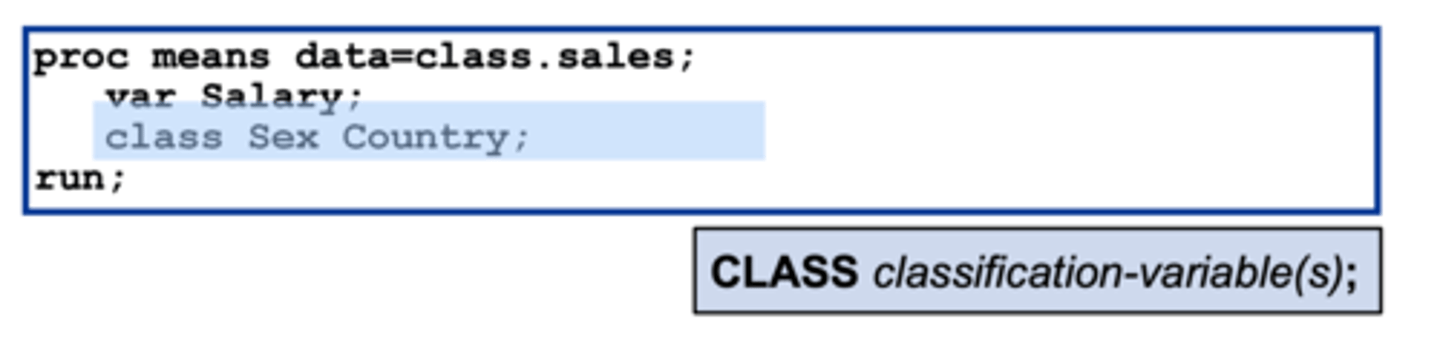
classification variables
- character or numeric
- typically have few discrete values
- the data set does not need to be sorted or indexed by the classification
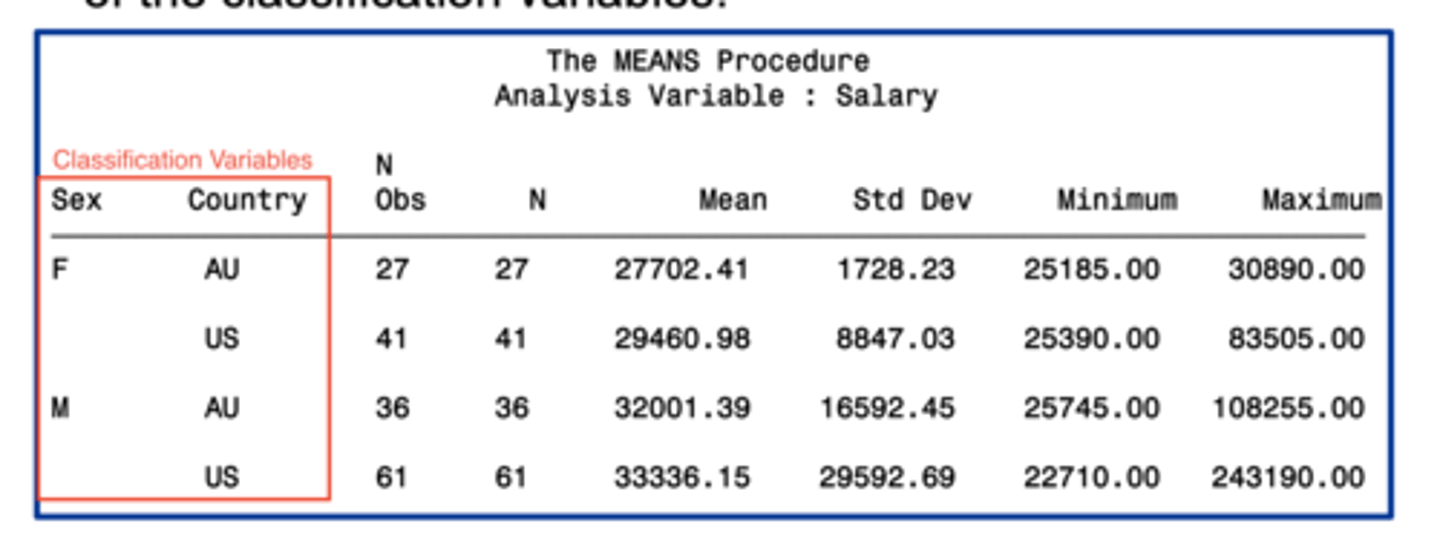
n obs
the number of observations with each unique combination of class variables
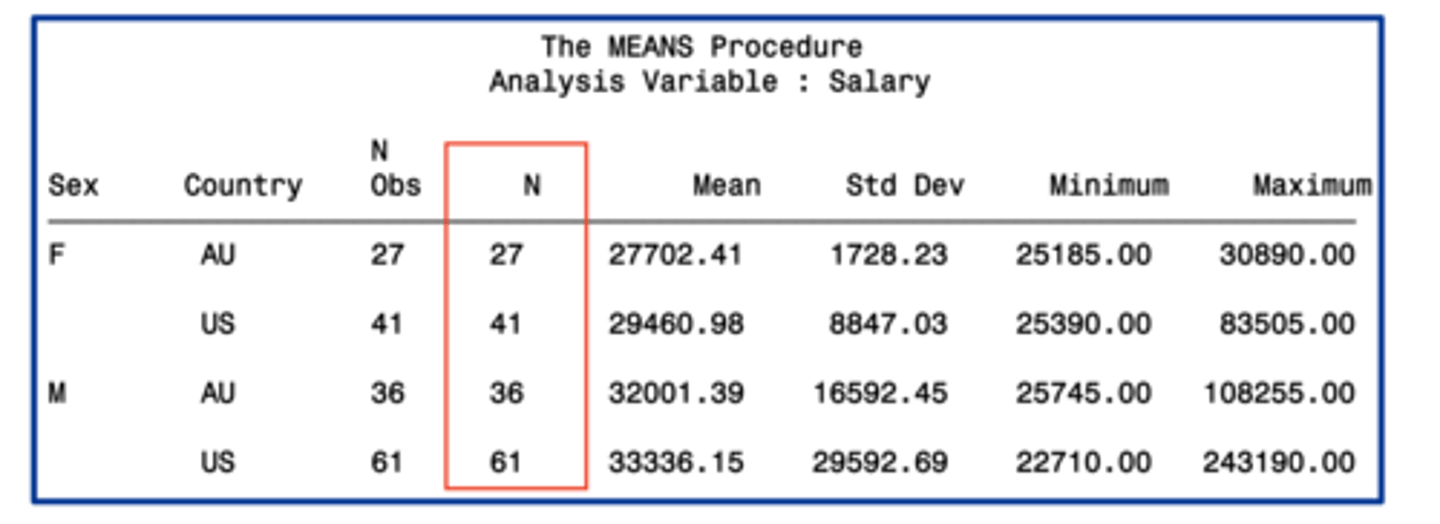
n
the number of observations with non missing values of the analysis variable(s)
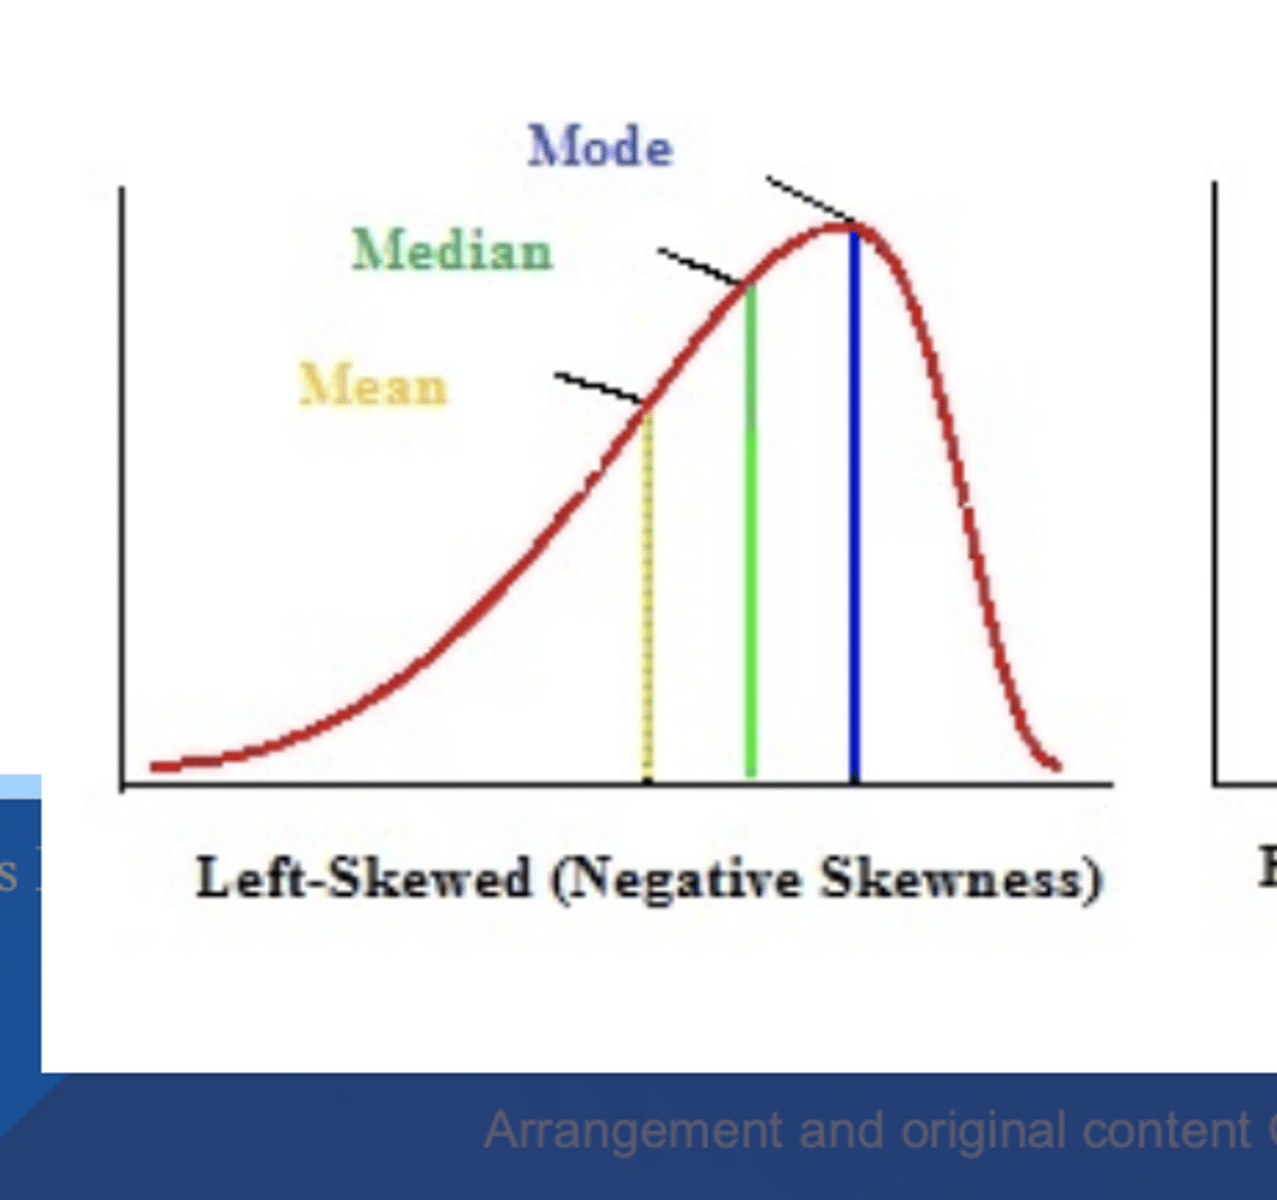
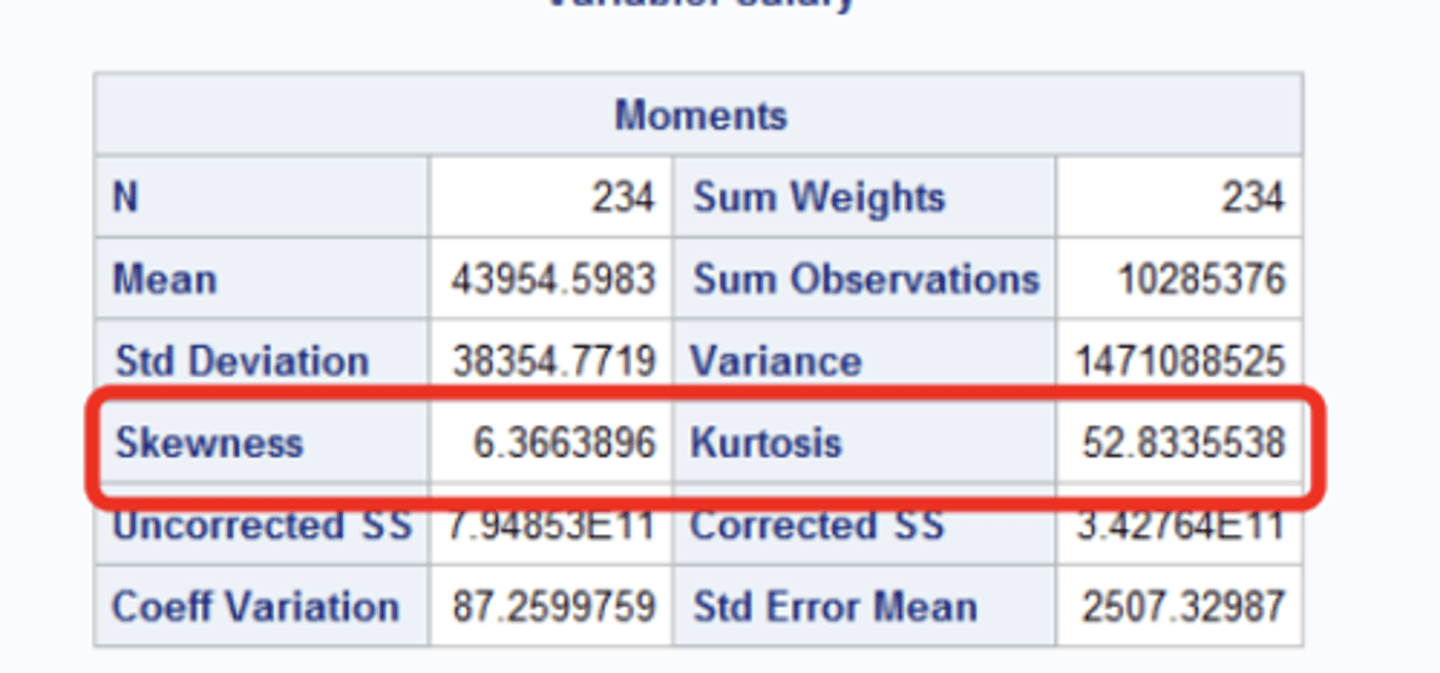
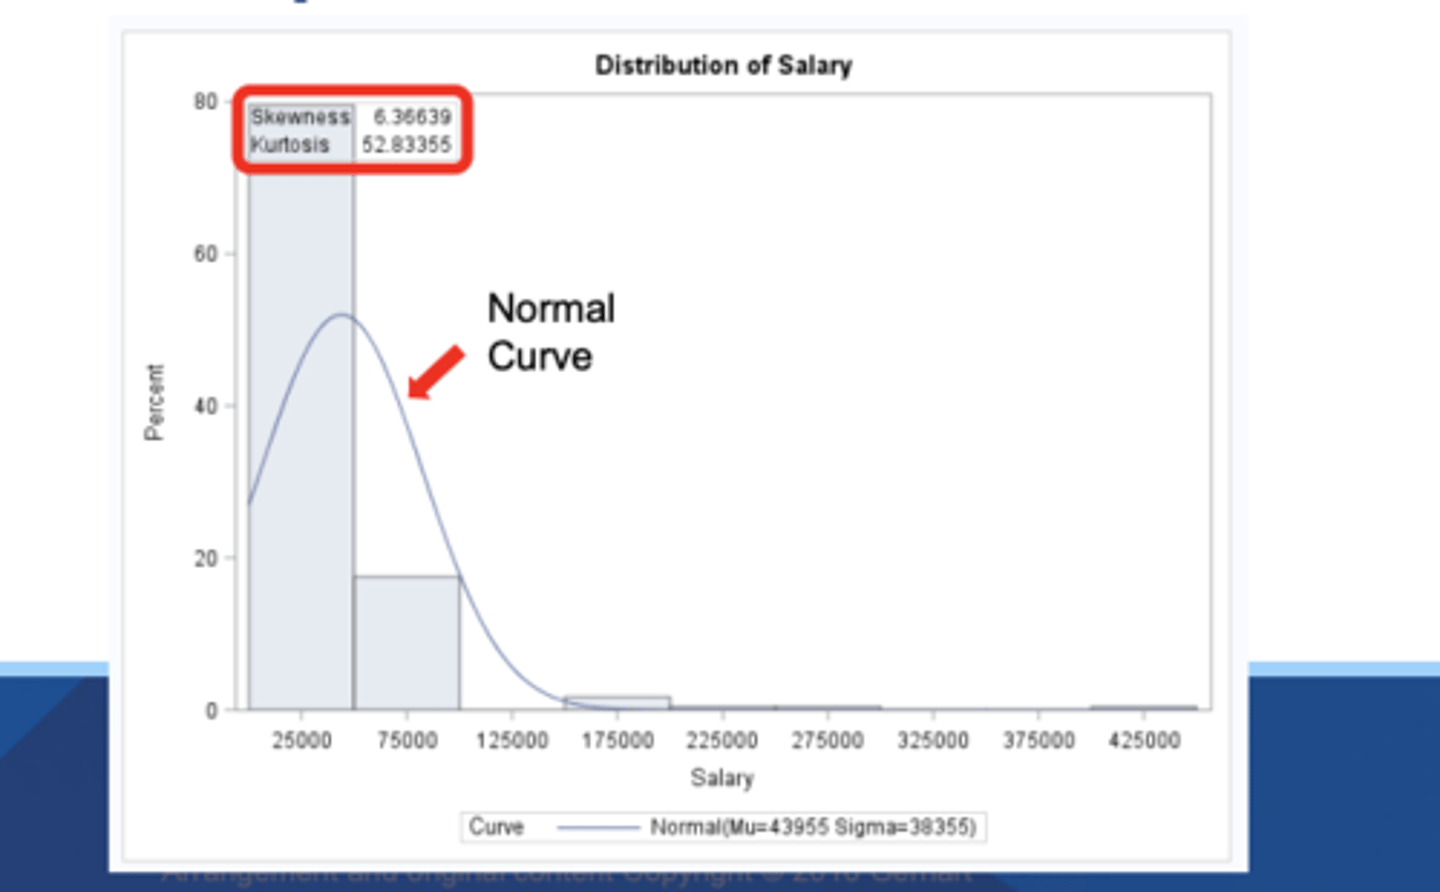
skewness
- tendency of data to be more spread out on one side of the mean than the other
- asymmetry of data
left skewed
skewness < 0
right skewed
skewness > 0

Kurtosis
tendency of data to be concentrated toward the tails or middle of the data
- concentrated toward the mean
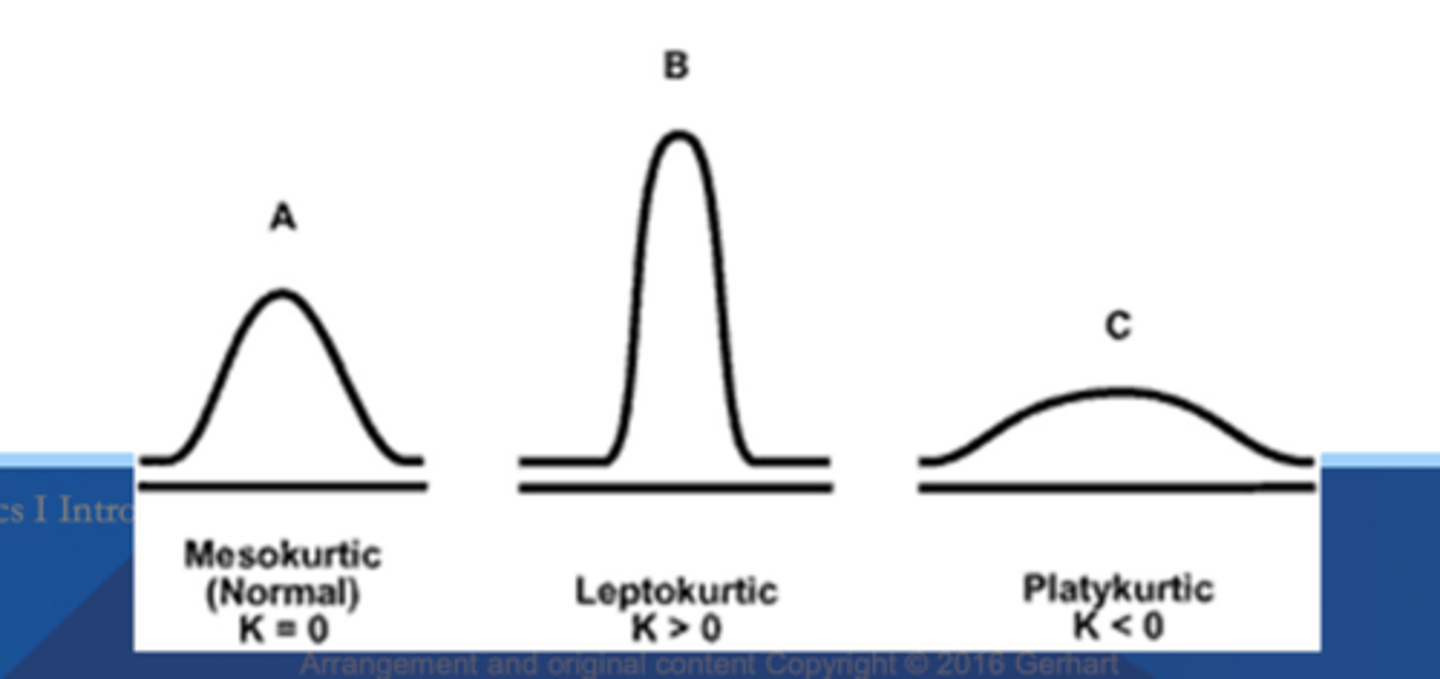
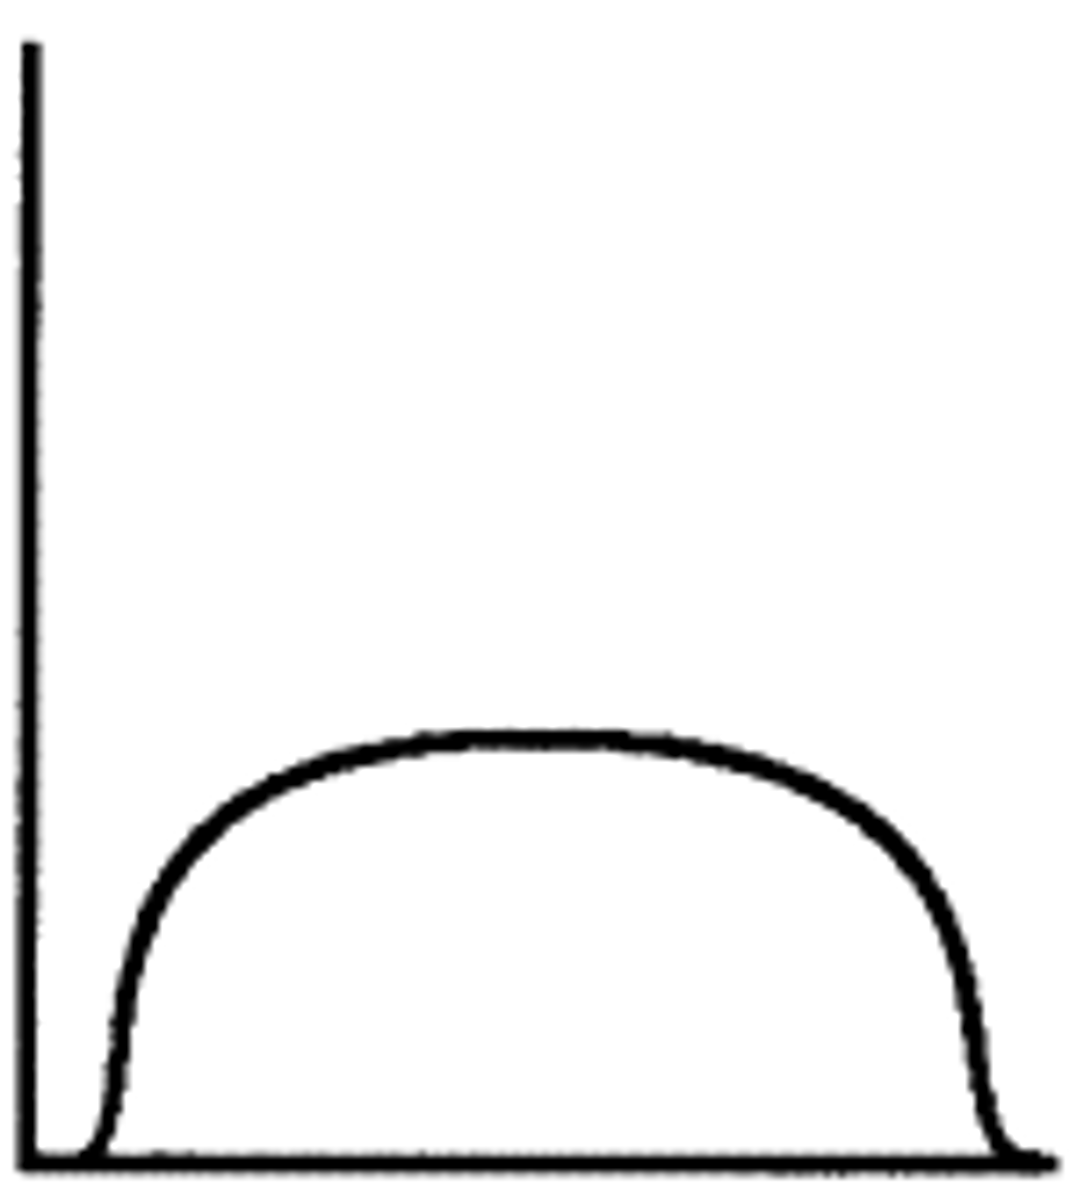
negative kurtosis (platykurtic)
less peaked
k < 0
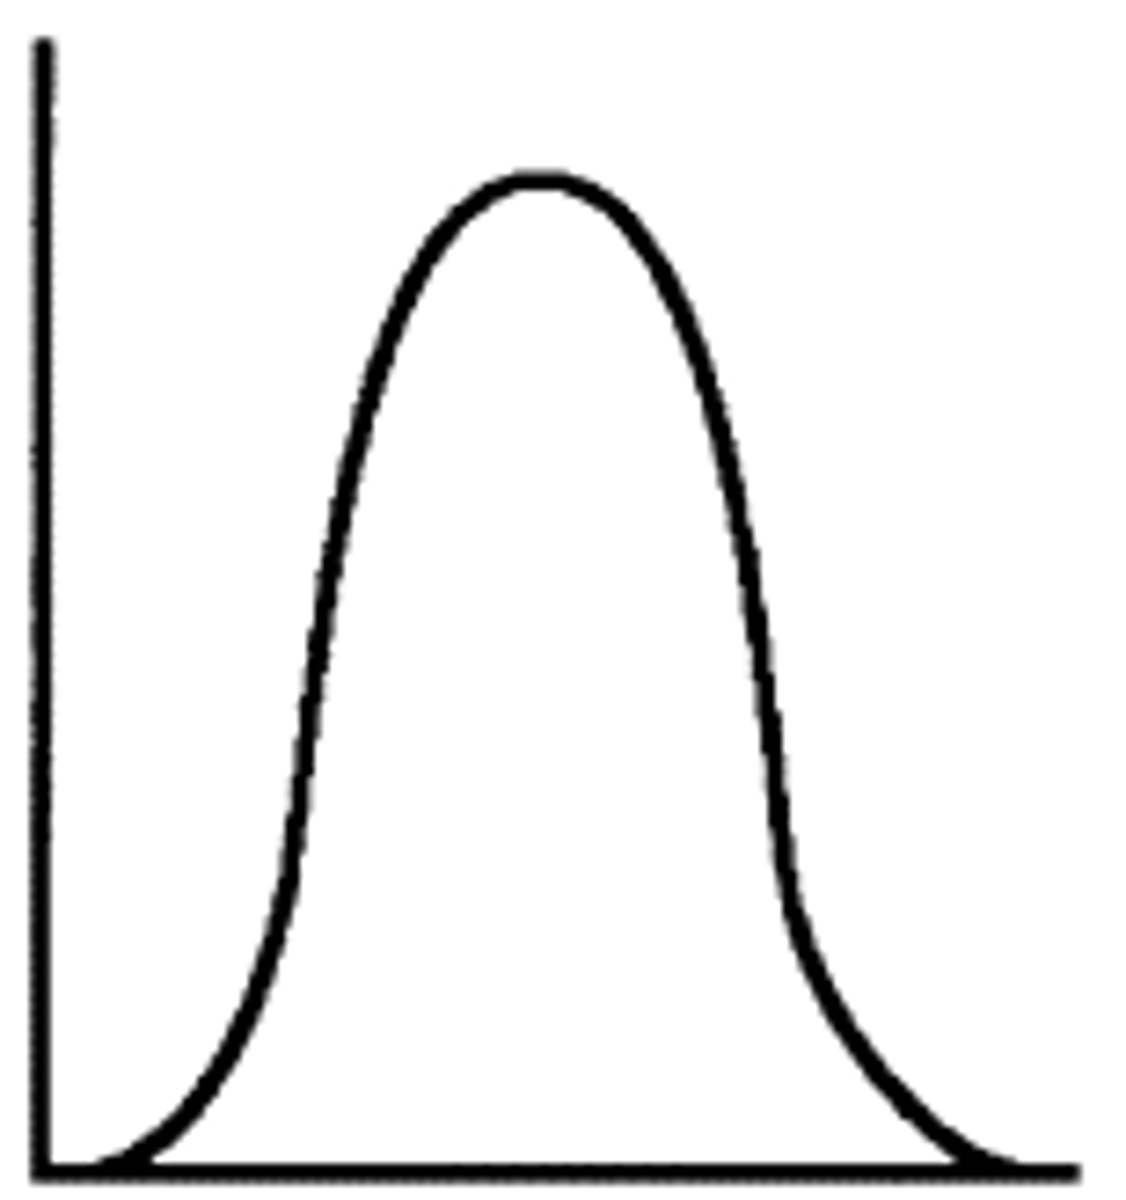
Positive kurtosis (leptokurtic)
more peaked
k > 0
Moderate Kurtosis (mesokurtic / normal)
Middle peaked
k=0
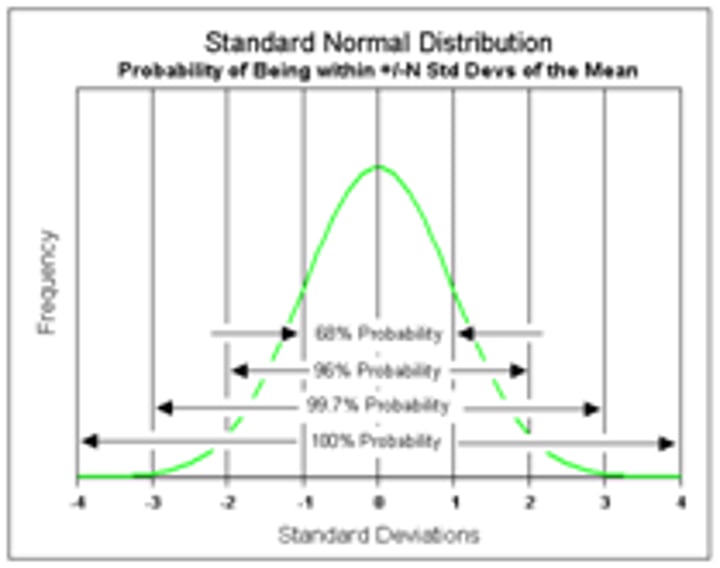
Normal distribution
a bell-shaped curve, describing the spread of a characteristic throughout a population
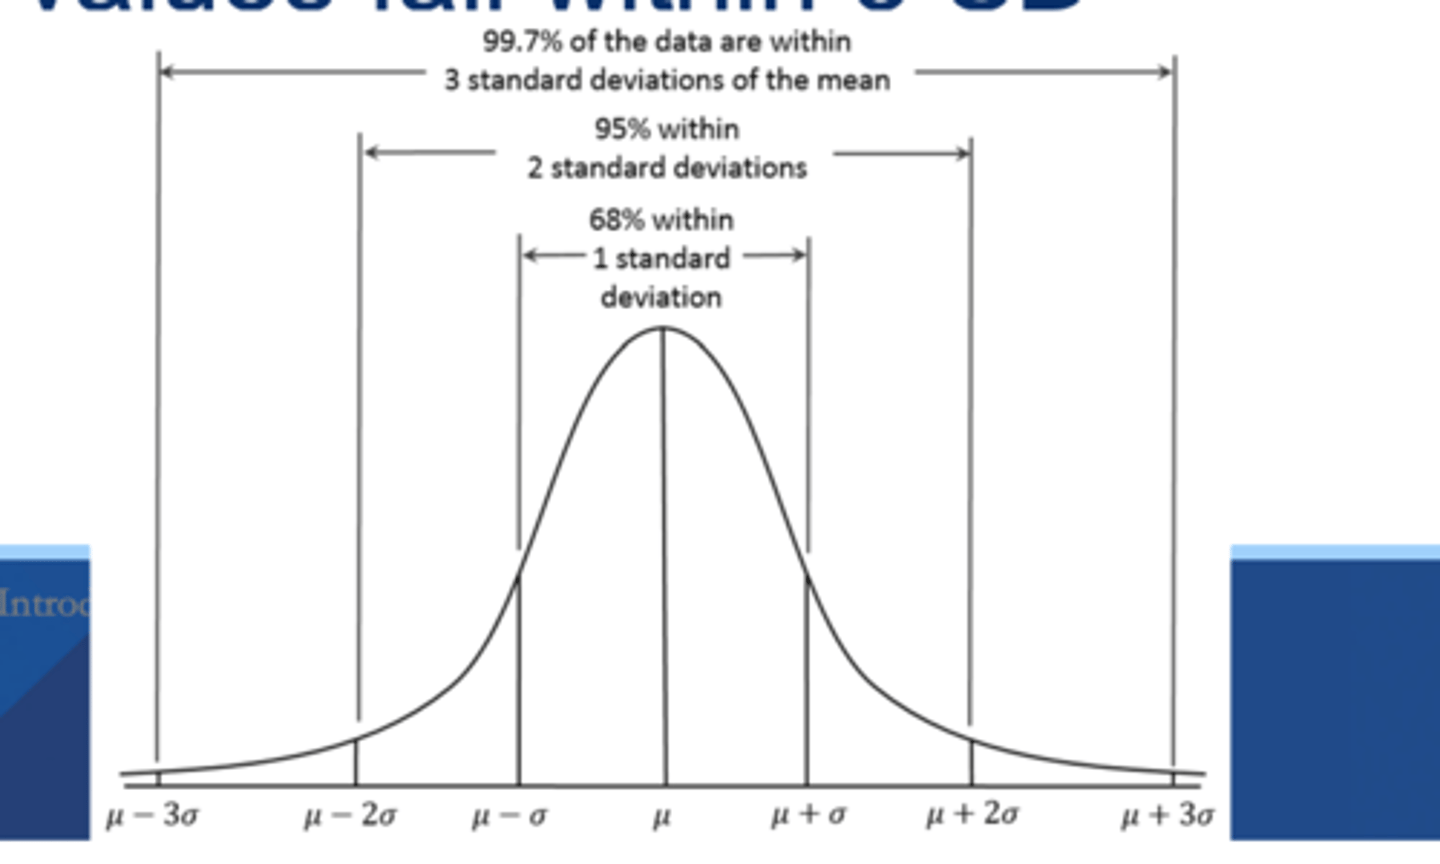
1 Standard deviation
68%
2 standard deviations
95%
3 standard deviations
99%
What = normal
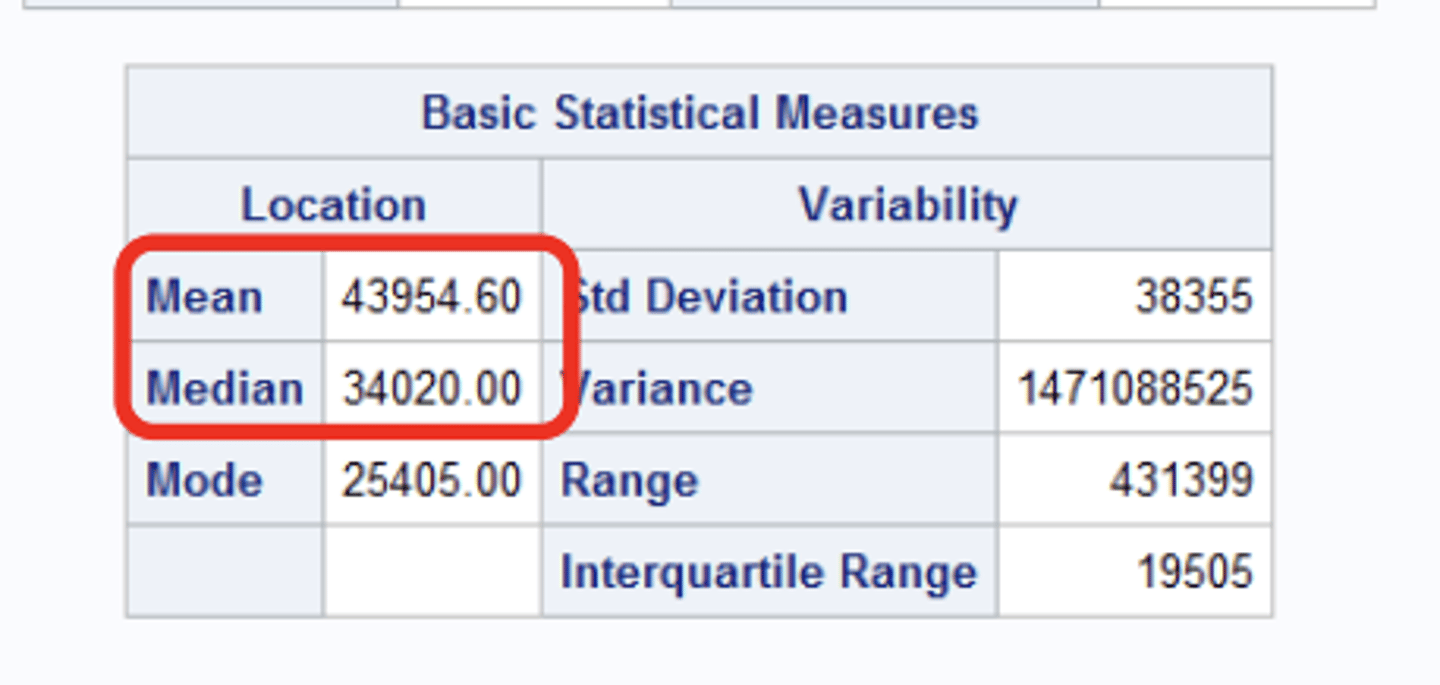
-mean and median are similar
- skewness is close to 0
- kurtosis is close to 0
What is used in SAS to determine normality
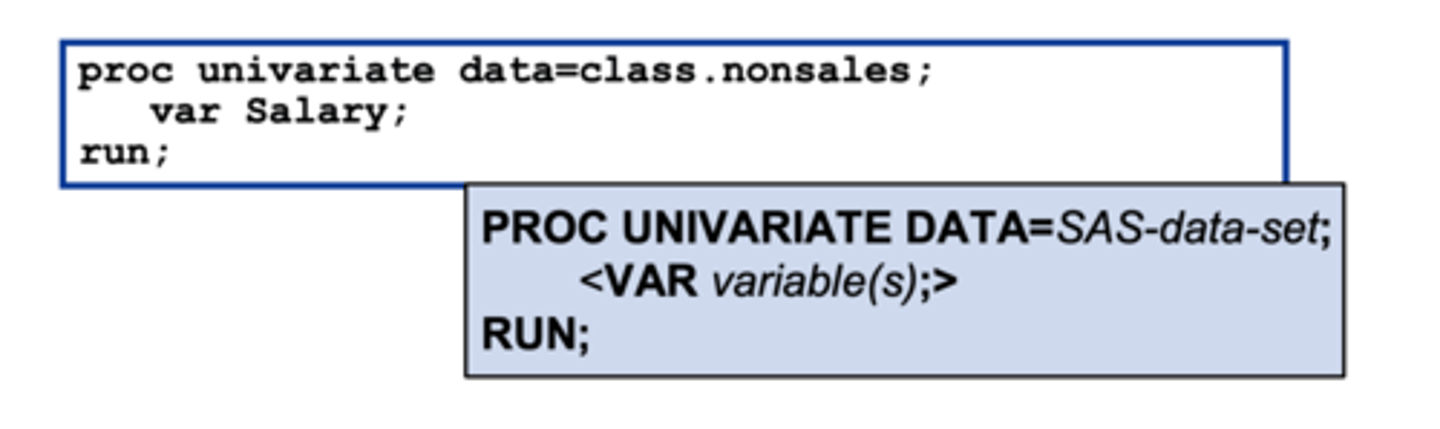
Proc Univariate
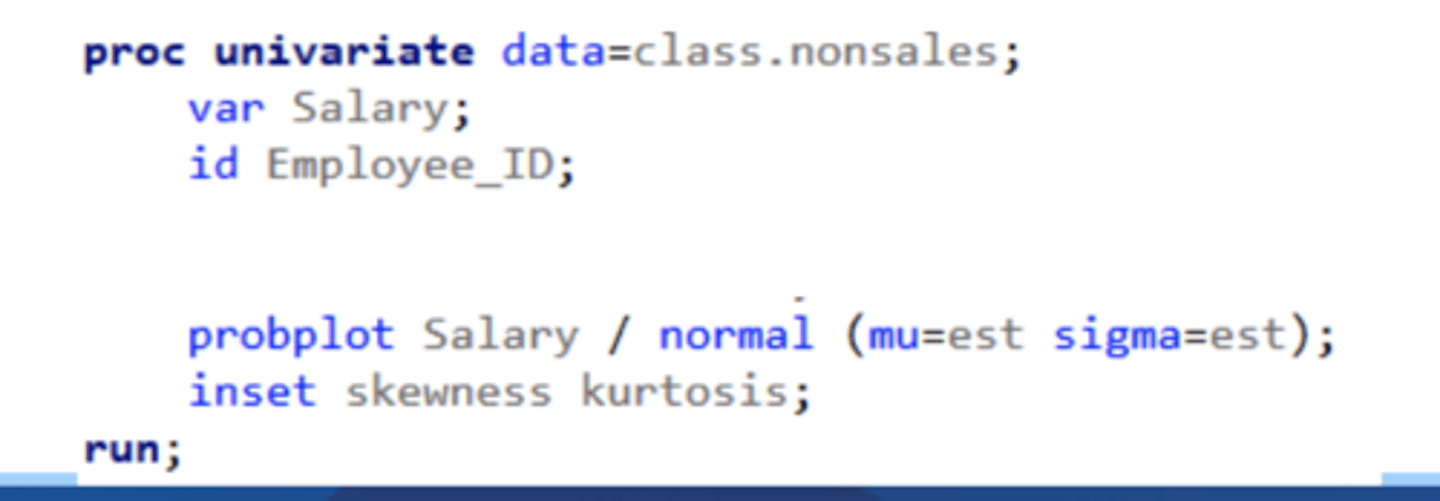
proc univariate
displays extreme observations, missing values and other statistics for the variable(s) included in the var statement
If the VAR statement is omitted, PROC UNIVARIATE analyzes all numeric variables in the data set
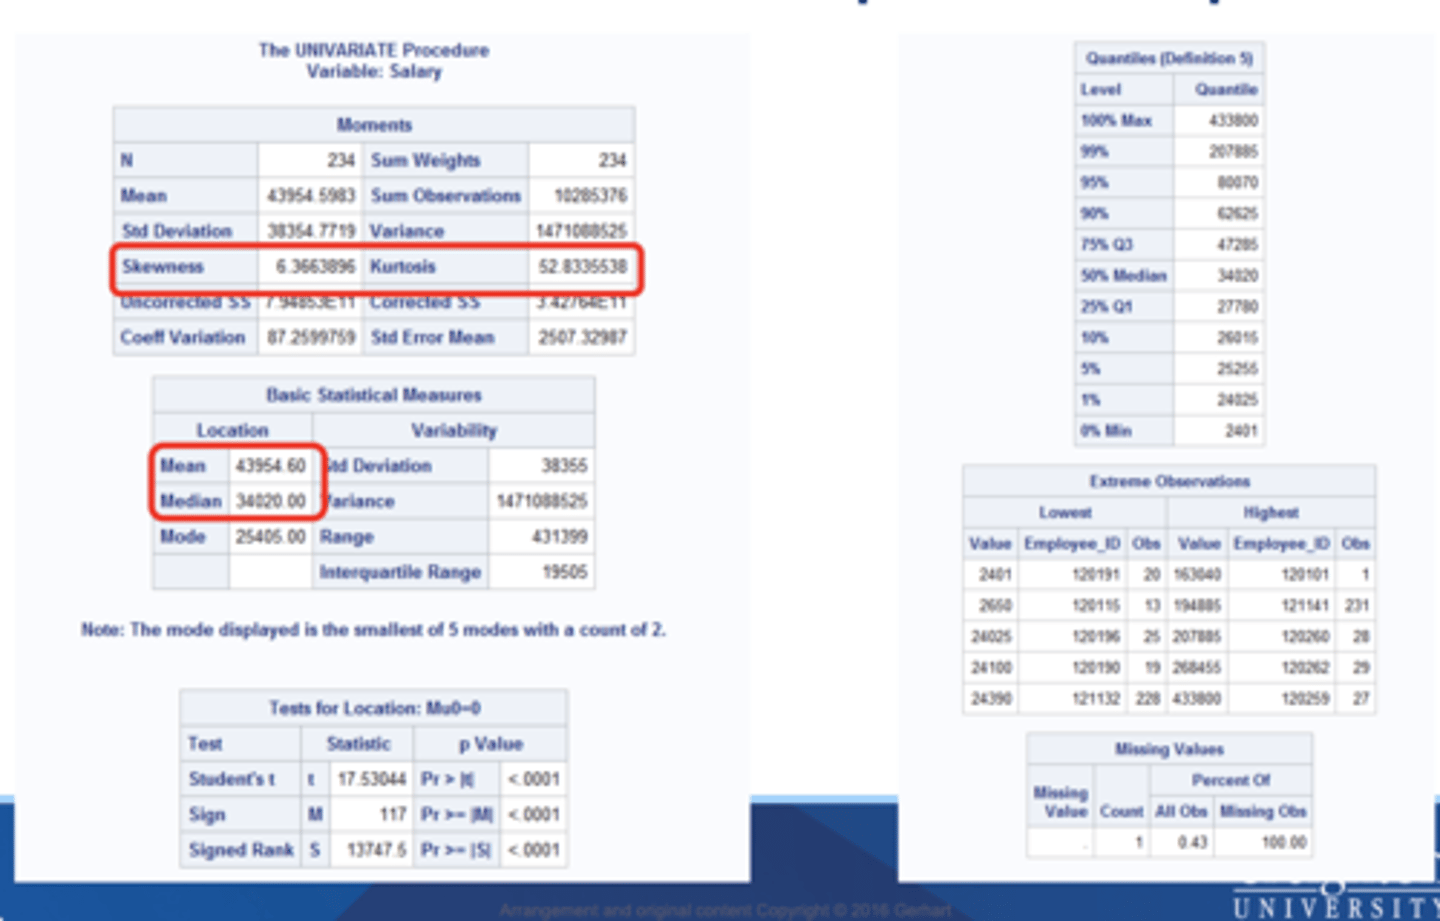
proc univariate output includes
-extreme observations section
-moments section
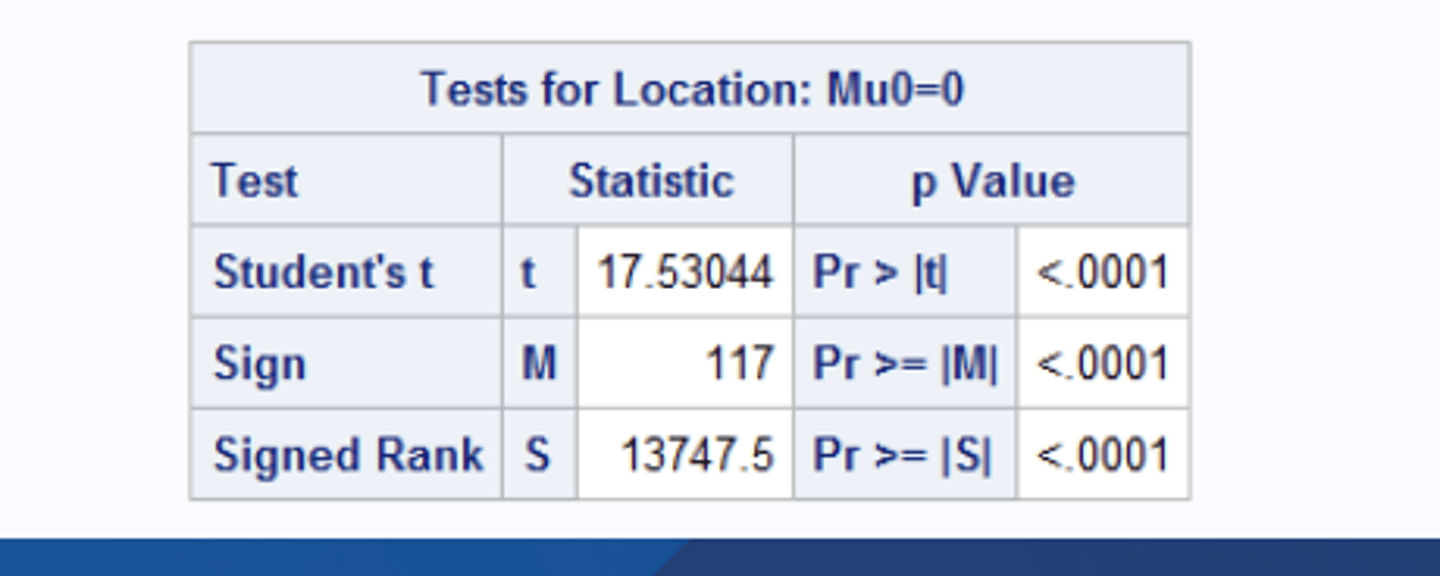
-tests for location section
-missing values section section
-basic statistical measures section
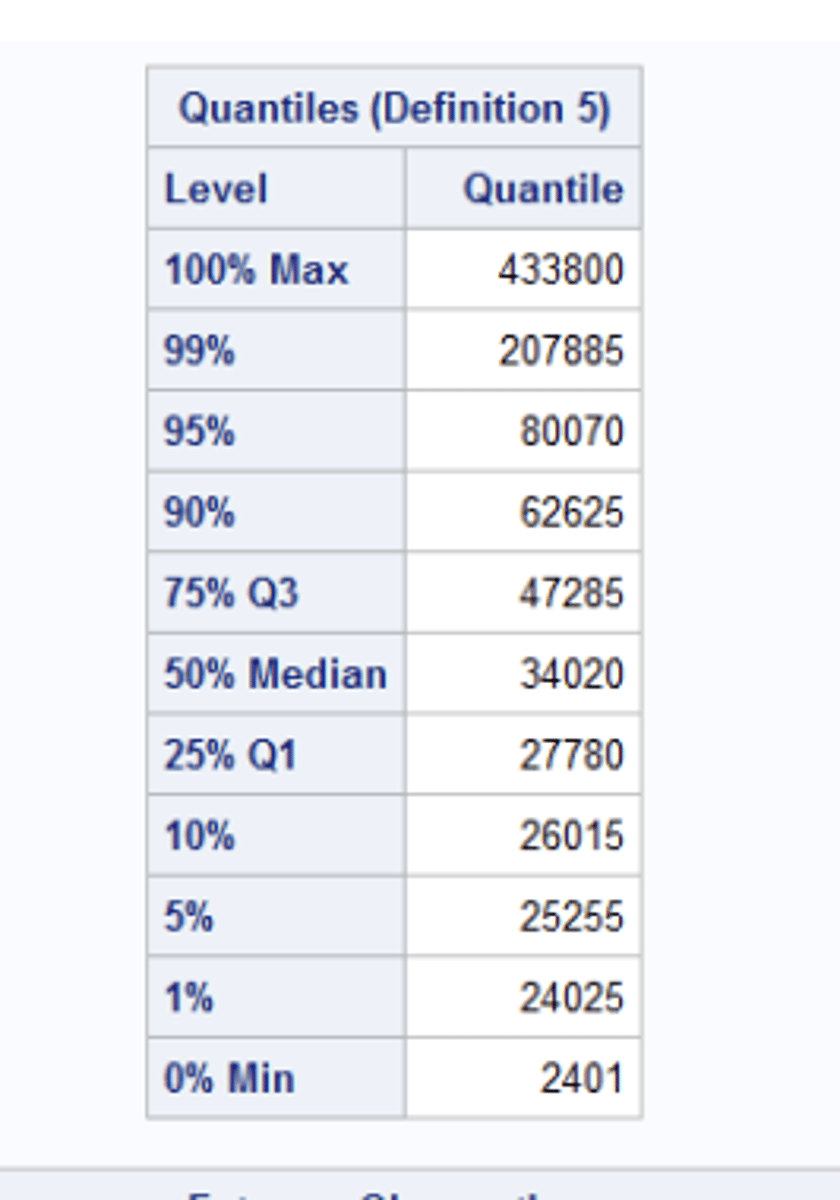
-Quantities section
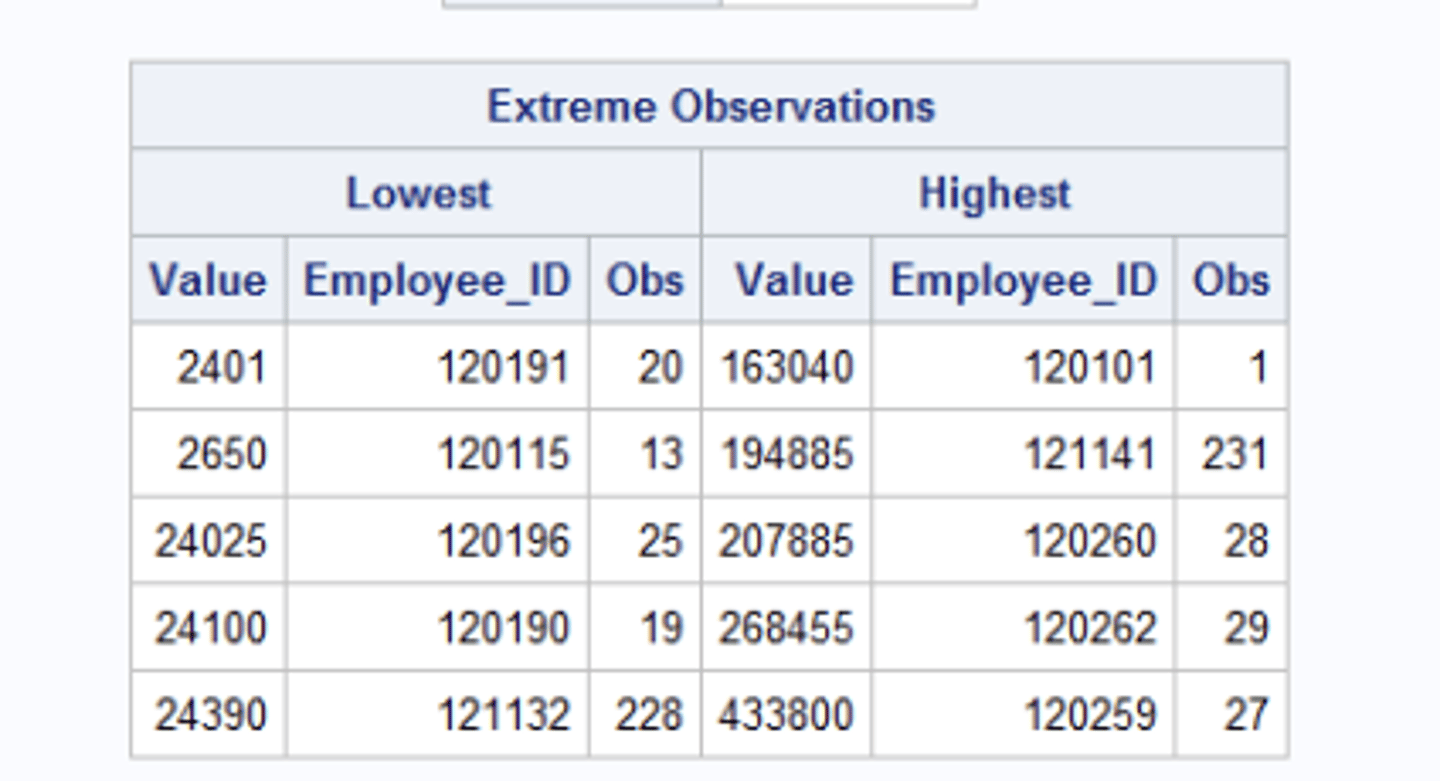
extreme observations section
includes the five lowest and five highest values for the analysis variable and the corresponding observation numbers
moments section
includes things like skewness and kurtosis
basic statistical measures section
includes things like mean median and mode
Tests for location section
includes p value
Quantities section
includes Q1 & Q3
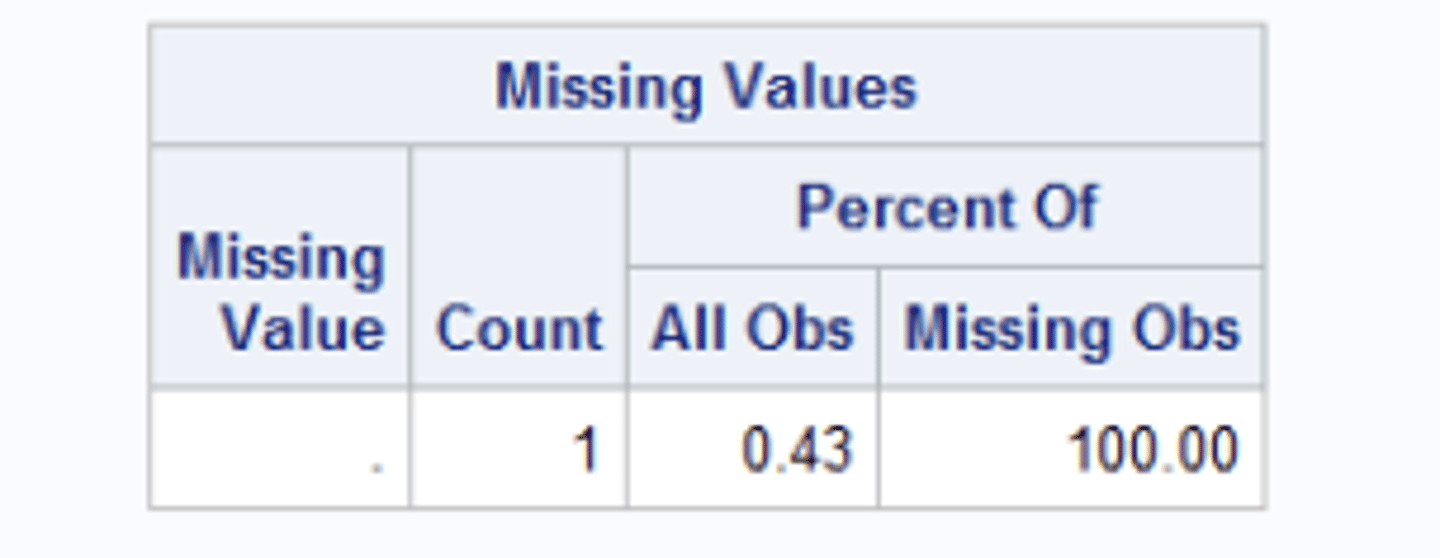
Missing values section
displays the number and percentage of observations with missing values fro the analysis variable
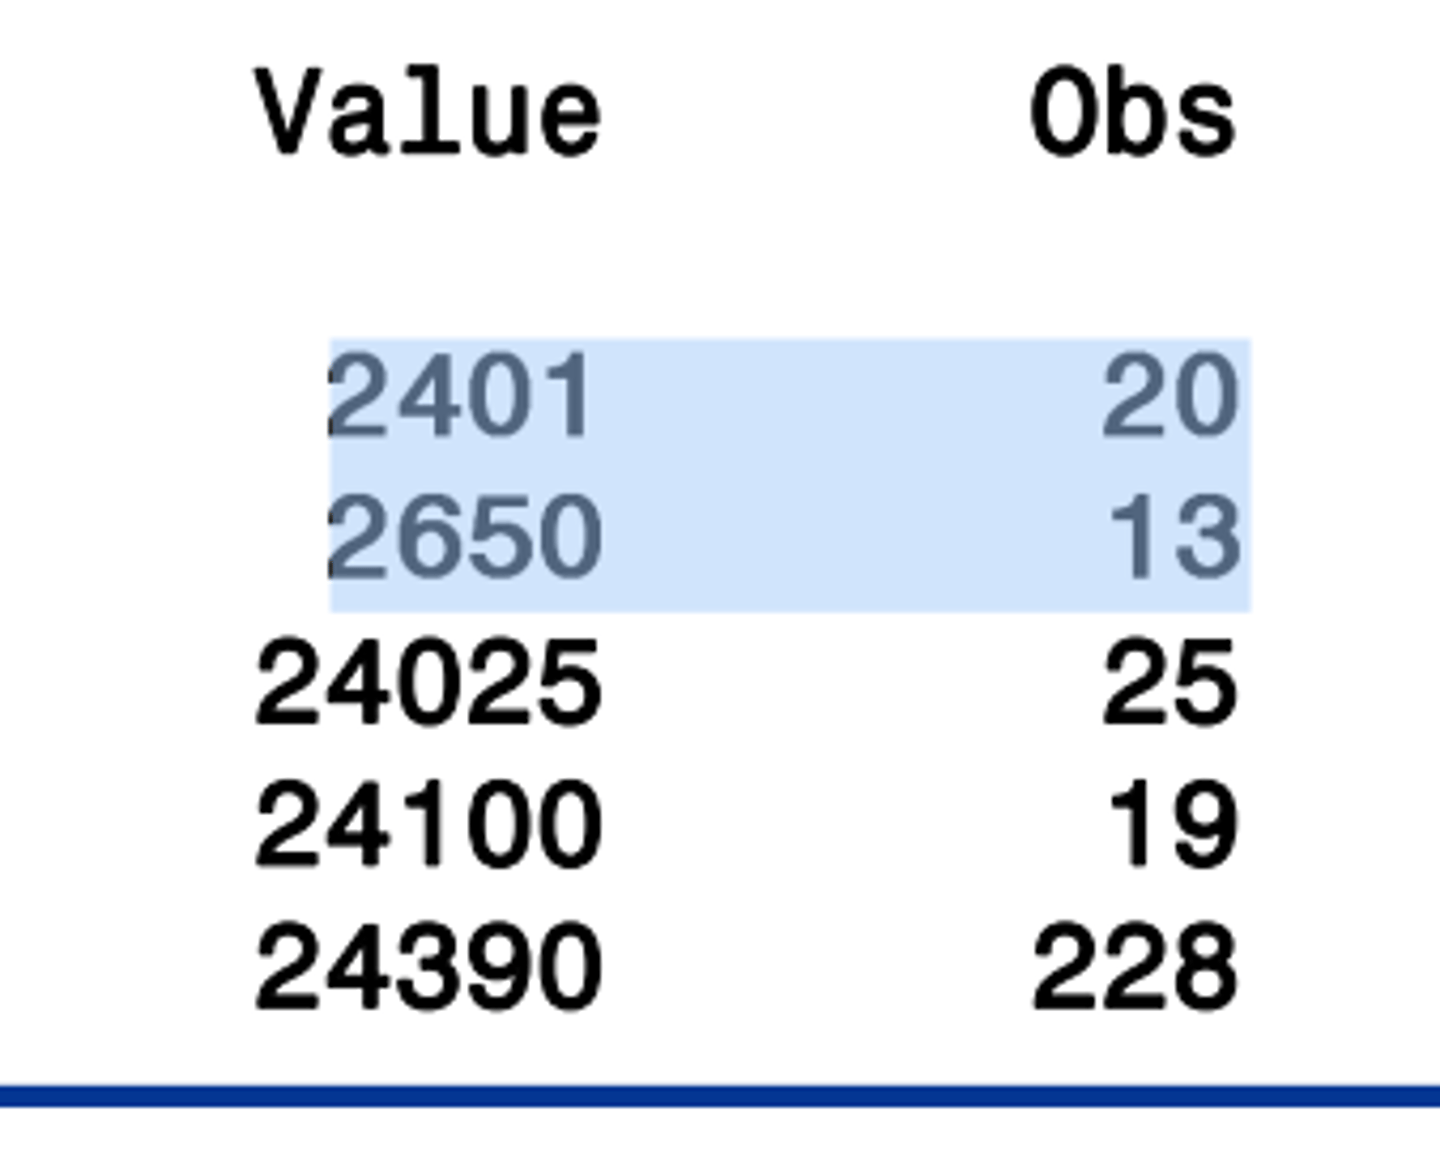
obs
is the observation number, not the count of observations with that value
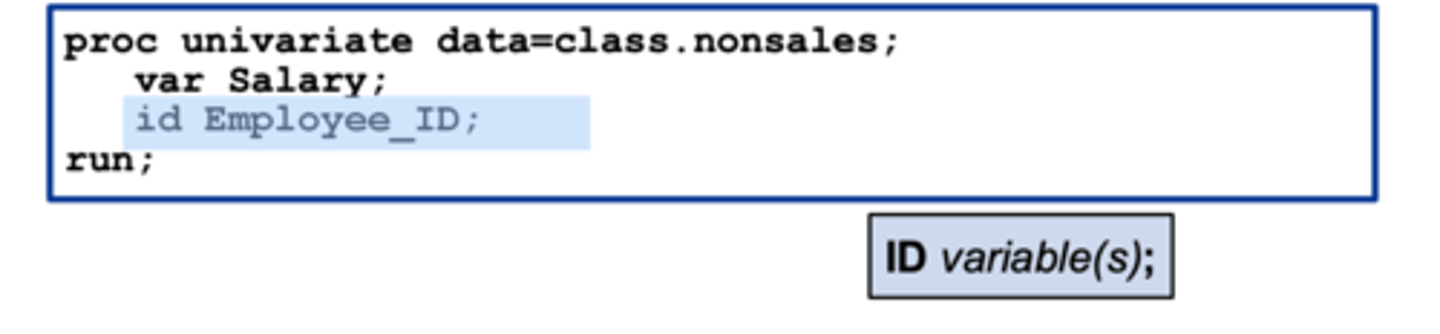
ID statement
displays the value of the identifying variable (or variables) in addition tot he observation number
histogram (proc univariate)
specifies that you want a histogram, and what variables to include
(histogram salary / normal;)
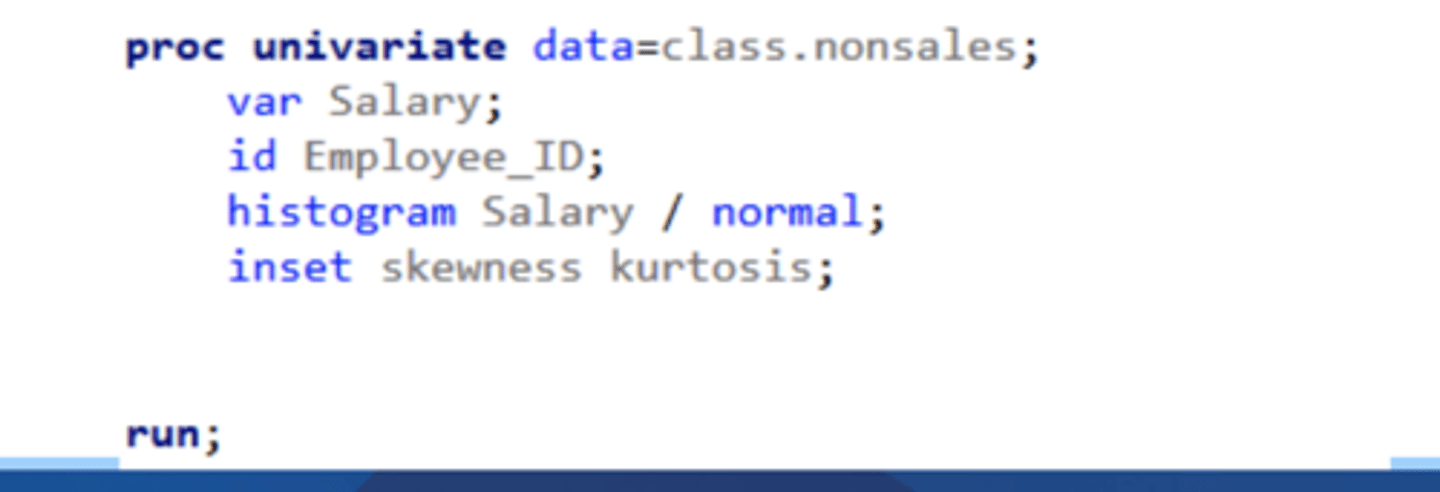
inset (proc univariate)
specifies statistics you might want to include on that plot (ex. skewness, kurtosis)
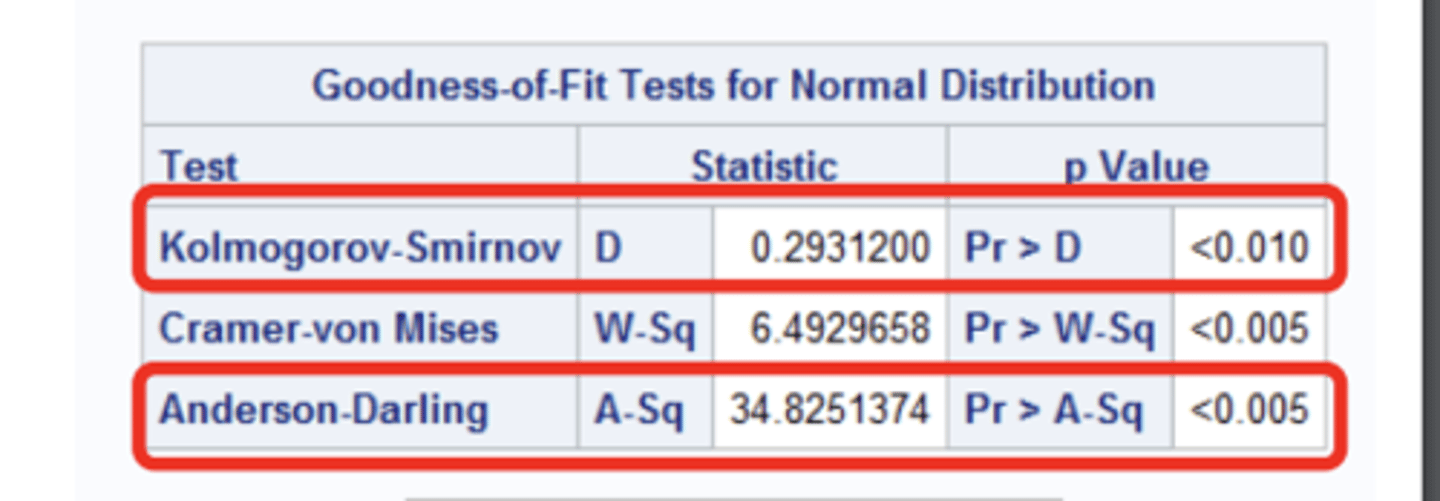
test for normalcy
want a p-value > 0.05 for normal distribution
2 tests for normalcy
1. Kolomogrov-Smirnov
2.Anderson- Darling
-Shows in a goodness of fit output after running a proc univariate with a histogram or probplot
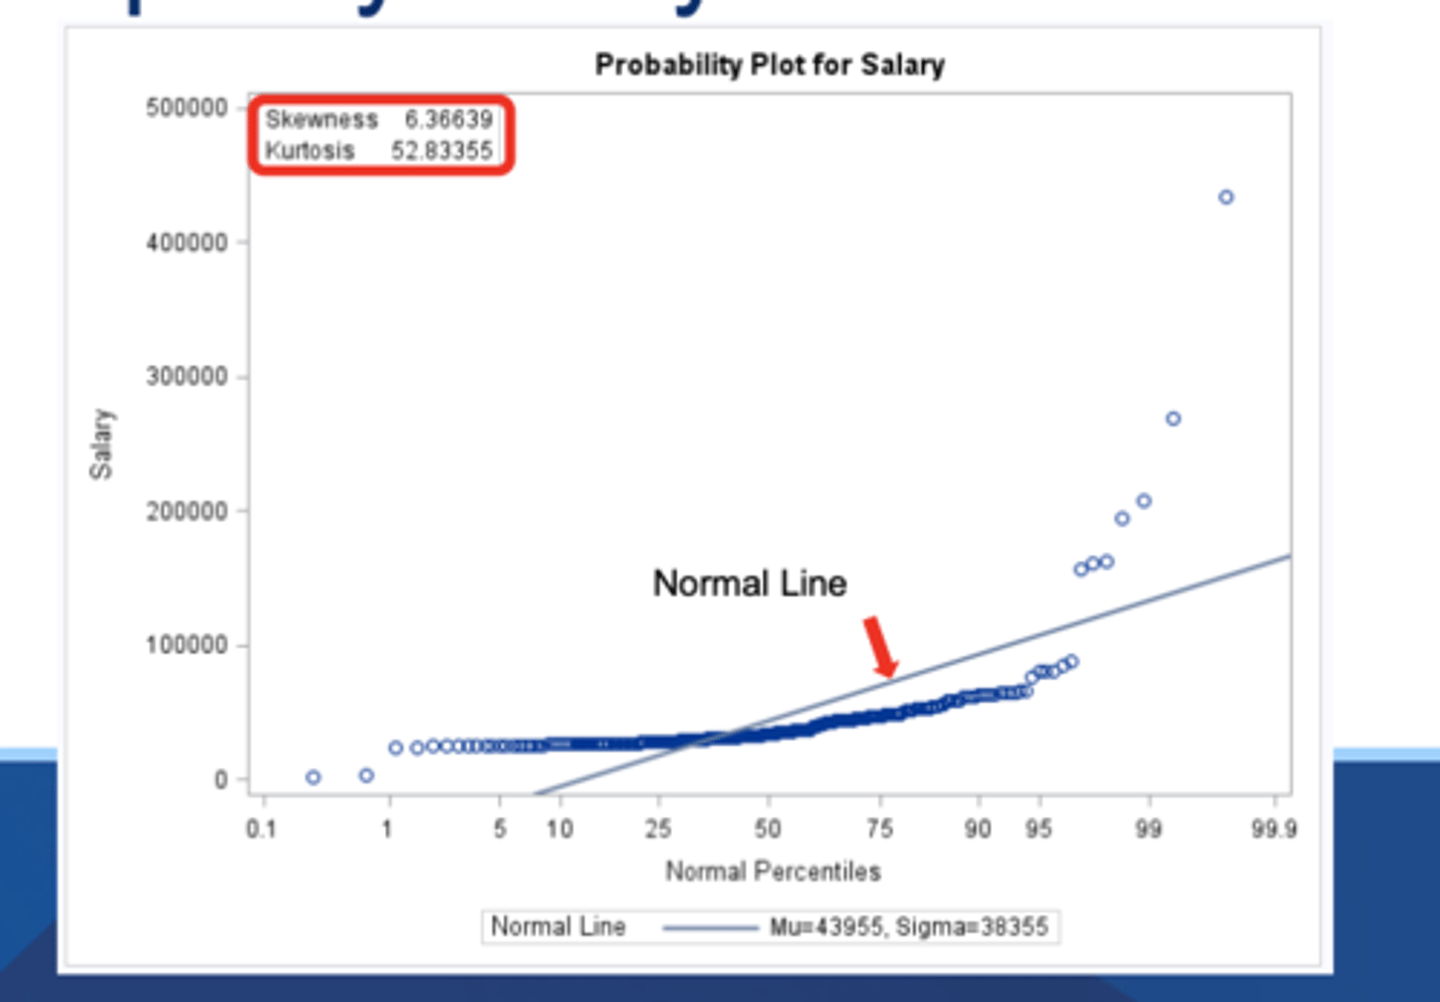
probplot
specifies what variables you want a plot for
options specify how you want the line drawn
(probplot variables </ options>;)
probplot output
line of best fit plus datapoints
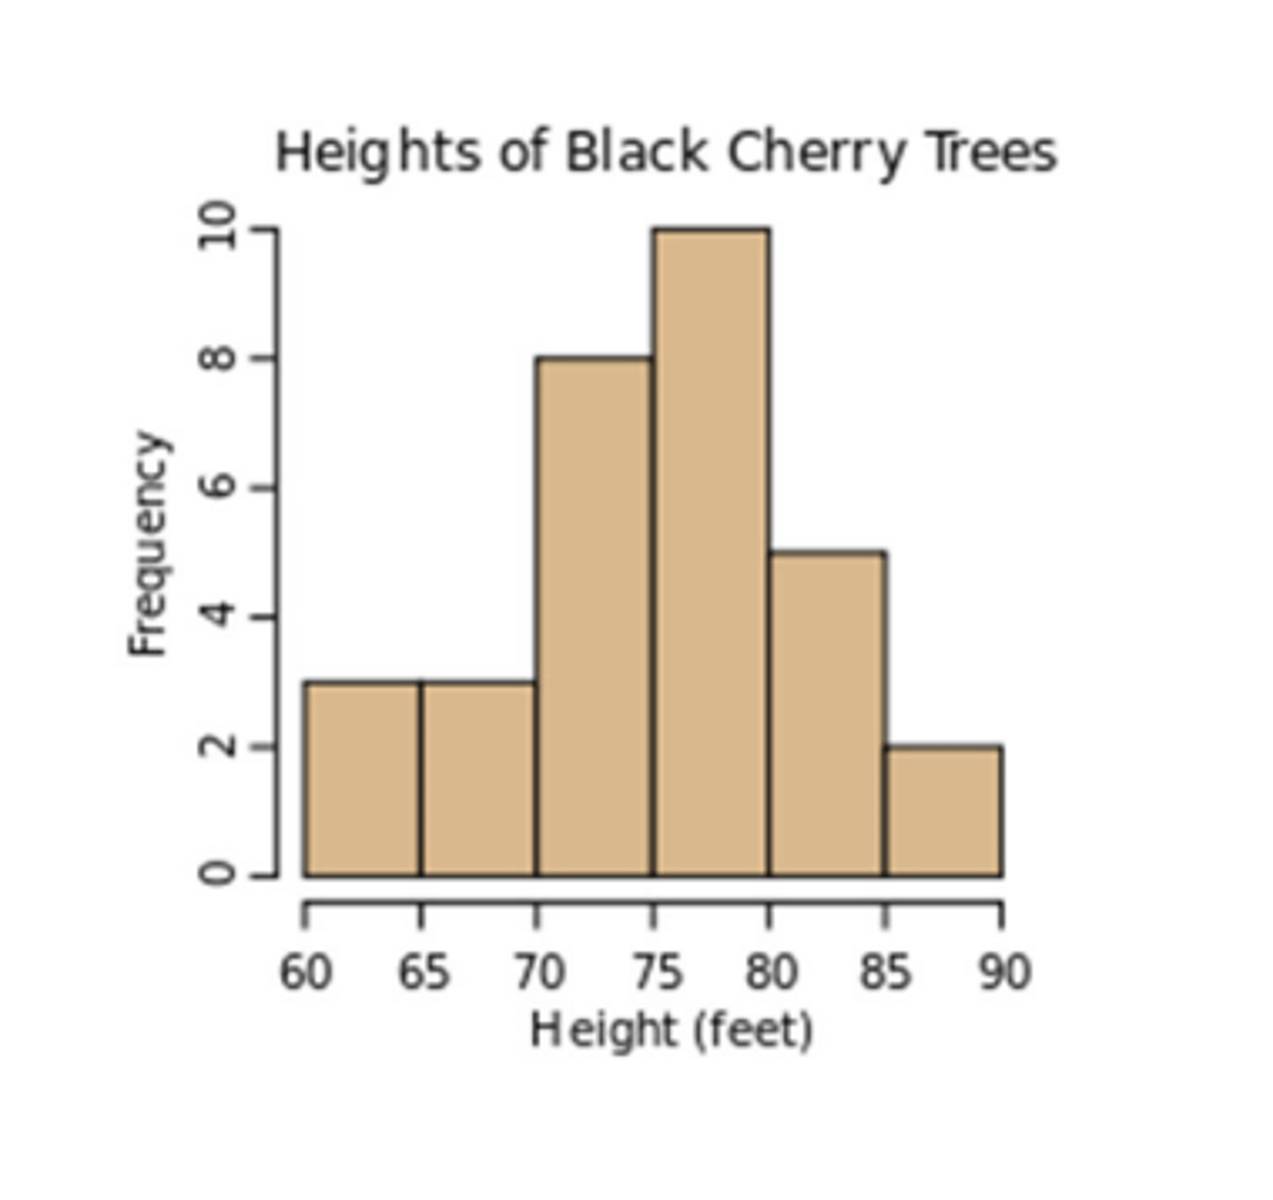
one-dimension data visualization
Histograms (binning)
- creating bins for a variable
- see how the variable looks
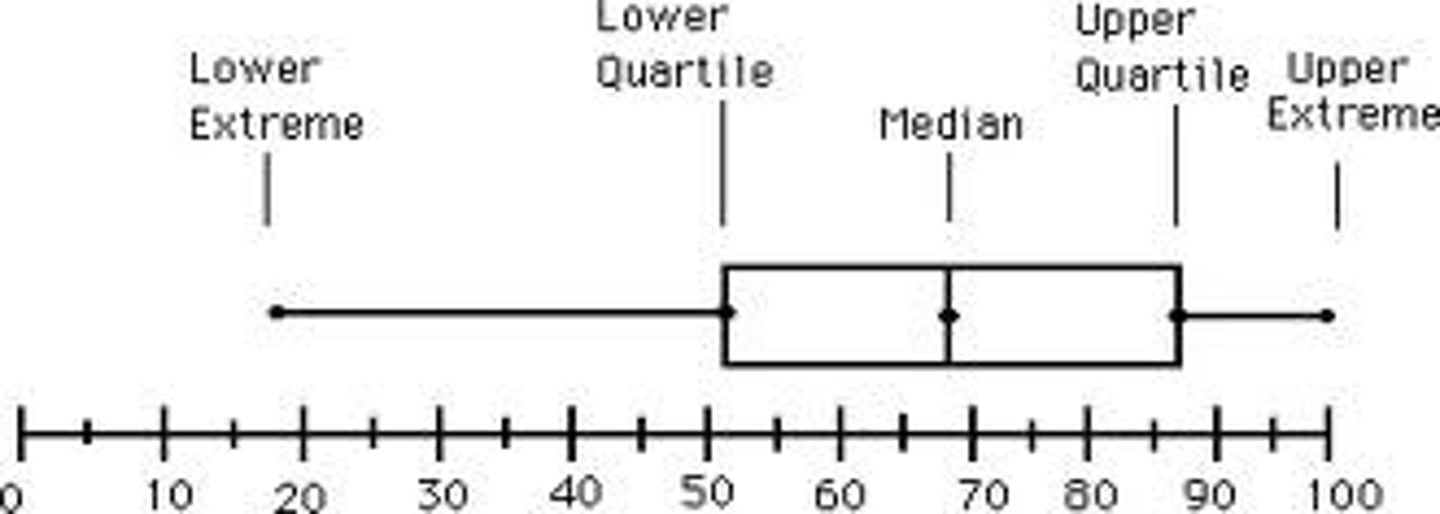
Box plots
graphical representation of the quartile statistics