AP HUGE Semester 1
1/288
Earn XP
Description and Tags
Name | Mastery | Learn | Test | Matching | Spaced | Call with Kai |
|---|
No analytics yet
Send a link to your students to track their progress
289 Terms
Map
A 2D representation of a geographic area or place
Map Scale
Distance on a map in relation to distance in actual space
Cartographer
A person who makes maps
Data Aggregation
The process of collecting and organizing large amounts of data
Spatial Perspective
The geographic perspective that identifies and explains the uses of space
Spatial Patterns
The placement or arrangement of objects on earth’s surface, includes space between those objects
Time-Distance Decay
Things that are near are more related than distant things, interaction decreases when further apart
Map Symbols
Graphic elements that help organize map information
Legend
A key showing meaning of symbols and colors on a map
Compass Rose
A drawing showing the four cardinal directions (N,E,S,W) and the map’s orientation
Absolute Direction
Corresponds compass direction (N,E,S,W) and combinations (NE, SW, etc
Scale
Territorial extent of an idea or object
Large Scale Maps
Zoomed in, more detail in a smaller area
Small Scale Maps
Zoomed out, less detail in a larger area
Absolute Distance
Distance that can be measured with a standard unit of length
Relative Distance
Measurement of level of social, cultural, or economic similarity between places.
Relative Direction
Direction that can be described as position (front, behind, left, etc) or describe movement
Elevation
The distance above sea level
Isodine
A line connecting or linking different places sharing common value (like evelation)
Topographic Map
3D representation of Earth’s surface
Reference Map
Shows geographic location on Earth’s surface
Ex: Roadmaps, GPS
Thematic Map
Emphasizes specific spatial patterns of geographic statistics or attributes and sometimes the relationship between them
Ex: Predominant soil type in several regions
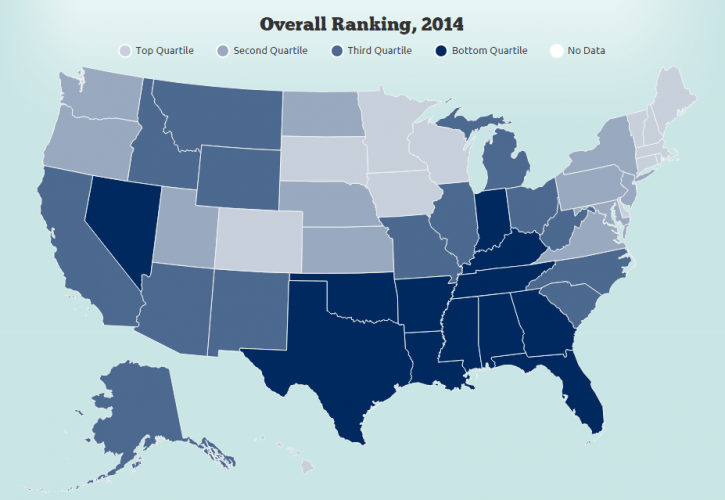
Choropleth Map
A thematic map showing data aggregated for a specific geographic area, often through different colors
Ex: presidential election maps (red & blue)
Cartogram
A thematic map that distorts geographic shape of an area to show the size of a specific variable
Larger cartogram area = larger underlying variable value
Ex: unemployment rate, world map represents size of country by population

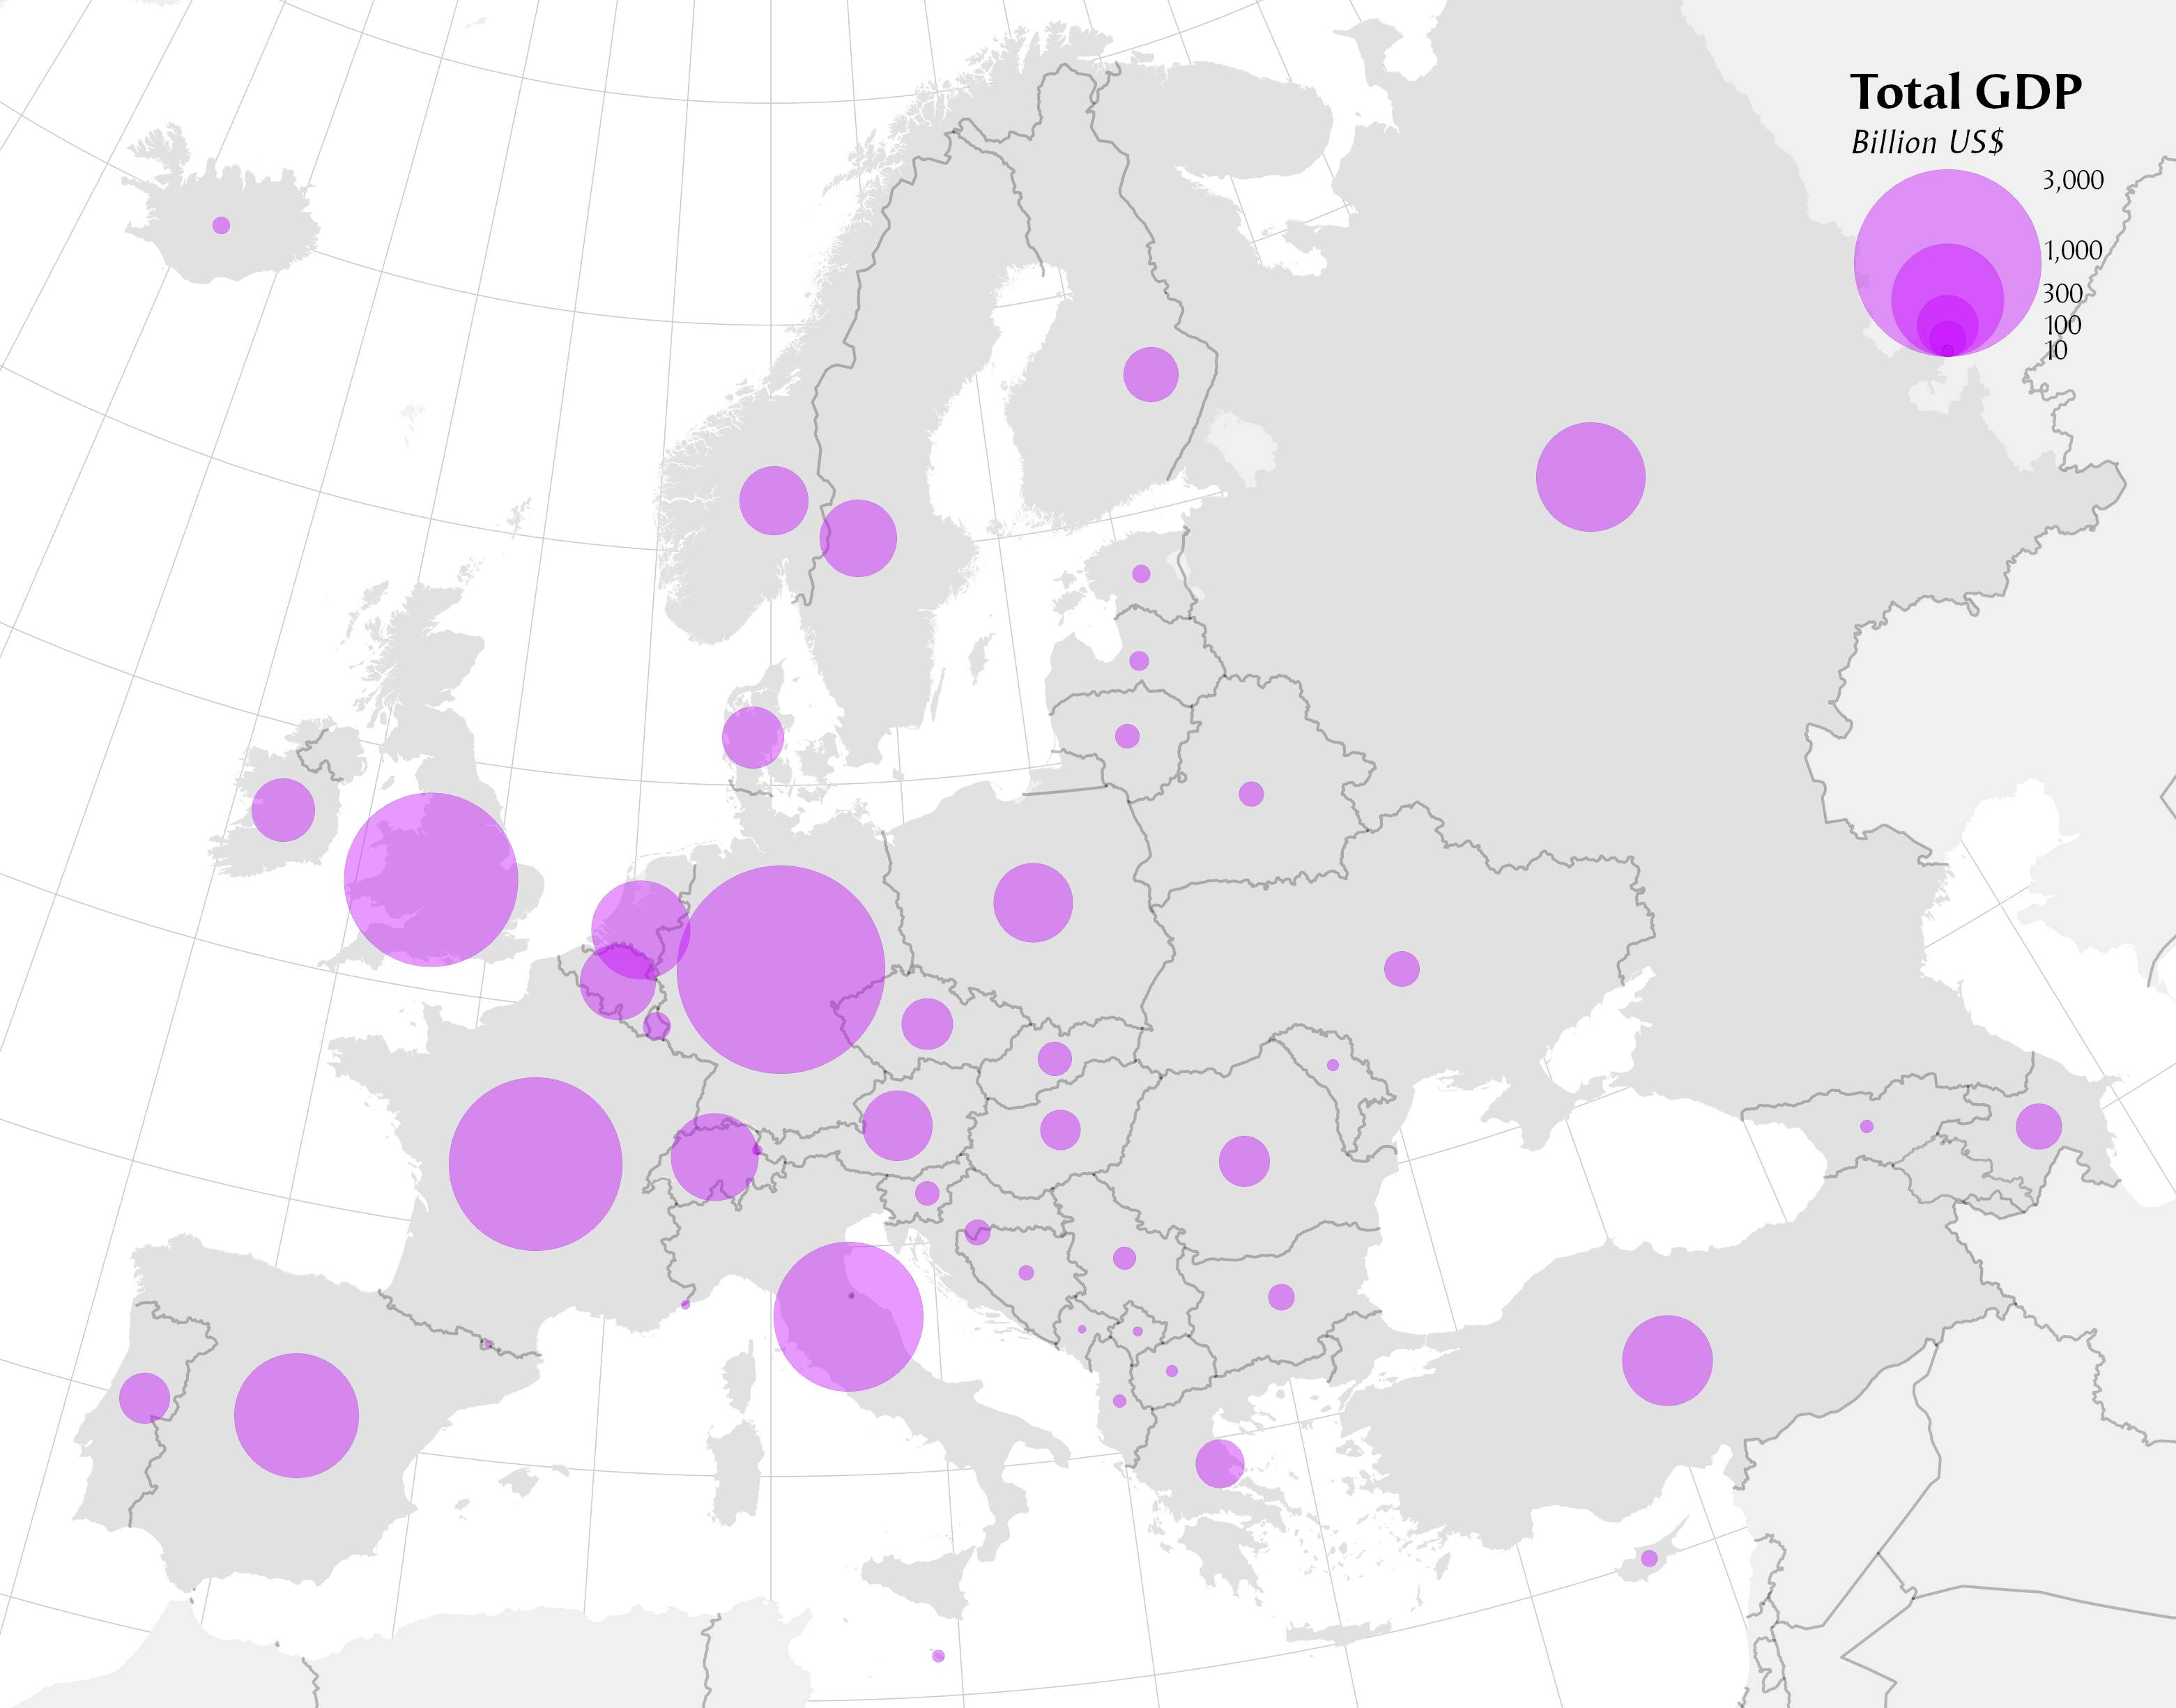
Proportional/Graduated Circle Maps
A thematic map that uses symbols of different sizes to represent numerical values
Population map showing larger population through larger circles
Dot Density/Distribution Map
A thematic map that uses dots to represent objects or counts, can represent one thing or many
Ex: A map showing where people live, one dot = 1,000 people

Map Projections
A method of representing the earth surface on a plane (2D) surface. ALL map projections distort shape, area, distance, or direction of Earth’s surface.
Mercator Projection
Pros: Useful for navigation
Cons: Landmasses are more distorted the further away from the equator, continent sizes aren’t accurate
Gall-Peters Projection
Pros: Shows Landmasses with their true areas (an equal-area projection)
Cons: Shape is greatly distorted

Goode-Homolosine Projection
Pros: An equal-area projection avoiding shape distortion and restrictions of a rectangular map
Cons: Splits the oceans

Polar Projection
Pros: Looks down at the earth from a perspective of one of the poles
Cons: Landmasses closer to the poles seem bigger than they actually are

Robinson Projection
Pros: Attempted to create the most visually appealing representation of the Earth by keeping all types of distortion relatively low
Cons: Some cut off at the curvatures

Scale of Analysis
The level at which data is grouped (what we study)
Global Scale of Analysis
Geographic phenomena across the entire world, increasingly important because of globalization
Ex: world pollution
Regional/Continental Scale of Analysis
Phenomena within a specific region
Ex: economic performance in different regions in Europe
National Scale of Analysis
Phenomena for a specific country
Ex: the average income in Vietnam vs Myanmar
Local Scale of Analysis
Geographic phenomena within a state or province, city or town, or neighborhood
Ex: data for different states in Germany
Glocal Perspective
Reflects the idea that global-scale processes affect individuals at a local state
Globalization
The process by which businesses and other organizations develop international influence or start operating on a global scale
Population Composition
The makeup of a population by age and sex as well as ethnic, racial, income, and educational background
Demographers
Experts in the study of statistics relating to the human population structure
Dependency Ratio
The number of dependents in a population each 100 working-age people (15-64) must support
100 * dependents/working age pop.
Youth Dependency Ratio
The number of young dependents (<15) in a population every 100 working-age people must support
Elderly Dependency Ratio
The number of elderly dependents in a population (64<) that every 100 working-age people must support
Generations
Groups of people born around the same time and share the same commonalities due to shared influences as they grew up
Sex Ratios
The ratio of the number of men to women in a population
Androcentrism
A phenomenon in which a culture demonstrates a marked preference for males
Infanticide
The practice of killing infants
Population Density
The total population divided by the land area
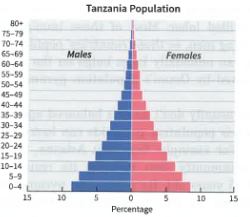
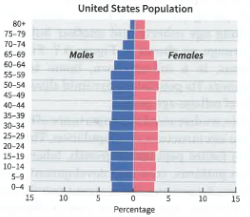
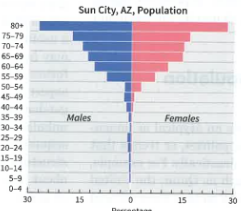
Population Pyramid
A very useful device for comparing age and sex structure at a particular time.
Triangle Shape (in pop. pyramid)
Rapid Growth
Usually occurs in developing countries
High birth rates & large young pop.
Countries could face challenges in education & creating jobs
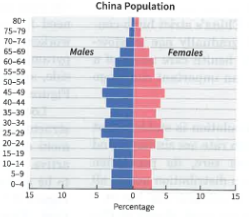
Cylindrical Shape (in pop. pyramid)
Slow Growth
Birth rate is just over death rate
Pop. will gradually age
Meeting health care needs could be challenging
Rectangle Shape (in pop. pyramid)
Stability
Birth rate = death rate
Pop. growth reaches 0
Fairly even distribution
Cup Shape (in pop. pyramid)
Decline
Low birth rate & negative pop. growth
Countries may experience an aging pop., labor shortage, and declining consumer demands
Population Dynamics
The growth and change of the human population on Earth
Demographic Equation
The method for calculating the total pop. of a place based on natural increase and migration over time.
pop. at the beginning of the period
+ total births
+ total in-migrants
- total deaths
- total out-migrants
__________________________________________
= pop. at the end of the period
Total Fertility Rate (TFR)
The average number of children born per woman during her reproductive lifetime (15-49)
TFR = 2.1 → Replacement level fertility (average number of children needed to replace parents & stabilize pop. over time)
TFR < 2.1 → Natural decline of pop. over a long time period, deaths > births
Crude Birth Rate (CBR)
The average number of births per 1,000 people
(live births in a year)/(total midyear pop.) * 1000
Low: 10-20, Transitional: 20-30, High: 30+
Crude Death Rate (CDR)
The number of deaths per year per 1,000 people
(total # of deaths in year)/(total midyear pop.) * 1000
More elderly population → higher CDR
Infant Mortality Rate (IMR)
How many infants die within the first year of their life per 1,000 live births
Indicator of living standards
Rate of Natural Increase (RNI)
The difference between number of births and deaths in a given year when expressed as a percentage of the total pop.
(CBR - CDR)/ 10
+RNI: births > deaths, -RNI: births < deaths
Demographic Transition Model (DTM)
A model that conceptualizes how CBR, CDR, & RNI changes over time as countries goes through industrialization & urbanization
DTM Stage 1: High Stationary Stage
Birth and death rates are both high
Slow growth
No country is in stage 1
DTM Stage 2: Early Expanding Stage
Death rates drop rapidly & pop. grows slowly
High birth rates
Many sub-Saharan countries are in stage 2
DTM Stage 3: Late Expanding Stage
Birth rates decline, RNI decreases, death rate decreases slowly
Many developing countries are in this stage
DTM Stage 4: Low Stationary Stage
Birth & death rates are similar at lower levels
Pop. grows slowly and is aging
Many developed countries are at stage 4
DTM Stage 5: Natural Decrease Stage
Birth rates are continuously below death rates
RNI decreases
Some countries, like Japan & some European countries, are in stage 5
Antinatalist Policies
Designed to curtail population growth by reducing fertility rates
Ex: China’s birth control policy (“one couple, one child”)
Pronatalist Policies
Designed to boost fertility rates & ultimately population growth
Ex: Denmark
Women’s Empowerment
The increased autonomy of women to make choices and shape their lives
Women’s Access to Education’s Impact
Tend to marry later with fewer children (lower TFR)
Improves economic development
Women’s Access to Family Planning’s Impact
Drop in fertility rates
Women’s Access to Economic Opportunity’s Impact
May encourage women to delay marriages, reduce ideal family size, & increased family planning (lower TFR)
Women might work to support a larger family
Spatial Mobility
All forms of geographical movement, including people’s everyday commuting & travels
Migration
Long-term or permanent relocation of individuals, families, or entire communities from one place to another
Migrant
A person who migrates or moves
Emigration
Act of a migrant leaving their origin
Emigrants
People who leave their country of origin
Immigration
Act of migrant arriving at their destination country
Immigrant
People who arrive at their destination
Migration Stream
Migrants moving from origin → destination
Counterstream
Migrants moving from destination → origin
Net Migration Rate (NMR)
The guague of the impact of migration on pop. change
(country’s net migration)/(total pop.) * 1000
+NMR: net inflow, -NMR: net outflow
Brain Drain
A phenomenon where a place loses young, more educated and skilled people through migration
Brain Gain
A phenomenon where a place gains young, more educated and skilled people through migration
Push Factors
Factors that cause people to be dissatisfied with their present locales and want to move
Ex: war
Pull Factors
Attributes of other places that make them appealing to potential migrants
Ex: job opportunities
Intervening Opportunity
A nearby attractive locale where migrant decides to settle instead of going to their intended destination further away
Intervening Obstacles
Complications that potential migrants will need to overcome to reach their destination
Voluntary Migration
Migration that is done willingly
International Migration
When people cross national borders to live in another country
Boundaries can restrict migration
Ex: guest worker
Guest Worker
A person with temporary permission to work in another country
Transnational Migration
When migrants move back and forth between their home countries and those to which they’ve migrated
Better communication & transportation allow this to occur easier
Internal/Interregional Migration
When people move within the borders of a country
Ex: rural-to-urban migration, great migration
The Great Migration
20th century movement of 6 million rural African Americans in South moved to Midwestern and northeastern cities in the U.S. due to racism
Step Migration
Migration carried out in stages usually to more bigger and distance places
Can take a lot of time
Ex: when a migrant doesn’t want to be far from home at first
Chain Migration
When migrants return to their previous place of residence or origin
Ex: retirees could return
Seasonal Migration
Migration based on the time of the year
Ex: transhumance
Forced Migration
Caused by forces out of one’s control
Refugee
People who leave their country because of persecution based on race, ethnicity, religion, nationality, or political opinion