Subsidy - Full market impact
1/14
There's no tags or description
Looks like no tags are added yet.
Name | Mastery | Learn | Test | Matching | Spaced | Call with Kai |
|---|
No analytics yet
Send a link to your students to track their progress
15 Terms
What are subsidies?
Two main reasons for subsidies:
Solve market failure.
Increase affordability of goods/services.
How do subsidies solve market failure?
Encourages consumption/production of beneficial goods/services.
Examples: Vaccinations, healthcare, education.
How do subsidies increase affordability?
Reduces the price of necessity goods/services.
Helps low-income households access the market.
What is the impact of subsidies on the supply curve?
reduces the cost of production (COP) for firms.
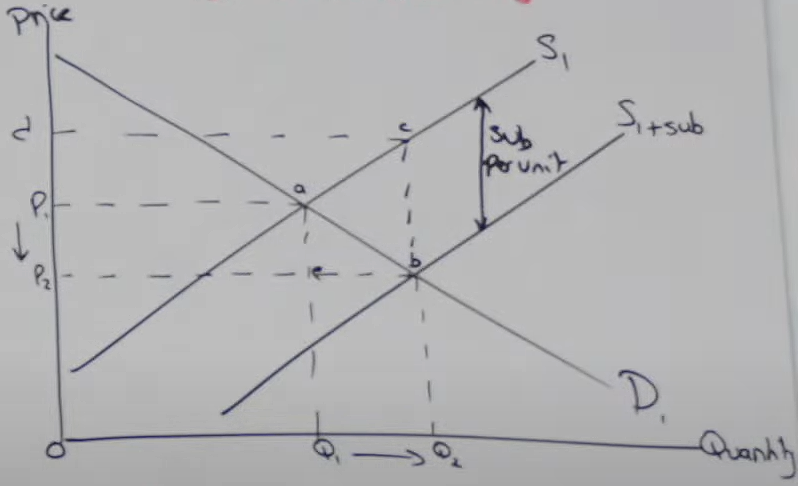
Shifts the supply curve to the right (S1 to S1+sub).
The vertical distance between the two supply curves equals the subsidy per unit.

What happens to price and quantity due to a subsidy?
Price (P) decreases: P1 to P2.
Quantity (Q) increases: Q1 to Q2

What is the government cost of a subsidy?
The area of the rectangle: P2, b, c, d.
Calculated as: Subsidy per unit (b to c) x Quantity (up to Q2).

How does producer revenue change with a subsidy?
Increases from: P1, a, Q1, 0 to d, c, Q2, 0.
Subsidy goes to producers, so government cost equals producer revenue.
What is consumer savings with a subsidy?
Area: P1, P2, a, e.
Consumers pay a lower price (P1 to P2).
Consumer surplus increases.

What is deadweight loss (DWL) from a subsidy?
DWL is the area: A, B, C.

How is the government cost of a subsidy calculated?
Vertical distance between supply curves (b to c) is the subsidy per unit.
Multiply subsidy per unit by all units produced (up to Q2).
Total area: P1, b, c, d.
Why do consumers like subsidies?
Prices fall.
Consumer surplus increases.
Greater access to goods/services.
What are the long-term costs of subsidies for consumers?
Funded through:
Taxes (hurts consumers).
Cuts in other government spending.
Government borrowing (creates debt).
Why do producers like subsidies?
Revenue increases significantly.
Producer surplus rises.
Greater employment as quantity increases.
Why do governments like subsidies?
Achieves goals:
Solves market failures.
Increases affordability.
What concerns do governments have about subsidies?
Expensive to fund.
Risk of producers misusing subsidies.
Long-term dependency by producers.
May lead to rising costs of production (COP) over time.