Classification and Evolution Statistics
 Call Kai
 Learn
Learn Practice Test
 Spaced Repetition
 Match
Match Flashcards
 Knowt Play
1/5

There's no tags or description
Looks like no tags are added yet.
Name | Mastery | Learn | Test | Matching | Spaced | Call with Kai | Chat |
|---|
No analytics yet
Send a link to your students to track their progress
6 Terms
What is the meaning of mean, median, mode and anomaly?
Mean - sum of data values divided by number of data values
Median - middle value of data set (n+1/2)
Mode - most frequent value
Anomaly - value in dataset that is not part of inherent variation
Describe what is meant by ‘normal distribution’ and how variety is linked?
When the mean, median and mode are the same
50% of values are = to or greater than mean and 50% of values are = to or less than mean
The level of variation around mean value can vary when there is normal distribution
For data showing continuous variation, the spread depends on sample size
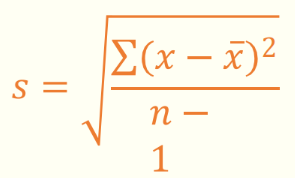
What does standard deviation measure? What does a larger or lower SD mean? What does the symbols in the equation represent?
Spread of data around the mean
The greater the SD, the more variable or spread out data is
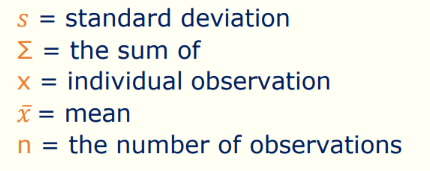
How do you calculate SD?
Find mean
Subtract mean from each individual value
Square each result for each individual value
Find the sum of the resulting values
Substitute into SD formula
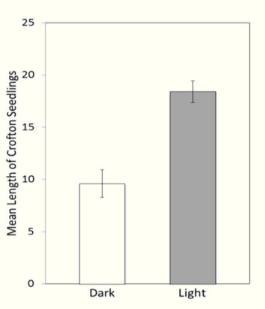
What do error bars show? Which results on a standard deviation graph would show the most variability? How would you know if there is a significant statistical difference between results from error bars?
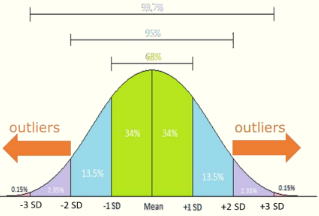
Number of SD either side of the mean e.g. a 95% of values for normal distribution lie within 2 SD of the mean
Visual display on a graph of variation around the mean, usually shown as mean + and - 1 SD
Longer error bars show more variability
There is significant statistical difference if error bars do not overlap
How can you interpret SD?
Can calculate the range of values that lie close to the mean
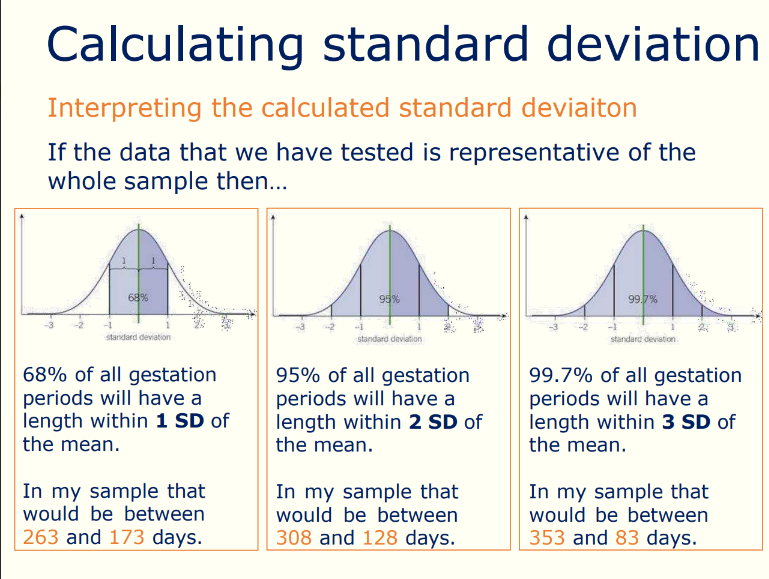
Empirical rule for normal distribution - 1 SD: 68% of values lie within mean + or - 1 SD
2 SD: 95% within mean + or - 2 SD
3 SD: 99.7% within mean + or - 3 SD