Week 5: Global Warming
1/50
There's no tags or description
Looks like no tags are added yet.
Name | Mastery | Learn | Test | Matching | Spaced |
|---|
No study sessions yet.
51 Terms
What is the IPCC
Intergovernmental Panel on Climate change, the United Nations body for assessing climate change science
Provides scientific information to governments that they can use to develop climate policies
Organisation of governments that are members of the United Nations (UN) or World Meteorological Organisation (WMO)
Radiative forcing
measure of the influence a factor has in altering the balance of incoming and outgoing energy in the Earth-atmosphere system
What does a positive radiative forcing result lead to?
a net positive radiative flux that will warm the Earth
Radiative forcing agents
Anthropogenic
GHG
Ozone
Stratospheric water vapour from CH4
Surface Albedo
Contrails
Aerosol-Radiation Interaction
Aerosol- Cloud Interaction
Natural
Solar Irradiance
Positive Forcings
GHG forcing rising
Other anthro rising
Solar 11-year cycle
Negative Forcings
Aerosol forcings peaked in the 1980s, stable-ish
Land-use (deforestation)
Periodic volcanic eruptions
What can offset the forcing from GHGs?
roughly one third of the forcing from Greenhouse gases is offset by the cooling effect of anthropogenic aerosols.
Cleaning up particulate (aerosol) pollution will remove this cooling effect and result in greater warming
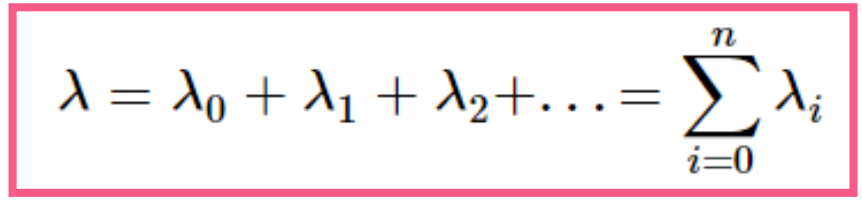
What does the climate feedback parameter do?
determines how sensitive the climate is to changes in forcing
the feedback parameter is linearly related to surface temperature it is possible to break it down into linearly additive components:
What happens to the Earth's radiative flux as the planet warms in response to a radiative forcing?
Internal changes occur in the Earth's radiative processes, altering its radiative flux
What assumption is made about changes in the top-of-atmosphere radiative flux (𝐹𝑇𝑂𝐴) in relation to surface temperature?
It is assumed that changes in 𝐹𝑇𝑂𝐴 are proportional to changes in surface temperature (𝑇𝑠)
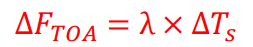
What is λ in the context of climate feedbacks?
λ is the climate feedback parameter, with units of Wm⁻²K⁻¹
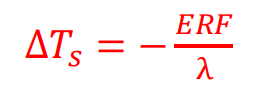
What condition must the climate feedback parameter λ meet for Earth to stabilize at a new temperature?
λ must be negative
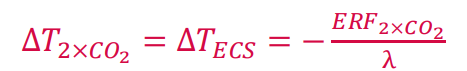
In equilibrium, how is the surface temperature response related to effective radiative forcing (ERF)?
The surface temperature response is given by:
What is the strongest negative feedback in the climate system?
Planck or Black-body Feedback
Water Vapour Feedback
As air warms it carries more water vapour (~7% °C-1)
As the planet warms there is more water vapour in atmosphere
Water vapour is a powerful GHG, so this adds to warming effect producing a positive feedback
Lapse Rate Feedback
Water vapour has stronger warming effect at high altitudes
This decreases the rate at which temperature decreases with altitude (lapse rate)
Warmer temperatures at high altitudes increase outgoing infrared radiation
therefore lapse-rate feedback is negative
Cloud Feedbacks
Clouds scatter light producing a strong negative shortwave forcing (~-50 W-2).
They also absorb longwave radiation producing a positive longwave forcing (~30 Wm-2)
Climate change affects clouds in a variety of ways
believed to produce a net positive feedback, though it is very uncertain
Snow, ice and surface albedo feedback
As temperatures rise, snow and ice melts. Snow and ice have much higher albedos than the surfaces they cover.
So as they melt the surface albedo drops and more sunlight is absorbed, producing a positive feedback
Where is the snow, ice and surface albedo feedback effect the greatest?
greatest at the poles and contribute to the greater warming seen there, known as “polar amplification”
How much faster do the poles warm compared to the rest of the globe?
x4
Water Vapour Feedback + Lapse Rate Feedback
often combined
strongly coupled so arguably a single feedback
What is Equilibrium Climate Sensitivity (ECS)?
The equilibrium increase in global mean temperature in response to a doubling of CO₂ concentrations.
What is the estimated range of ECS according to the Intergovernmental Panel on Climate Change (IPCC)?
Between 1.5°C and 4.5°C
Best estimate = 3°C
What is Equilibrium Climate Sensitivity (ECS) inversely proportional to?
the climate feedback parameter (λ):
What does the Gregory plot show?
A linear relationship between top-of-atmosphere (TOA) radiative imbalance and global mean temperature in an instantaneous forcing experiment.

In a Gregory plot, what does the Y-intercept represent?
radiative forcing
In a Gregory plot, what does the X-intercept represent?
The equilibrium temperature response, or ECS in the case of a 2xCO₂ experiment.
Why is the Gregory plot useful to climate modelers?
It allows them to estimate both radiative forcing and equilibrium climate sensitivity in a relatively short model run
What determines the long-term temperature response to forcing?
the ocean
oceans x 4 heat capacity compared to air → large energy resevoir
How much of the heat trapped by anthropogenic actions are in the oceans?
93%
~40% of that has accumulated in the top 300m
~60% in the top 700m.
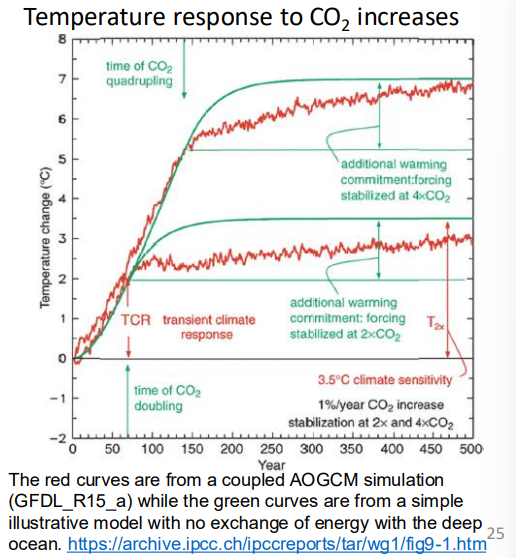
What is a transient climate response?
the temperature at the point at which CO2 concentrations double in an experiment where CO2 rises at 1% per year
Why is TCR a more relevant metric for estimating the magnitude of global warming this century than ECS?
closer to reality → don’t double CO2 overnight but slowly adding over time
useful → 70 yrs good approximation of human lifetime
What is the estimated range of the TCR?
1.0°C to 2.5°C
(as compared to the 1.5°C to 4.5°C of ECS)
TCR vs. ECR
This figure shows CO2 concentration increasing at 1% per year until it reaches 2xCO2 or 4xCO2 where it stops
Temperature rises linearly while CO2 concentration increases exponentially
Remember CO2 forcing rises logarithmically with CO2
Temperatures then slowly evolve towards their equilibrium value as the oceans warm
The less negative the feedback parameter is…
the more the planet must warm to reach a new radiative equilibrium
the higher the climate sensitivity
What affects the temperature difference between ECS and TCR?
ECS (the equilibrium temperature response to 2xCO2) is always greater than TCR (temperature at point CO2 doubles in experiment where CO2 is 1% higher per year): ECS > TCR
The less efficient the ocean is at transferring heat from the surface to the deep ocean, the greater the fraction of this warming realized this century → the smaller the difference between ECS and TCR.
How much is a gigaton of carbon (GtC)?
1012 kg
Primary sources of anthropogenic CO2
burning fossil fuels
land-use change (e.g. deforestation) is also an important source
Where have CO2 ended up?
~45% in the atmosphere
~30% in the land
~25% in the ocean
Energy Use
Fossil fuels are burned to produce energy so energy production must be decarbonized to bring emissions down
Despite rapid growth in wind and solar generation in recent years, fossil fuel generation continues to rise, driven by the demand for more energy
Other low -carbon energy sources, except nuclear, have also grown
Who is emitting the CO2
China is the world’s largest emitter of CO 2 but its per capita emissions are less than half that of the USA
India is a rapidly growing source of CO 2 emissions, but its per capita emissions are still less than half that of the global - mean.
Another measure = cumulative CO2 emissions → US
The Kaya Identity
The Kaya identity relates a set of key drivers for CO2 emissions, allowing their relative contributions to be assessed.

Economic Growth and CO2 emissions
Economic growth has contributed about twice what population growth has to emissions
The economy is becoming more energy efficient, countering growth in economy and population
CO2 emissions have risen in lockstep with energy use → There has been no progress in decarbonising energy supply
The Representative Concentration Pathways (RCPs)
A set of scenarios or pathways including time series of concentrations and emissions of:
greenhouse gases, aerosols and chemically active gases
land use/land cover
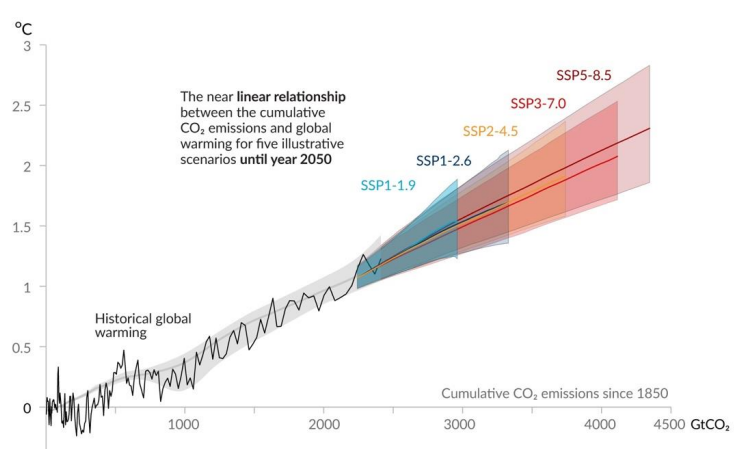
The Shared Socioeconomic Pathways (SSPs)
a set of scenarios or pathways depicting potential future global societal changes including:
policy
(in)equality
economic development
energy use
Goal of Paris 2015 Climate Agreement
set a goal of limiting warming to less than 2 or 1.5 C
the commitments made by countries (if met) may lead to something closer to 3 C
Global warming potential of non-CO2 GHGs
While CO2 doesn’t break down in the atmosphere many greenhouse gases (GHGs) do.
GHGs have different strengths and lifetimes, e.g. methane is hundreds of times stronger but has a lifetime of ~12 years
The global warming potential relates the amount of heat that different GHGs trap relative to CO2 (CO2= 1) over a specified time horizon (e.g. 100 years)
This allows different GHGs to be combined into an equivalent CO2 concentration
The Montreal Protocol
Montreal Protocol on Substances that Deplete the Ozone Layer
agreement that regulates the production and consumption of nearly 100 man-made chemicals referred to as ozone depleting substances (ODS) → CFCs
adopted on 16 September 1987, the Protocol is to date one of the rare treaties to achieve universal ratification.
Cumulative emission and carbon budgets
This linear relationship between cumulative CO2 emissions and temperatures allows us to calculate the remaining carbon budget left to limit warming below certain thresholds
For a 67% chance of staying below the threshold there are 400 and 1150 GtCO2 remaining, for 1.5°C and 2.0 °C
The world emits ~40 GtCO2 each year.
Why is the relationship between temperature and cumulative emissions linear?
Two main factors acting in opposite directions
The fraction of CO2 that remains in the atmosphere after emission drops over time
The temperature response to the CO2 already in the atmosphere takes time to be realised
This also means that we can expect temperatures to plateau when we reach net zero emissions, only falling very slowly.
The Transient Climate Response to Cumulative Emissions
The Transient Climate Response to Cumulative Emissions (TCRE) measures the temperature response (∆𝑇𝐴𝑛𝑡ℎ) to the total amount of CO2 emissions (𝐸)
The TCRE gives the gradient of the graph
𝑇𝐶𝑅𝐸 = ∆𝑇𝐴𝑛𝑡ℎ / Τ𝐸
Models with a higher value of TCR will have a higher value of TCRE.