2.3.1 Climate changes from the start of the Quaternary period
1/17
There's no tags or description
Looks like no tags are added yet.
Name | Mastery | Learn | Test | Matching | Spaced |
|---|
No study sessions yet.
18 Terms
How is time split in geological terms?
periods - tens of millions of years
epochs - the smallest unit of geologic time, lasting millions of years
Which epoch and period do we live in currently?
We live in the Holocene epoch within the Quaternary period.
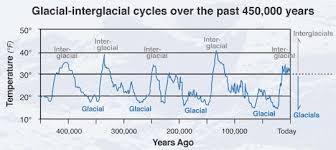
How has climate changed during the quaternary geological?
During the last 2.6 million years (quaternary geological), the temperatures have fluctuated wildly; however, there has been a gradually overall cooling.
In the graph, the cold spikes are the glacial periods when ice advances from the North pole to parts of Europe and North America.
In between are the warmer interglacial periods (where we are currently).
The pattern shows that cold glacial periods alternate with warm interglacial periods.
Today’s average temperature is higher than almost all of the quaternary period. The current warm period that began some 10,000 years ago could turn out to be another interglacial, with ice returning at some point in the future.
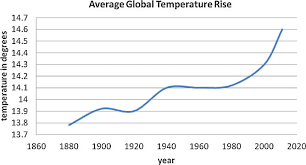
What has happened to the global average temperature since 1880?
It suggests clearly that in the last few decades, there is a general warming trend and has increased significantly since 1980.
This is known as global warming.
What are the key periods of warming since AD 1000?
The Medieval Warm Period (MWP)
The Little Ice Age
The last 100 years
Describe the Medieval Warm Period.
It lasted from about 950 to 1250 and was a time of warm climate in the North Atlantic region.
The global temperature on average was cooler than it is now.
Describe the Little Ice Age.
It lasted from 1300 to 1870 and it was when parts of Europe and North America experienced much colder winters than today.
The coldest periods were in the 15th and 17th century.
Describe the consequences of the Little Ice age on Europe.
Throughout Northern Europe, rivers froze and people suffered from intensely cold winters when food supplies were limited.
The sea froze around parts of the UK and regular ‘frost fairs’ were held on the river Thames.
As crops failed, many people decided to emigrate. Iceland lost half its population.
The price of grain and crops increased
Vineyards in much of Europe became unproductive.
Despite these harsh climate conditions, European culture and innovation flourished. Huge innovations in agriculture, UK and sea trading expanded…Perhaps, the Little Ice Age triggered these human responses.
Describe the last 100 years.
Modern global warming has occurred as the Earth’s average surface air temperature has increased by around 1’C.
The ocean temperatures have been the warmest since 1850.
What are the 4 evidence for climate change?
Global temperature data
Ice core data
Tree r
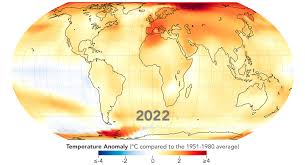
What are global temperature data maps?
They show variations from the long-term average. Studying the colour key, it suggests a warming trend for most of the world.
NASA suggests that the average global temperatures have increased by 0.6’C since 1950 and o.85’C since 1850.
What are the advantages and disadvantages of global temperature data?
Computer programmes are used to produce these maps, making them fairly reliable and accurate.
It uses data collected from over 1000 ground weather stations and satellites, making them cover a fairly large area, making them more accurate.
However, weather stations are not evenly distributed across the world and in some regions, especially in Africa who have a sparse network. This makes it less reliable.
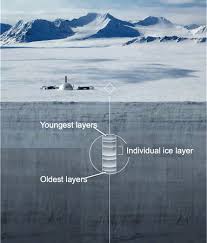
What are ice cores?
Ice cores are when snow falls in cold polar environments, it gradually builds up layer upon layer, year upon year. The buried layers of snow are compressed and gradually turn into ice.
The Antarctic ice sheet is nearly 5 km thick in places and the oldest ice (at its base) is thought to be 800,000 years old.
Scientists are able to drill deep into the ice to extract cylindrical cores. By analysing the trapped water molecules, scientists can calculate the temp. of the atmosphere when the snow fell.
What are the advantages and disadvantages of ice cores?
The layers of ice within a core can be dated accurately
can show fluctuating temperatures that indicate past glacial and inter-glacial periods.
they can only be found in places like Antarctic and Greenland
they require hard manual labour
requires a lot of set-up (expensive?)
What are tree rings?
Every year, the growth of a tree is shown by a single ring.
If the ring is narrow, it indicates a cooler drier year.
If it is thicker, it means the temperature was warmer and wetter.
These patterns of growth are used to produce tree ring timescales.
What are the advantages and disadvantages of tree rings?
accurate climate information
requires the destruction of trees
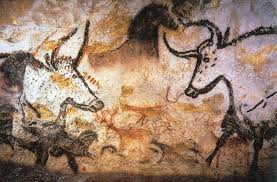
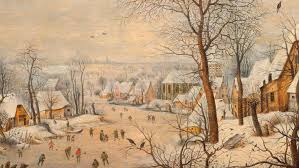
What are paintings and diaries?
They are historical records which include:
Ancient cave paintings of animals in France and Spain (they depict nature as it was between 40,000 and 11,000 years ago)
Winter landscapes of the Little Ice Age
What are the advantages and disadvantages of paintings and diaries?
can show periods before written records
they extend the period of recording, enabling better analysis of long term trends
can show whether there were more extremes in the past
difficulty in dating exactly when the evidence was
some records from particular locations or times are not exactly where we need them to be.
may be prone to exaggeration, may lack objective accuracy