2.3 Competitive Market Equilibrium
1/22
There's no tags or description
Looks like no tags are added yet.
Name | Mastery | Learn | Test | Matching | Spaced |
|---|
No study sessions yet.
23 Terms
Diagram - Market Equilibrium
Draw it (Market Equilibrium)
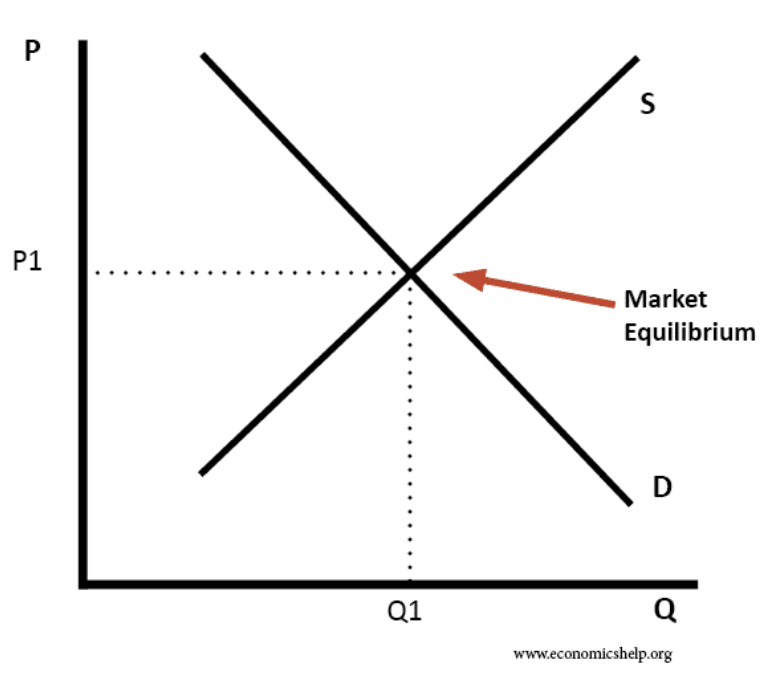
Market Equilibrium
Quantity demanded for a product is equal to the quantity supplied, no shortages or surpluses
Market Disequilibrium
Surplus and Shortage
Surplus
The supply of a product exceeds its demand as the price is set higher than market equilibrium
Shortage
The demand of a product exceeds its supply as the price is set lower than market equilibrium
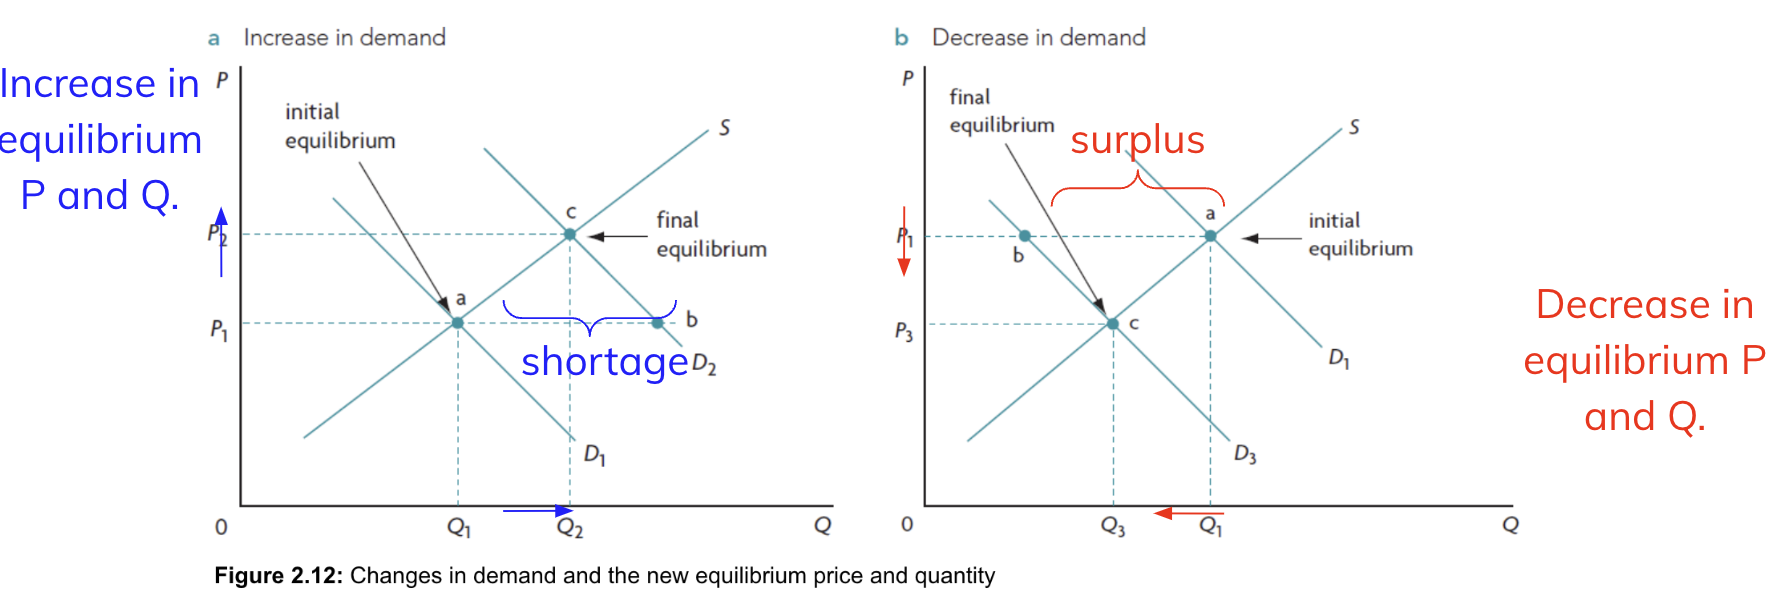
Shift in Demand / Supply
Creates a new market equilibrium, change in amount of resources allocated
Price Mechanism
Determines what to produce
Functions of Price Mechanism
Signals and incentives to determine allocation of scarce resources (ARSI)
(A)RSI
Allocate scarce resources efficiently
A(R)SI
Ration scarce resources through encouraging / discouraging consumption
AR(S)I
Signals excess demand / supply and need for increase / decrease resources
ARS(I)
Incentives for producers to increase / decrease output to optimise profit
Diagram - Changes in Equilibrium and Role of Price Mechanism
Draw it (Changes in Equilibrium)
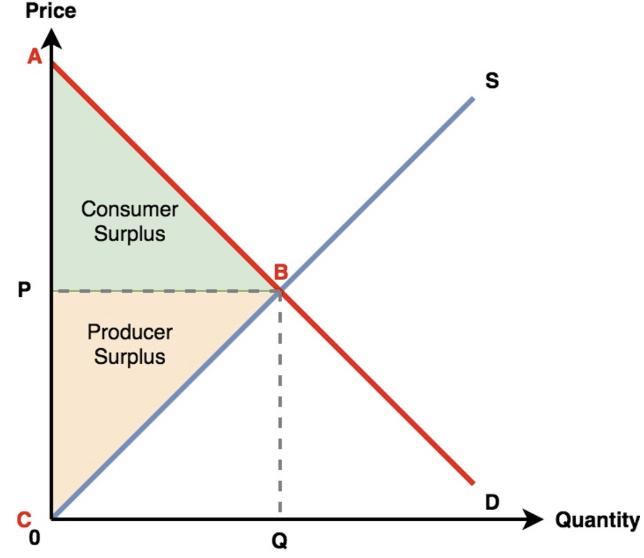
Consumer Surplus
Extra satisfaction gained by consumers paying a price lower than price willing and able to pay
Producer Surplus
Extra earnings gained by producer makes from a given quantity of output, more than the amount prepared to accept
Diagram - Consumer and Producer Surplus
Draw it (Consumer and Producer Surplus)
Demand curve reflects…
the marginal benefit of the consumers from consuming a good / service
Supply curve reflects…
the marginal cost of producing a good / service
Allocative Efficiency
Optimal allocation of resources according to society's point of view, allocated to the wants and needs of consumers and producers, what and how to best produce
Total Community / Social Surplus
Consumer Surplus + Producer Surplus
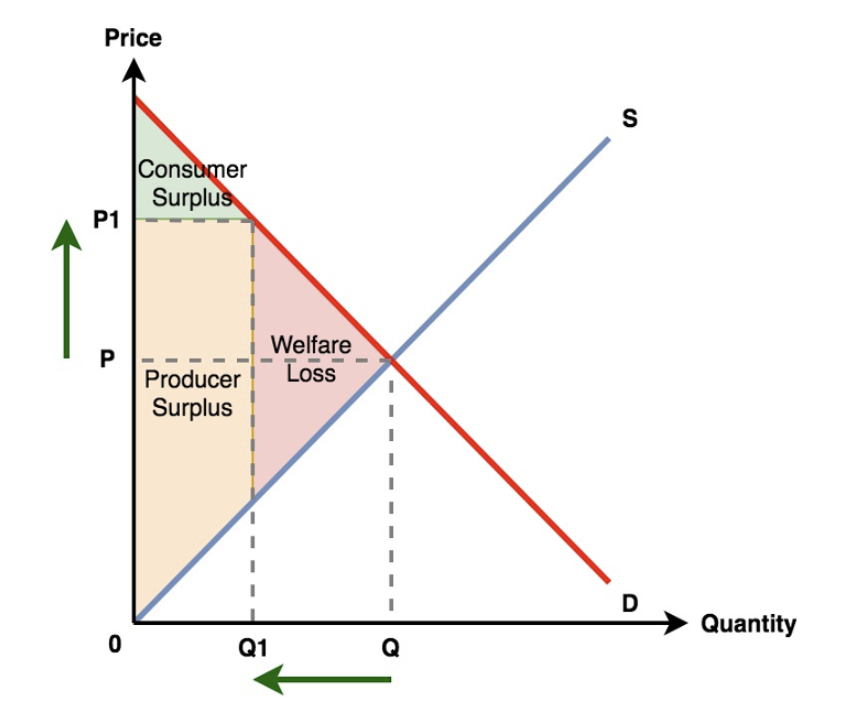
Welfare Loss
Occurs due to allocation of resources not at equilibrium
Extra Diagram - Welfare Loss
Draw it (Welfare Loss)
Calculate Surpluses from Diagram
Use triangles and trapeziums