variation and measure of dispersion
1/10
Earn XP
Description and Tags
will never be asked to calculate SD!
Name | Mastery | Learn | Test | Matching | Spaced | Call with Kai |
|---|
No study sessions yet.
11 Terms
what are the 2 types of variation?
continuous variation
discrete variation
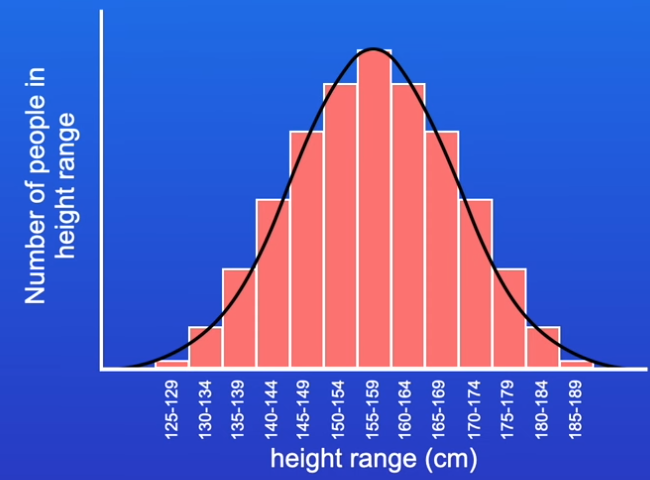
what is continuous variation and how can it be displayed? give an example:
features showing continuous variation can have any value w/in a range
most of the time, most individuals are close to the mean and few are found at either extremes - normal distribution
traits often regulated by multiple genes and influenced by environment
plotted on histogram overlaid w/ a curve
e.g. height
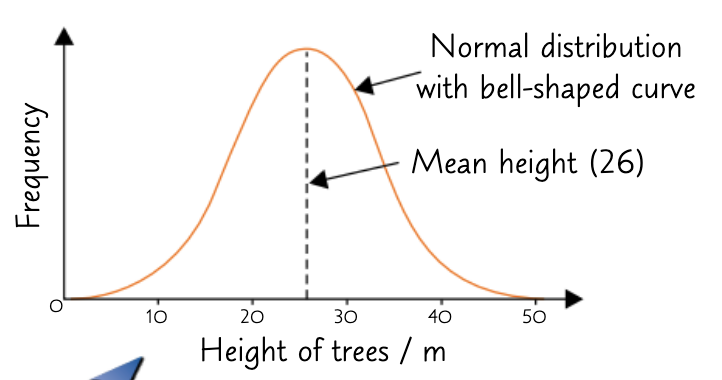
what is a normal distribution?
data points are grouped symmetrically around central mean, resembling a bell shaped curve
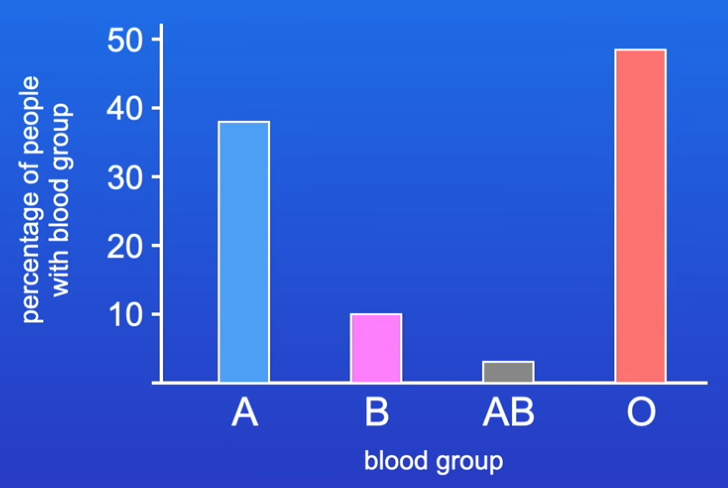
what is discrete/discontinuous variation and how can it be displayed? give an example:
features showing discrete variations have distinct categories w/o intermediate values
traits often regulated by a single gene and not influenced by environment
plotted on bar charts
e.g. blood group
what is standard deviation?
the spread of data around the mean
when is a difference significant/not significant?
SDs don’t overlap = significant
SDs overlap = not significant
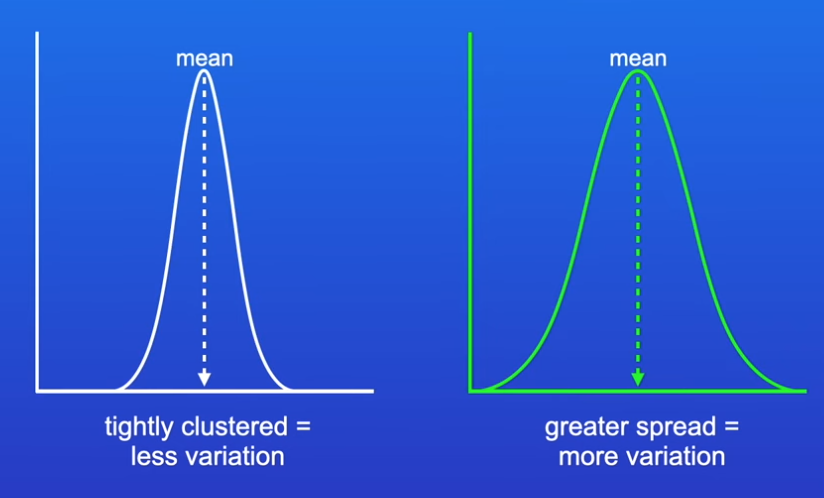
what does a smaller/larger SD mean in terms of variation?
smaller SD = less variation
larger SD = more variation
what does a smaller/larger SD mean in terms of reliability?
smaller = greater reliability (as data has a narrower range and points are more closely grouped around mean)
larger = lower reliability (as data has a wider range and points are less closely grouped around mean)
evaluate the use of the range as a measure of dispersion:
strength: easier to calculate (than SD)
limitation: distorted by extreme values
evaluate the use of SD as a measure of dispersion:
strength: not distorted by extreme values
limitation: more difficult to calculate (than range)
how can we evaluate SD data?
find +ves in data
find +ves in method/procedure
find -ves in data
find -ves in method/procedure