Chapter 4: The Market Forces of Supply and Demand
1/66
There's no tags or description
Looks like no tags are added yet.
Name | Mastery | Learn | Test | Matching | Spaced |
|---|
No study sessions yet.
67 Terms
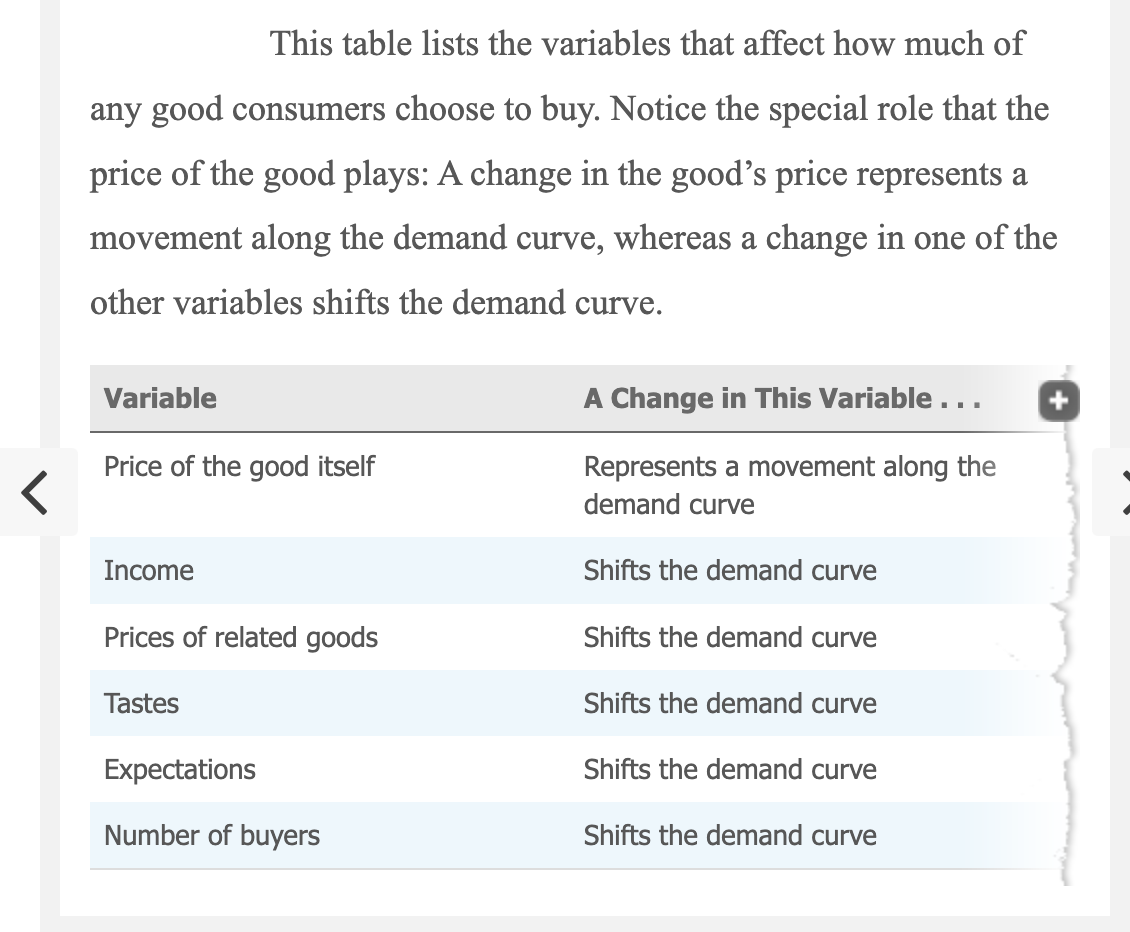
What are the forces that make market economies work?
Supply and Demand
What does supply and demand determine?
The quantity of each good produced and the price at which it is sold
Supply and demand
The behavior of people as they interact with one another in competitive markets
Market
A group of buyers and sellers of a particular good or service
What do buyers as a group determine?
The demand for the product
What do sellers as a group determine?
The supply of the product
Highly organized markets
Buyers and sellers meet at a specific time and place where and auctioneer helps set prices and arrange sales (markets for agricultural commodities)
Less organized market
Market for ice cream in a particular town
What determines price and quantity supplied?
All buyers and sellers as they interact in the marketplace
Competitive marketplace
A market in which there are so many buyers and so many sellers that each has a negligible impact on the market price.
-A seller has little reason to charge less than the going price, and if he charges more, buyers will make their purchases elsewhere. Similarly, no single buyer of ice cream can influence the price of ice cream because each buyer purchases only a small amount.
What are the two factors for a perfectly competitive marketplace?
1. The goods offered for sale are all exactly the same
2. The buyers and sellers are so numerous that no single buyer or seller has any influence over the market place
Price takers
buyers and sellers in perfectly competitive markets must accept the price the market determines
At the market price what can buyers and sellers do?
buyers can buy all they want, and sellers can sell all they want
Monopoly
When a market only has one seller, and this seller sets the price
Demand curve
The line relating price and quantity demanded
Quantity demanded
the amount of the good that buyers are willing and able to purchase
If the price of ice cream rose to 20 per scoop, you would buy less ice cream. You might buy frozen yogurt instead. If the price of ice cream fell to per scoop, you would buy more.
Law of demand
Other things being equal, when the price of a good rises, the quantity demanded of the good falls, and when the price falls, the quantity demanded rises
Demand schedule
The table that shows the relationship between the price of a good and the quantity demanded, holding constant everything else that influences how much of the good consumers want to buy
Why does the demand curve slope down?
other things being equal, a lower price means a greater quantity demanded
-Because a lower price increases the quantity demanded, the demand curve slopes downward.
demand curve.
By convention, the price of ice cream is on the vertical axis, and the quantity of ice cream demanded is on the horizontal axis. The line relating price and quantity demanded is called the demand curve. The demand curve slopes downward because, other things being equal, a lower price means a greater quantity demanded.
Market demand
the sum of all individual demands for a particular good or service
How do you find the total quantity demanded at any price?
We add the individual quantities, which are found on the horizontal axis of the individual demand curves
-Notice that we sum the individual demand curves horizontally to obtain the market demand curve. That is, to find the total quantity demanded at any price, we add the individual quantities demanded, which are found on the horizontal axis of the individual demand curves
What does the market demand curve show?
shows how the total quantity demanded of a good varies as the price of the good varies, while all the other factors that affect how much consumers want to buy are held constant
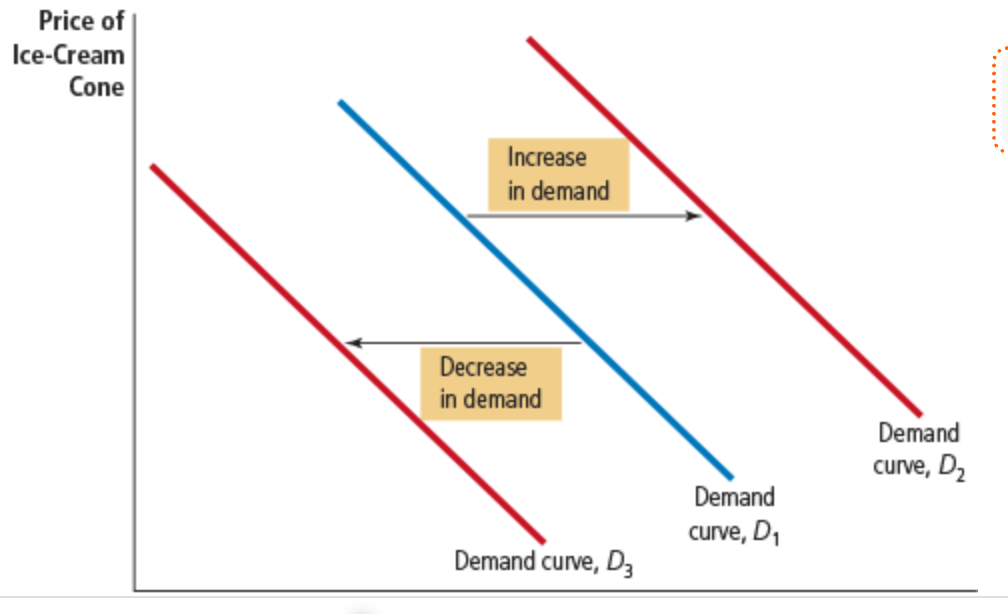
Increase in demand
any change that increases the quantity demanded at every price shifts the demand curve to the right
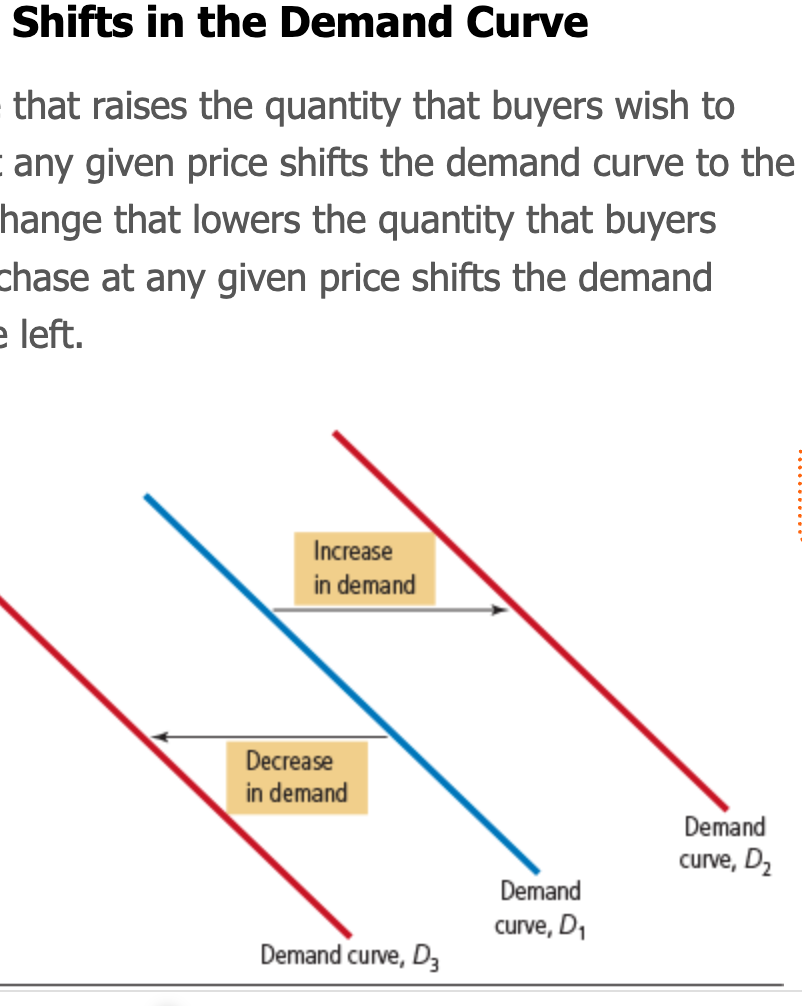
decrease in demand
any change that reduces the quantity demanded at every price shifts the demand curve to the left
normal good
if the demand for a good falls when income falls
-A lower income means that you have less to spend in total, so you would have to spend less on some—and probably most—goods.
inferior good
if the demand for a good rises when income falls
-An example of an inferior good might be bus rides. As your income falls, you are less likely to buy a car or take a cab and more likely to ride a bus
substitues
when a fall in the price of one good reduces the demand for another good the two goods are called substitues.
-Substitutes are often pairs of goods that are used in place of each other, such as hot dogs and hamburgers, sweaters and sweatshirts, and movie tickets and film streaming services.
complements
when a fall in the price of one good raises the demand for another good
-Complements are often pairs of goods that are used together, such as gasoline and automobiles, computers and software, and peanut butter and jelly.
taste influences demand curve
Perhaps the most obvious determinant of your demand for any good or service is your tastes. If you like ice cream, you buy more of it. Economists normally do not try to explain people’s tastes because tastes are based on historical and psychological forces that are beyond the realm of economics. Economists do, however, examine what happens when tastes change.
expectations influence demand curve
Your expectations about the future may affect your demand for a good or service today. If you expect to earn a higher income next month, you may choose to save less now and spend more of your current income on ice cream. If you expect the price of ice cream to fall tomorrow, you may be less willing to buy an ice-cream cone at today’s price.
number of buyers influence demand curve
In addition to the preceding factors, which influence the behavior of individual buyers, market demand depends on the number of these buyers. If Peter were to join Catherine and Nicholas as another consumer of ice cream, the quantity demanded in the market would be higher at every price, and market demand would increase.
Variables That Influence Buyers
The supply curve
the relationship between price and quantity supplied
quantity supplied
the amount that sellers are willing and able to sell
law of supply
other things being equal, when the price of a good rises, the quantity supplied of the good also rises, and when the price falls, the quantity supplied falls as well
supply schedule
a table that shows the relationship between the price of a good and the quantity supplied holding constant everything else that influences how much producers of the good want to sell
supply curve
the curve relating price and quantity supplied
market demand
the sum of the demands of all buyers
market supply
the sum of the supplies of all sellers
what does the market supply curve show?
shows the supply curves that correspond to the supply schedules. As with demand curves, we sum the individual supply curves horizontally to obtain the market supply curve. That is, to find the total quantity supplied at any price, we add the individual quantities, which are found on the horizontal axis of the individual supply curves. The market supply curve shows how the total quantity supplied varies as the price of the good varies, holding constant all other factors that influence producers’ decisions about how much to sell.
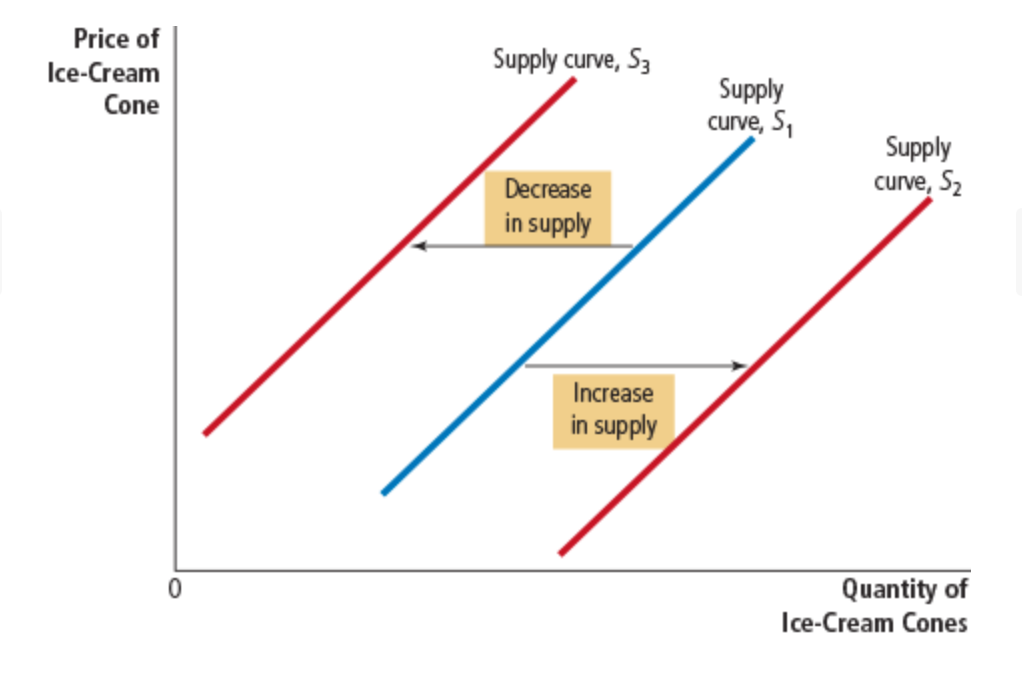
increase in supply
any change that raises quantity supplied at every price, such as a fall in the price of sugar, shifts the supply curve to the right
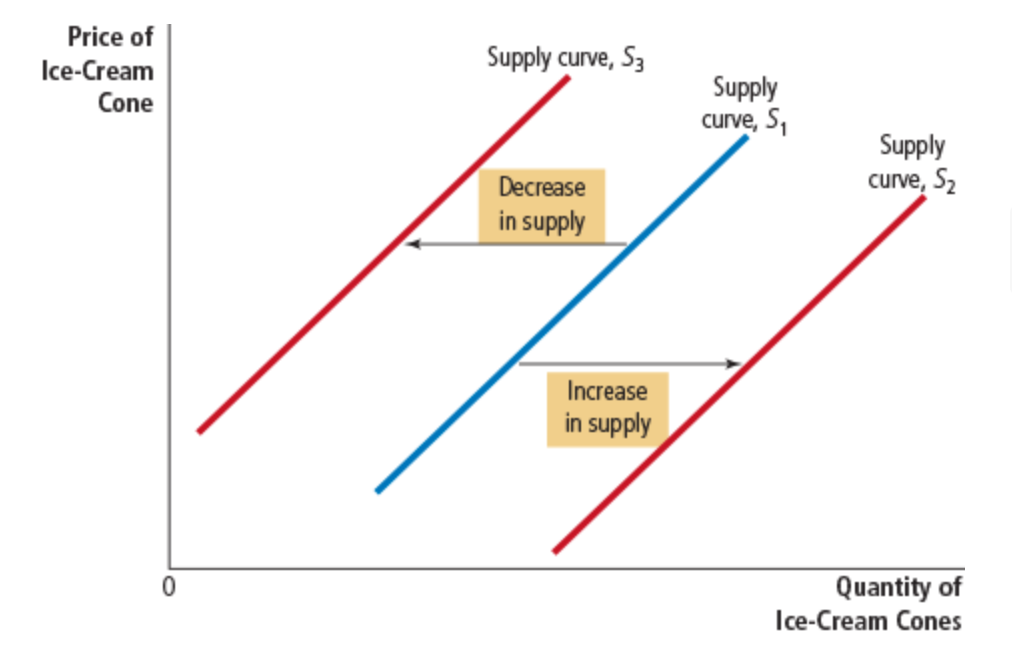
decrease in supply
any change that reduces the quantity supplied at every price
input affects supply curve
To produce their output of ice cream, sellers use various inputs: cream, sugar, flavoring, ice-cream machines, the buildings in which the ice cream is made, and the labor of workers who mix the ingredients and operate the machines. When the price of one or more of these inputs rises, producing ice cream becomes less profitable, and firms supply less ice cream. If input prices rise substantially, a firm might shut down and supply no ice cream at all. Thus, the supply of a good is negatively related to the prices of the inputs used to make the good.
technology affects supply curve
The technology for turning inputs into ice cream is another determinant of supply. The invention of the mechanized ice-cream machine, for example, reduced the amount of labor necessary to make ice cream. By reducing firms’ costs, the advance in technology raised the supply of ice cream.
expectations affect supply curve
The amount of ice cream a firm supplies today may depend on its expectations about the future. For example, if a firm expects the price of ice cream to rise in the future, it will put some of its current production into storage and supply less to the market today.
number of sellers affect supply curve
In addition to the preceding factors, which influence the behavior of individual sellers, market supply depends on the number of these sellers. If Ben or Jerry were to retire from the ice-cream business, the supply in the market would fall.
The supply of a good is ____ related to the price of the inputs used to make the good
negatively
When does a supply curve shift?
Only when there is a change in a relevant variable that is not named on either axis
What does movement along the supply curve represent?
A change in price
equilibrium
one point at which the supply and demand curves intersect
equilibrium price
the price at this intersection
The price at this intersection is called the equilibrium price, and the quantity is called the
the equilibrium quantity.
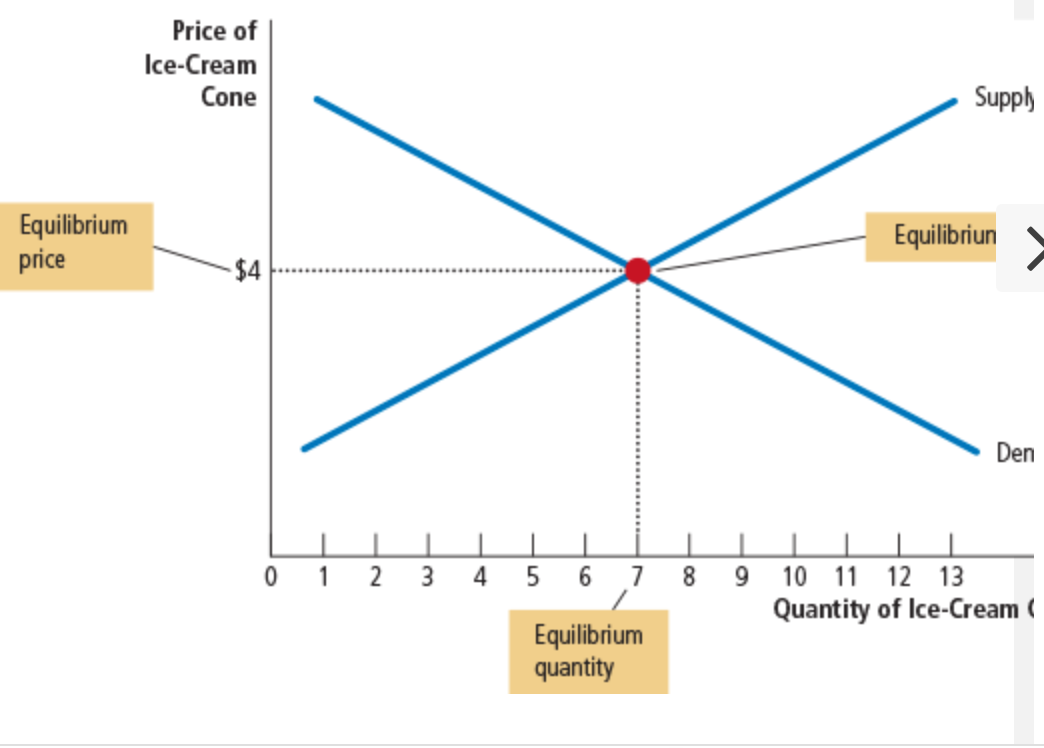
What is the equilibrium price sometimes called?
the market clearing price
At the equilibrium price, the quantity of the good that buyers are willing and able to buy
exactly balances the quantity that sellers are willing and able to sell. The equilibrium price is sometimes called the market-clearing price because, at this price, everyone in the market has been satisfied: Buyers have bought all they want to buy, and sellers have sold all they want to sell.
surplus
a situation in which quantity supplied is greater than quantity demanded
Producers are unable to sell all they want at the going price. A surplus is sometimes called a situation of excess supply. When there is a surplus in the ice-cream market, sellers of ice cream find their freezers increasingly full of ice cream they would like to sell but cannot. They respond to the surplus by cutting their prices
shortage
a situation in which quantity demanded is greater than quantity supplied
Consumers are unable to buy all they want at the going price. A shortage is sometimes called a situation of excess demand. When a shortage occurs in the ice-cream market, buyers have to wait in long lines for a chance to buy one of the few cones available. With too many buyers chasing too few goods, sellers can respond to the shortage by raising their prices without losing sales. These price increases cause the quantity demanded to fall and the quantity supplied to rise. Once again, these changes represent movements along the supply and demand curves, and they move the market toward the equilibrium.
supply
the position of the supply curve
quantity supplied
the amount suppliers wish to sell
law of supply and demand:
The price of any good adjusts to bring the quantity supplied and quantity demanded of that good into balance.
What is a movement alone a fixed supply curve called?
a change in the the quantity supplied
Three Steps to Analyzing Changes in Equilibrium
First, we decide whether the event shifts the supply curve, the demand curve, or, in some cases, both. Second, we decide whether the curve shifts to the right or to the left. Third, we use the supply-and-demand diagram to compare the initial equilibrium with the new one, which shows how the shift affects the equilibrium price and quantity.
Beef is a normal good. You observe that both the equilibrium price and quantity of beef have fallen over time. Which of the following explanations would be most consistent with this observation?
a. The price of chicken has risen, and the price of steak sauce has fallen. | |
b. New medical evidence has been released that indicates a negative correlation between a person's beef consumption and life expectancy. | |
c. Consumers have experienced an increase in income, and beef-production technology has improved. | |
d. The demand curve for beef must be positively sloped. |
New medical evidence has been released that indicates a negative correlation between a person's beef consumption and life expectancy.
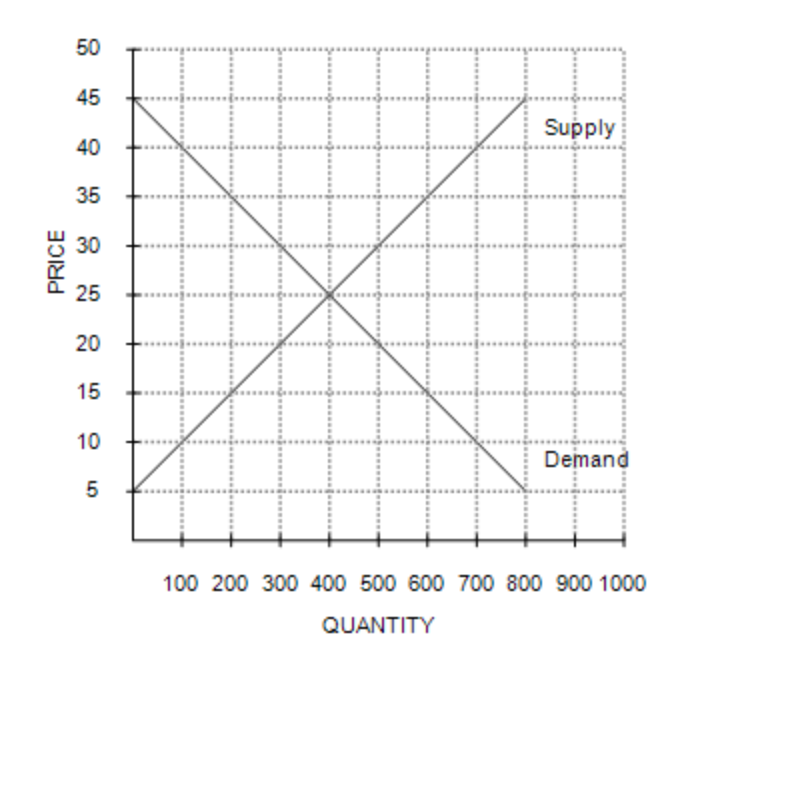
Equilibrium price and quantity are, respectively,
| |||||||||
$25 and 400 units.
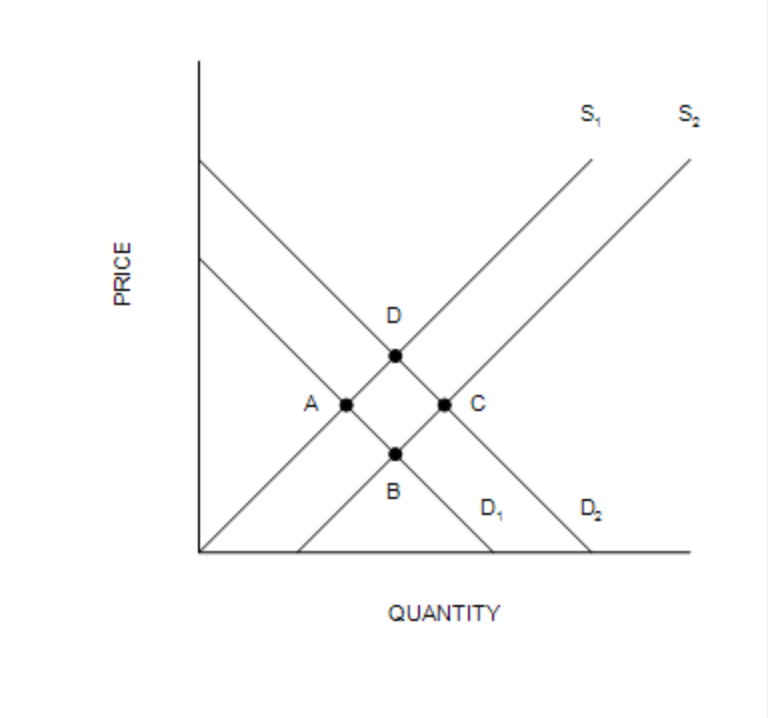
Which of the following movements would illustrate the effect in the market for swimming lessons of an increase in the incomes of parents with school-aged children?
a. Point C to Point D | |
b. Point A to Point D | |
c. Point C to Point B | |
d. Point A to Point B |
Point A to Point D
If the number of sellers in a market increases, then the
a. demand in that market will increase. | |
b. demand in that market will decrease. | |
c. supply in that market will increase. | |
d. supply in that market will decrease. |
supply in that market will increase.
What would happen to the equilibrium price and quantity of lattés if coffee shops began using a machine that reduced the amount of labor necessary to produce them?
a. Both the equilibrium price and quantity would decrease. | |
b. Both the equilibrium price and quantity would increase. | |
c. The equilibrium price would increase, and the equilibrium quantity would decrease. | |
d. The equilibrium price would decrease, and the equilibrium quantity would increase. |
The equilibrium price would decrease, and the equilibrium quantity would increase.