
Looks like no one added any tags here yet for you.
Subsidy
Quota
Tariff
Y axis:
X axis:
Price
Quantity
Subsidy
S line(s) (curved):
S line(s) (flat):
D lines:
2
1
1
Tariff
S line(s) (curved):
S line(s) (flat):
D lines:
1
2
1
Quota
S line(s) (curved):
S line(s) (flat):
D lines:
2
1
1
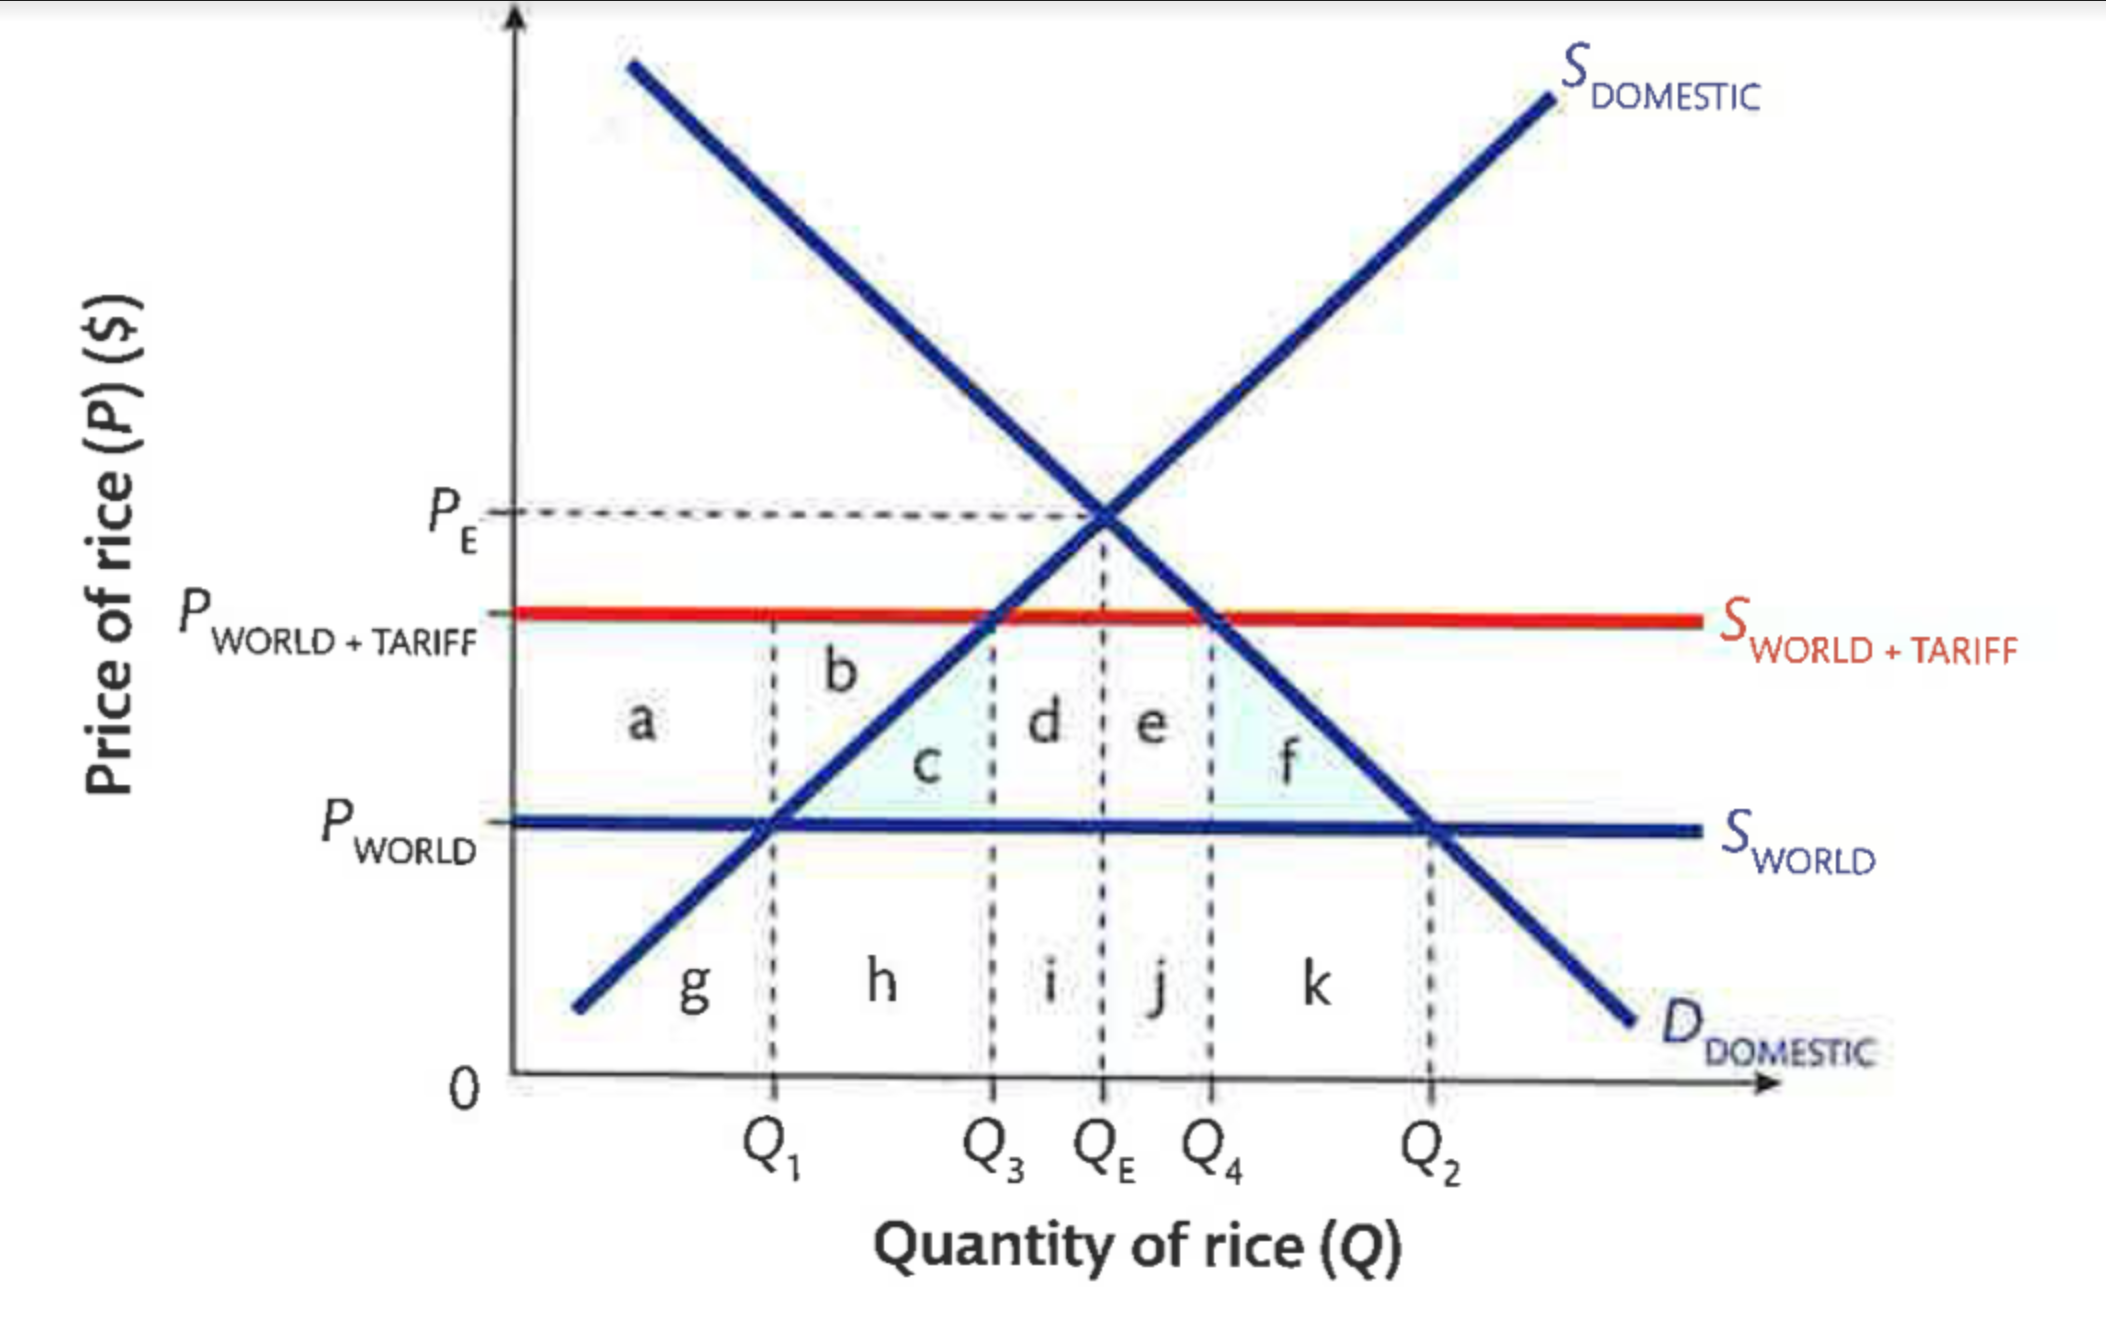
Tariff Effects on Stakeholders
On consumers: Consumer surplus (the blue triangle) is now a smaller area, since the price is higher and quantity lower.
On domestic producers: Producer surplus (the red triangle) is now greater, since domestic producers sell more cars at a higher price
On foreign producers: Foreign producers are worse off. They sell fewer cars and earn less revenue ([Q2-Q4]*Pw) than they did before the tariff
On the government: The government levying the tariff earns revenue equal to the green rectangle.
On total welfare: There is a net loss of total welfare equal to the two black triangles. Society as a whole is worse off because fewer cars are consumed but more are produced by the relatively inefficient domestic producers.
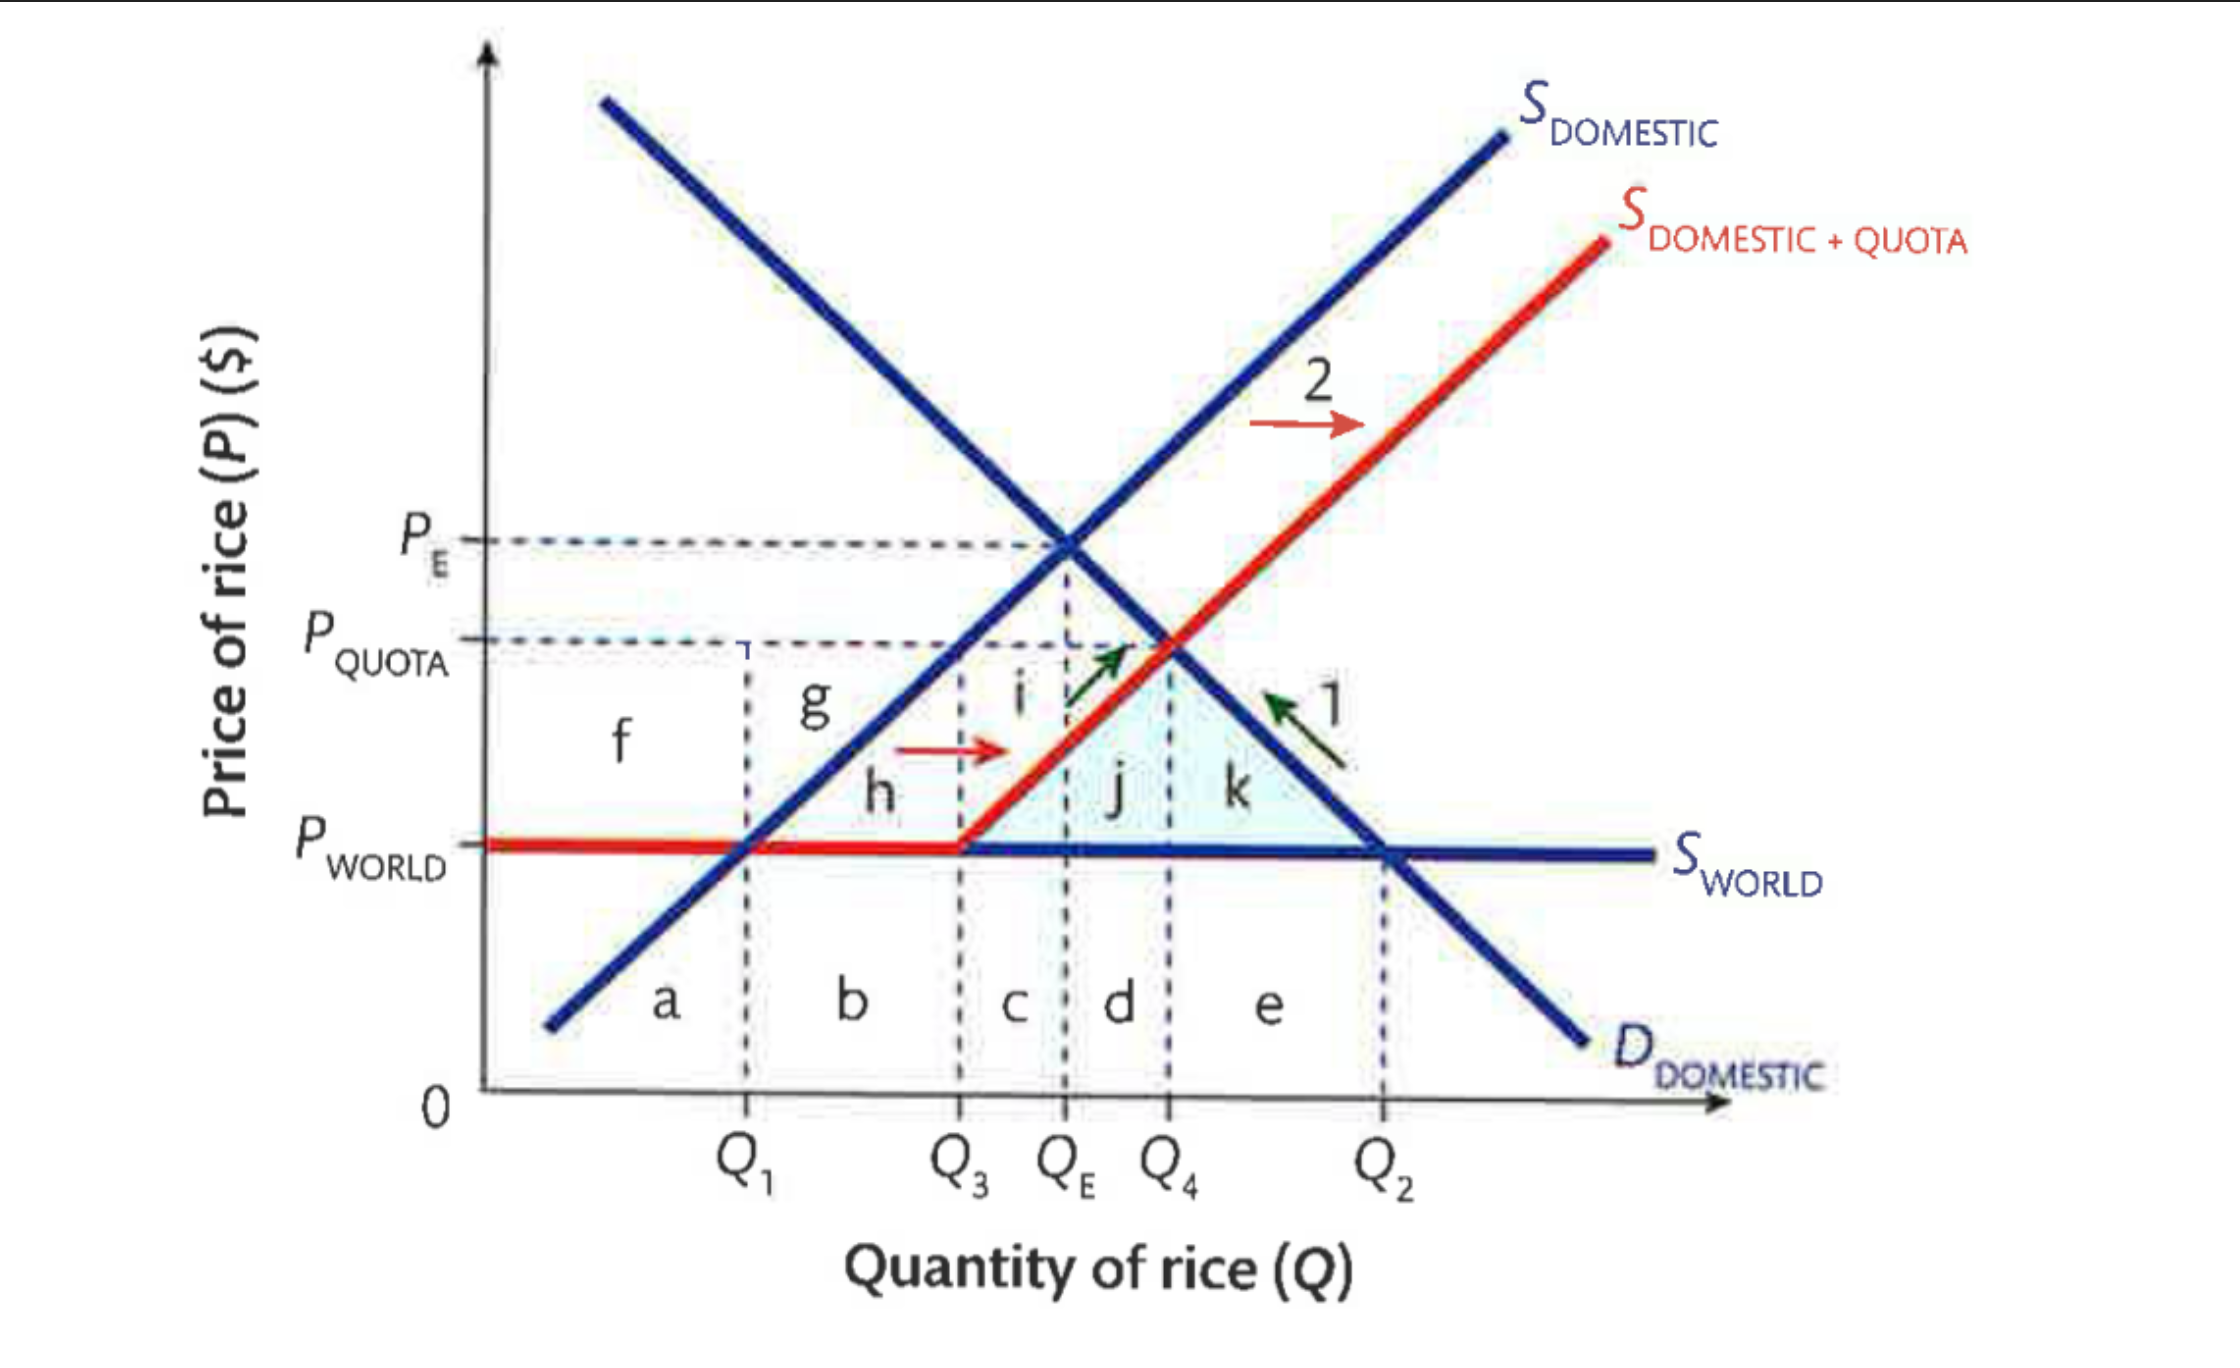
Quota Effects on Stakeholders
On consumers: The quantity of cars falls and the price rises, so consumer surplus is reduced to the blue triangle
On domestic producers: Output and price have increases, so producer surplus increases to the two red areas (above the domestic supply curve and below the price)
On foreign producers: There will be fewer imports (only Q1-Q2) but they will sell for higher prices, so there is now some foreign producer surplus (the green area) but overall revenues fall for foreign producers.
On the government: Unlike a tariff, no revenues are collected from a quota.
On total welfare: Total welfare decreases due to fewer cars being sold and more being produced by relatively inefficient domestic producers. The black triangle is the area of welfare loss
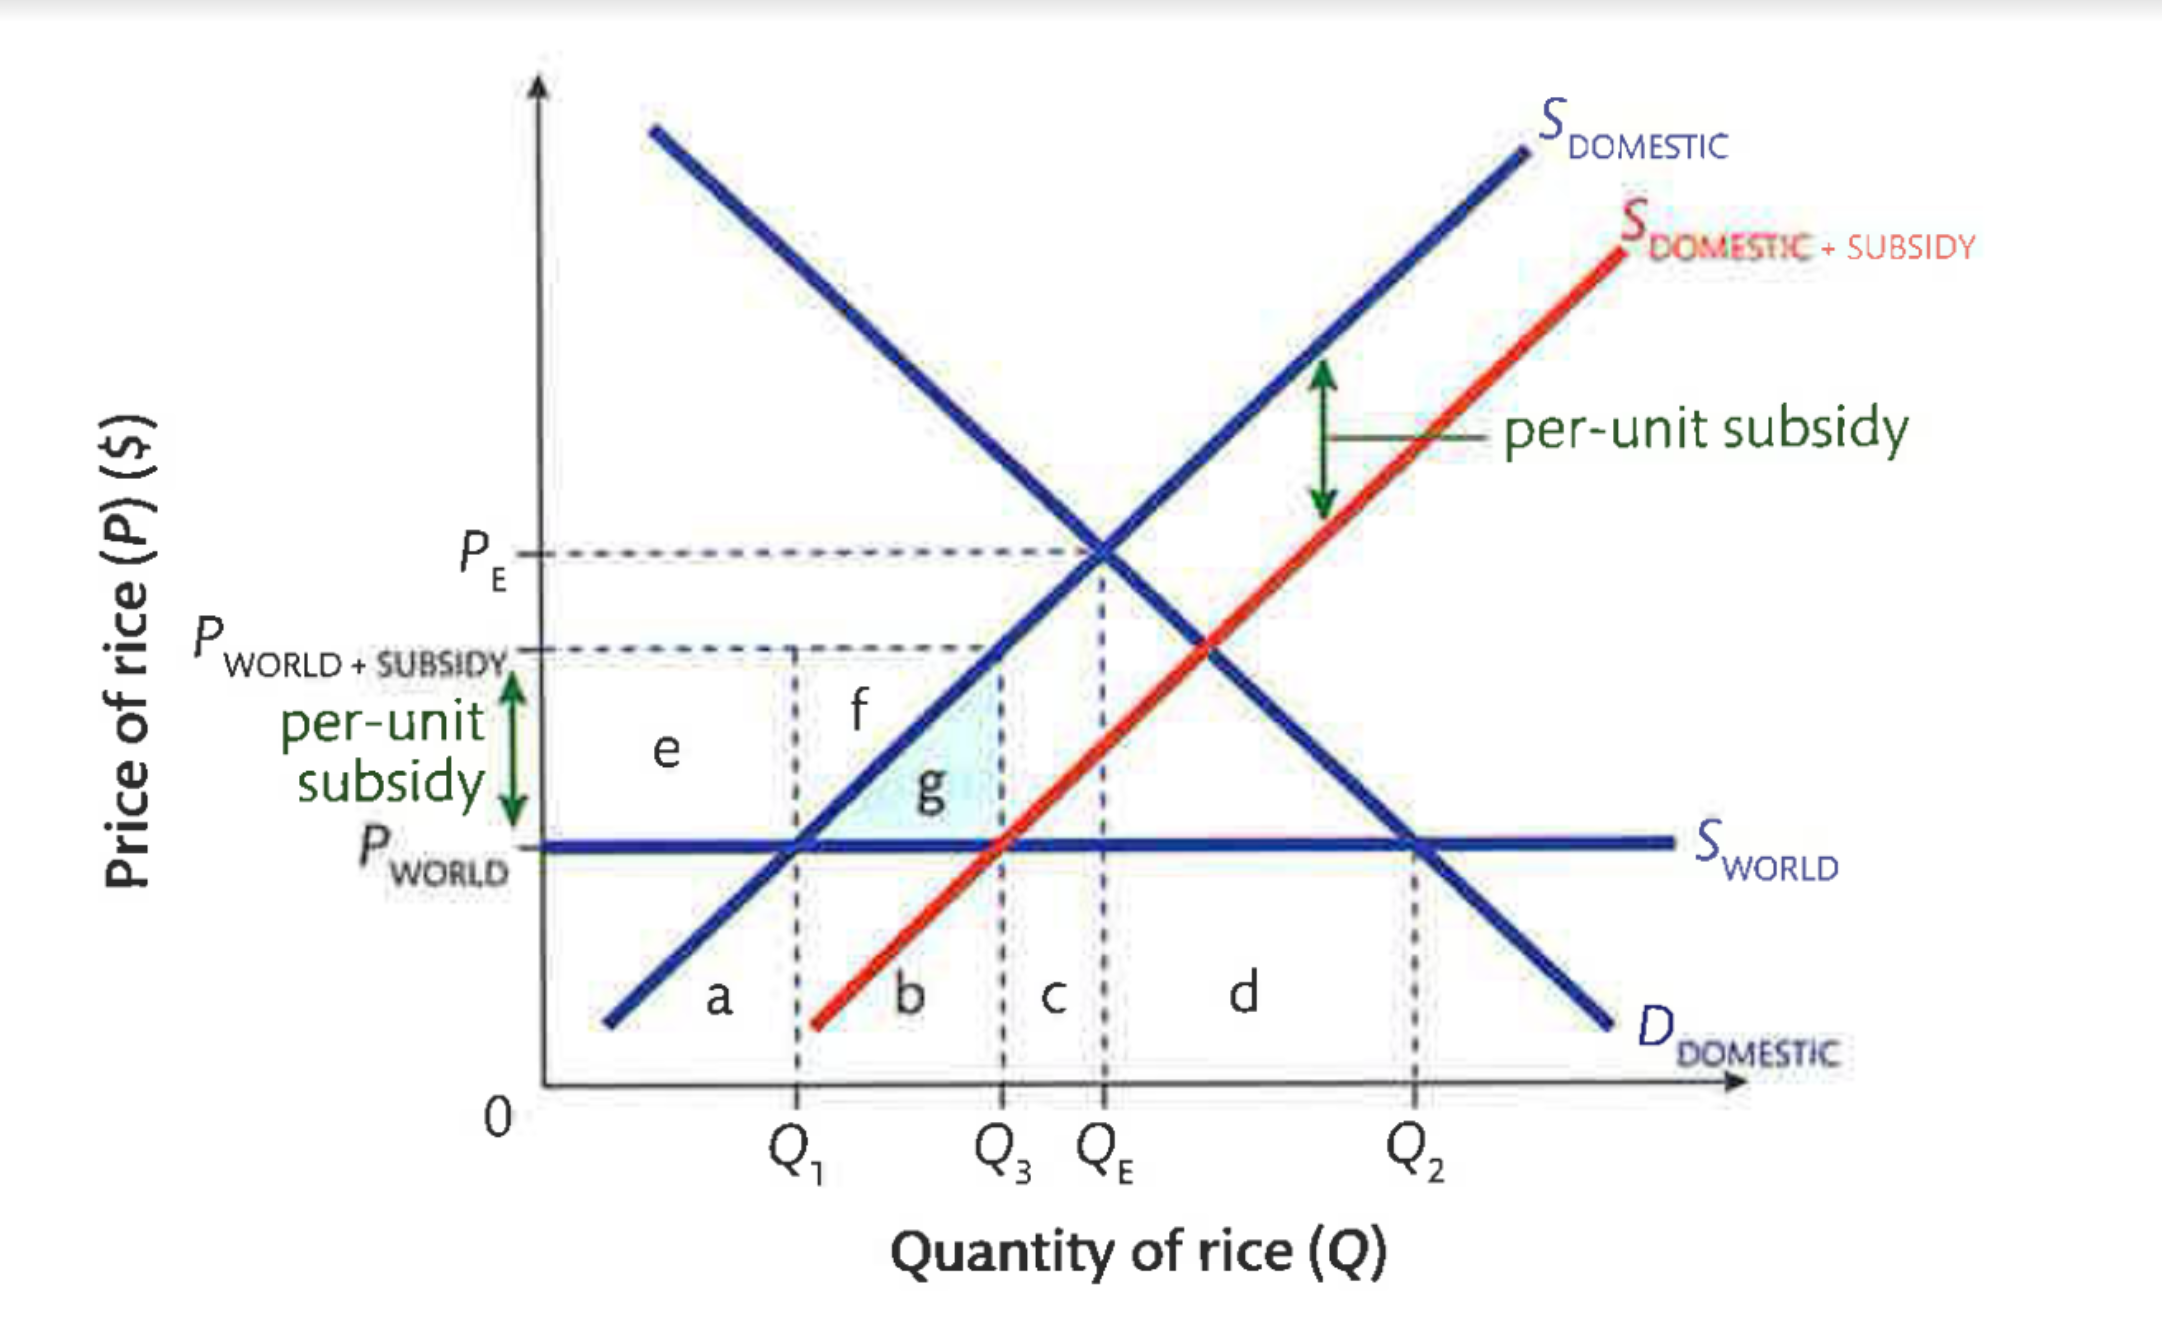
Subsidy Effects on Stakeholders
On car consumers: No effect. The price is still Pw, they still buy Q3 cars, and consumer surplus equals the blue, green and black areas.
On domestic producers: They receive a higher price (Pw+sub) and produce a greater quantity (Q2) so producer surplus increases to the red and green areas
On foreign producers: They are clearly worse off; since fewer cars are imported, their revenues fall.
On taxpayers and the government: The cost of the
subsidy to taxpayers (the amount of the subsidy multiplied by the quantity of cars produced) is the green and black areas
On total welfare: The total cost of the subsidy (green+black) is greater than the total increase in producer surplus (green). The black area is the loss of total welfare created by the subsidy.