IB Biology HL - Option C - Ecology
0.0(0)
0.0(0)
Card Sorting
1/68
There's no tags or description
Looks like no tags are added yet.
Study Analytics
Name | Mastery | Learn | Test | Matching | Spaced |
|---|
No study sessions yet.
69 Terms
1
New cards
ecological niche
role of the species e.g
\
spatial habitat - where the species lives
interactions - how the species afects and is affected by otherspecies in the community, including nutrition
\
\
spatial habitat - where the species lives
interactions - how the species afects and is affected by otherspecies in the community, including nutrition
\
2
New cards
competitive exclusion principle
\
\
only one species can occupy a niche in an ecoysystem
\
\
3
New cards
fundamental niche
\
\
Niche that a species could potentially occupy
\
\
4
New cards
realized niche
the niche that a species actually occupies
5
New cards
competition
a species using a resource reduces the abailible amount to other species using it. It is the reason for differences between fundamental and realized niche
6
New cards
keystone species
essential for ecosystem and has a significant effect on the structure of an ecological community.
\
e.g Tree is direct food source for most species in the forest community
e.g Predator has major effect on population sizes by limiting the number of their pray
\
e.g Tree is direct food source for most species in the forest community
e.g Predator has major effect on population sizes by limiting the number of their pray
7
New cards
transect
method of sampling - to investigate whether the distribution of a species is correlated with an **abiotic variable**
8
New cards
Herbivory (interaction)
primary consumers feed on plants or other producers; this harms producers but reduces competition between producers.
9
New cards
predation (interaction)
predators benefit as they feed on prey.
10
New cards
Parasitism (interaction)
a parasite that lives on/in a host, obtaining food from the host and harming it.
11
New cards
Mutualism
Different species live in a close relationship where they both benefit.
12
New cards
Mutualism Example (Reef Building Corals)
Coral and Algae (zooxanthellae) shared mutualistic relation (Also Symbiotic).
\
1) Coral provide algae with a protected environment close to light for photosynthesis
2)Zooxanthellae provide coral with products of photosynthesis: glucose, amino acids, oxygen
3)Coral Waste Products (ammonia, carbon dioxide, phosphate) used by zooaxanthellae
\
1) Coral provide algae with a protected environment close to light for photosynthesis
2)Zooxanthellae provide coral with products of photosynthesis: glucose, amino acids, oxygen
3)Coral Waste Products (ammonia, carbon dioxide, phosphate) used by zooaxanthellae
13
New cards
Symbiotic
Both different species live together
14
New cards
Gross production
Total amount of energy in food - eaten by animal/made by photosynthesis (in producers)
15
New cards
Net Production
is the amount of energy converted to biomass in an organism. It is always less than gross production because some food is used in cell respiration and the energy released from it is lost from the organism and the ecosystem
16
New cards
Feed Conversion ratio
Conversion Ratio = intake of food (g) ÷ net production of biomass (g)
\
(Note: Higher the ratio, the lower percentage of ingested energy that is converted to biomass (g))
\
(Note: Higher the ratio, the lower percentage of ingested energy that is converted to biomass (g))
17
New cards
Why do birds and mammals have a high respiration rate?
to maintain constant body temperatures
18
New cards
Food Chain
A single sequence of organisms, each of which consume the previous one in a chain
19
New cards
Food Web
A diagram used to show all possible food chains in a community
20
New cards
Nutrients
Retained in ecosystem for an unlimited time.
21
New cards
Closed ecosystem
An ecosystem that does not exchange nutrients with its surroundings.
22
New cards
terrestrial ecosystems
three main storage compartments: biomass (living organisms), litter (dead organic matter) and the soil
23
New cards
open ecosystem
nutrients also flow to or from the compartments and the surroundings
24
New cards
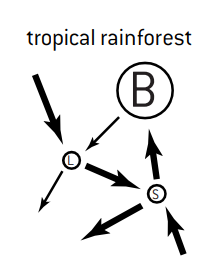
A Gersmehl diagram
a model of nutrient storage and flow for terrestrial ecosystems. The amount of nutrients in each compartment is indicated by the size of the circle and the flow rates are indicated by the size of the arrows. B is biomass, L is litter, S is soil.

25
New cards
Climax Community
Ecological succession usually stops when a stable ecosystem develops with a group of organisms called the climax community
26
New cards
Ecological succession
series of changes to an ecosystem, caused by complex interactions between the community of living organisms and the abiotic environment. Primary succession starts in an area where living organisms have not previously existed, for example a new island, created by volcanic activity
27
New cards
Characteristics Of Ecosystem Increased during primary succession
species diversity +
\
plant density +
\
organic matter +
\
soil depth +
\
water holding capacity +
\
soil erosion -
\
nutrient cycling +
\
plant density +
\
organic matter +
\
soil depth +
\
water holding capacity +
\
soil erosion -
\
nutrient cycling +
28
New cards
environmental disturbance
Communities sometimes change from those predicted by climographs to other communities as a result of environmental disturbance.
\
e.g flood, fire, storm
\
e.g flood, fire, storm
29
New cards
Endemic Species
Species that naturally occurs in the area
30
New cards
Alien Species
organism that humans have introduced to an area where it doesn’t naturally occur
31
New cards
Starlings
Example Of Alien species that compete with endemic species for nest spots and food.
32
New cards
Cane Toad
Example Of Alien species that releases toxins threatening local endemic population. Reproduce quickly, (produce 30000 eggs).
\
\
33
New cards
biomagnification
pollutants absorbed into living organisms - accumulates in high concentration as it cannot be excreted
\
Increases across trophic levels due to biomagnification.
\
Increases across trophic levels due to biomagnification.
34
New cards
Biological Control
use of predator, parasite or pathogen to reduce/eliminate pest.
35
New cards
Plastic Pollution In Oceans
Plastics are dumbed at sea and are resistant to decomposition. Macroplastics (large plastics) and microplastics (small plastics) degrade into debris and accumulate in marine environments called gyres.
36
New cards
Richness
The number of different species present (a type of biogeographic factor
37
New cards
Evenness
how close in numbers, the different species are. (a type of biogeographic factor)
\
\
38
New cards
Biogeographic factors
the number of species that live in an area is greatly affected by
39
New cards
edge effect
certain species avoids living close to edge of forest, thus those species are absent from forest which are fragmented.
40
New cards
In situ conservation
conserving a species in its own habitat. i.e natural reserves/national parks)
41
New cards
Ex Situ
threatened population transfered to captivity in zoo’s or wild refuges due to loss or destruction of natural habitat.
42
New cards
Indicator Species
Used to measure tolerance of specific environmental condictions
43
New cards
Lichen
(example of indicator species)
\
Used to assess tolerance of concentration of sulfur dioxide pollutant in desired area.
\
\
Used to assess tolerance of concentration of sulfur dioxide pollutant in desired area.
\
44
New cards
Biotic Index
\[(No. Of Indicator Species)(Pollution Tolerance Rating)\] ÷ (total number of organisms)
\
(Note: The higher the biotic index, the less polluted)
\
(Note: The higher the biotic index, the less polluted)
45
New cards
Capture-Mark-Release-Recapture (CMRR)
1)Capture as many individuals as possible in the area of a population and discretely mark them
2)Release the marked individuals to settle back into habitat.
3)Recapture all individuals an count how many are marked and unmarked.
2)Release the marked individuals to settle back into habitat.
3)Recapture all individuals an count how many are marked and unmarked.
46
New cards
Lincoln Index (estimated population size)
\[(Initial Caught And Marked)(Total Caught In Second Capture)\] ÷(number of marked recaptured)
47
New cards
Substainable fishing practices
The maximum sustainable yield is the largestamount that can be harvested without a decline in stocks. It is essential to know the age profle, reproductive status and size ofthe population. If the population drops too low for efective breeding, there must be a ban on fishing. Suficient larger fish that are mature enough to reproduce must be left for the population to replenish itself as least as fast as fish are caught.
48
New cards
Natality (Population Growth Factor)
Offspring produced and added to the population
49
New cards
Mortality (Population Growth Factor)
Individuals die and are lost from the population
50
New cards
immigration (Population Growth Factor)
individuals move into the area from elsewhere
51
New cards
emigration
individuals move from the area to live elsewhere
52
New cards
Formula For Population Change
(Natality + Immigration) - (Mortality + Emigration)
53
New cards
Sigmoid Graph
An S shaped population growth curve.
54
New cards
1. Exponential Phase
In an ideal environment, the population follows exponential growth.
\
Natality Rate > Mortality Rate
Immigration > Emigration
\
Natality Rate > Mortality Rate
Immigration > Emigration
55
New cards
2. Transitional Phase
Population growth slows as the carrying capacity of the environment is reached
\
Natality Rate Decreases
Immigration Decreases
\
Natality Rate Decreases
Immigration Decreases
56
New cards
3. Plateau Phase
Population Limited By Food, Predators, Disease and Parasites
\
Natality Rate = Mortality Rate
Immigration < Emigration
\
\
Natality Rate = Mortality Rate
Immigration < Emigration
\
57
New cards
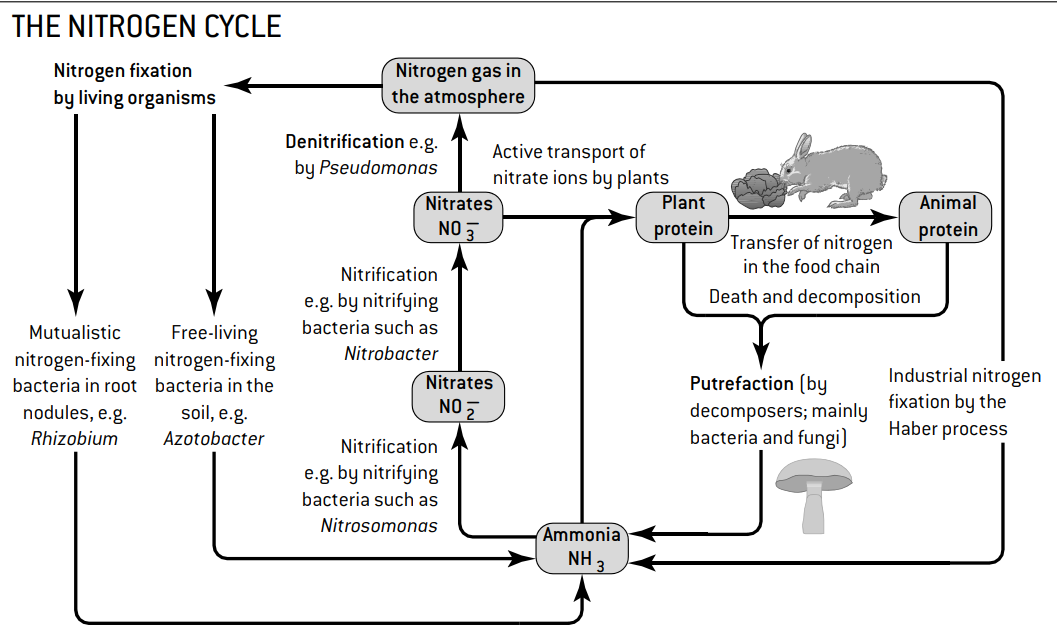
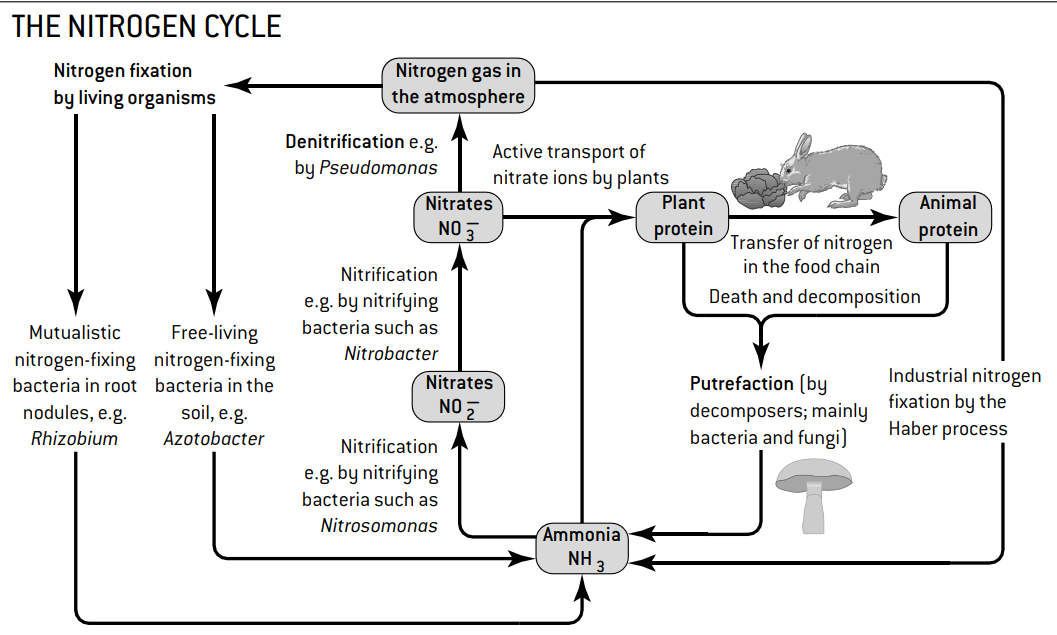
Nitrogen Fixation
Conversion of N2 in atmosphere to Ammonia (NH3) using ATP
\
\
\
\
58
New cards
Nitrification
Converts ammonia to nitrate
\
\
59
New cards
Denitrification
Conversion of nitrate back to nitrogen bu denitrifying bacteria. (Only occurs In soil In absence of oxygen)
60
New cards
Waterlogged Soils
Oxygen In Waterlogged soils is used up quickly, preventing production of nitrate, resulting in nitrate deficiency.
61
New cards
Eutrophic
Nutrient concentrations that are dangerously high.
62
New cards
Algal Bloom
Eutrophication causes algae to multiply excessively, resulting in an algal bloom.
\
\-lower algae deprived of light and die.
\-bacteria decompose dead algae leading to increased biological oxygen demand
\
\-lower algae deprived of light and die.
\-bacteria decompose dead algae leading to increased biological oxygen demand
63
New cards
biological oxygen demand
\
\
Higher the biological oxygen demand in water, the more polluted and the more organisms die.
64
New cards
limiting factors
prevents eutrophication
65
New cards
bottom up control (limiting factor)
(shortage of nutrients)
66
New cards
Top-down control (limiting factor)
(control by means of predators or parasites)
67
New cards
parrotfish
example of top-down limiting factor that controls algae population as a predator that eats algae via herbivory.
68
New cards

The Nitrogen Cycle (See diagram)
\
1. Nitrogen fixation: Conversion of atmospheric nitrogen into ammonia by bacteria
2. Nitrification: Ammonia is converted into nitrite and then nitrate by bacteria
3. Assimilation: Plants absorb nitrate or ammonium to make amino acids and other organic compounds
4. Ammonification: Decomposers break down organic compounds into ammonium
5. Denitrification: Conversion of nitrates back to atmospheric nitrogen by bacteria in anaerobic conditions.
\

69
New cards
culling
control of wild animal populations through selective slaughter (biotic factor)