1.1.4 Production possibility frontiers
1/21
There's no tags or description
Looks like no tags are added yet.
Name | Mastery | Learn | Test | Matching | Spaced | Call with Kai |
|---|
No study sessions yet.
22 Terms
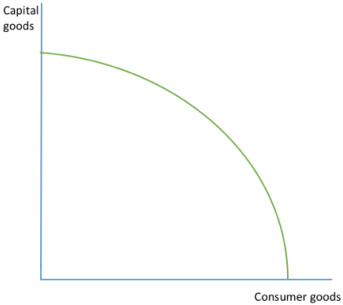
WHAT IS PPF
shows the maximum possible combinations of capital and consumer goods that the economy can produce with its current resources and technology
usually a curve- means that when you move down along the PPF, as more resources are allocated towards Good Y, then the extra output created gets smaller.
explained by the law of diminishing marginal returns- it occurs bc not all factor inputs are equally suited to producing different goods leading to lower productivity
MICROECONOMIC PPF
looks at 2 products- business may reallocate their factor inputs towards one product
this involves opportunity cost bc some output of the alternative good is sacrificed
MAX PRODUCTIVE POTENTIAL OF ECONOMY
any point on the curve represents the max productive potential of the economy, the most that country can produce
efficient allocation of resources
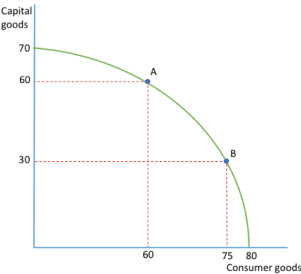
OPPORTUNITY COST THROUGH MARGINAL ANALYSIS (curve)
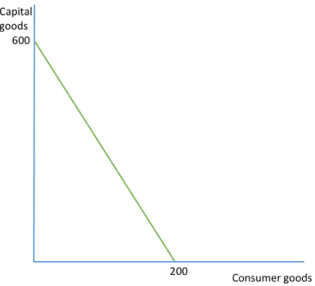
straight line PPF is an indication of perfect sustainability of capital and labour inputs
moving from A to B, the OC of producing an extra 15 consumer goods is 30 capital goods
producing 60 capital goods (point A) the OC would be 20 consumer goods
OPPORTUNITY COST THROUGH MARGINAL ANALYSIS (straight)
OC of producing 1 consumer good is 3 capital goods bc 600/200=3 (1 consumer good produced, 3 capital goods lost)
OC of producing 1 capital good is 1/3 of a consumer good
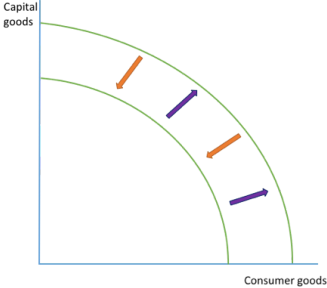
ECONOMIC GROWTH OR DECLINE
purple arrow show that the economy has grown bc it can produce more of both goods- growth may be achieved by increasing the quantity and/or quality of resources
orange arrow show the economy is declining as it can produce less goods than previously- could be cause by no. of factors: natural disasters, natural resources ran out, decrease in quantity/quality of labour (due to migration or fall in education
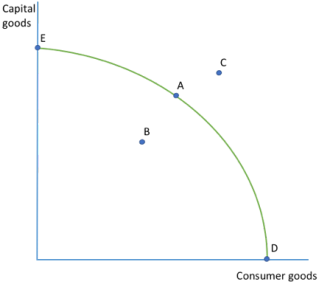
EFFICIENT OR INEFFICIENT ALLOCATION OF RESOURCES/ UNOBTAINABLE PRODUCTION
economic efficiency is achieved when resources are used for their best use.
economy will aim to produce on the curve(mainly A)- POSSIBLE AND EFFICIENT
B- POSSIBLE BUT INEFFICIENT, producing within the curve so not maximising output
C- UNOBTANAIBLE- beyond the PPF so not enough resources/ technology to produce
D and E are not likely- can only produce one good
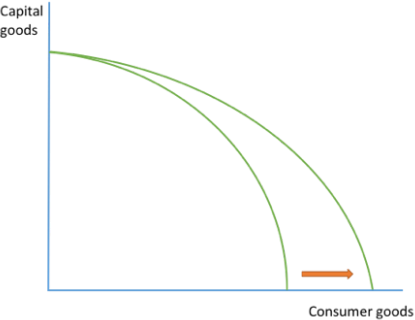
CHANGE IN PRODUCTION (efficient)
diagram shows increase in ability to produce consumer goods but not capital goods
could be due to an improvement in technology that makes production of consumer goods more efficient
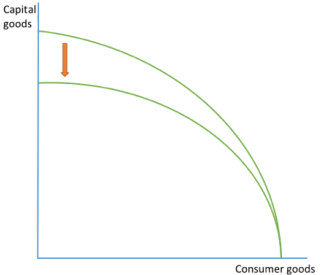
CHANGE IN PRODUCTION (inefficient)
diagram shows a fall in capital production but not in consumer production
shows a fall in efficiency or a change in resources that only affects capital good manufacture
PPF MOVEMENTS
movement along curve indicates a change in the combination of goods produced
more capital goods are produced and less consumer goods produced, or vice versa
same amount of resources allocated amongst the 2 goods efficiently
PPF SHIFTS
shift in curve indicates a change in the productive potential of the economy
more consumer and capital goods can be produced or less consumer and capital goods can be produced
there’s been a change in the no. of resources and/or the tech available to the country and so their potential output has changed
CAPITAL GOODS
Goods that are produced in order to aid the production of consumer goods in the future
Some goods can be both consumer and capital goods, for example computers
CONSUMER GOODS
Goods that are demanded and bought by households and individuals
INWARD SHIFT (L)
A long-term fall in productivity of labour perhaps due to a decline in the quality of machinery
INWARD SHIFT (M)
Large scale migration of people out of a country perhaps when there is high unemployment or a depression
INWARD SHIFT (N)
The damaging effects of severe natural disasters such as tsunamis, earthquakes, floods, persistent drought and other extreme weather events many of which are now directly linked to the impact of climate change
INWARD SHIFT (W)
The destruction caused by war and other types of conflict
OUTWARD SHIFT (L)
Discovery of new natural resources (land)
Discovery of commercially viable land drives higher extraction
OUTWARD SHIFT (I)
Innovation and invention of new products and resources
Improved production processes help to lift efficiency so that we can get more outfit from given inputs
OUTWARD SHIFT (S)
Increase in the stock of capital and labour supply
From inward labour migration/increased capital investment
OUTWARD SHIFT (E)
Higher productivity/efficiency of factor inputs
This increases the output per unit of an input used in production
OUTWARD SHIFT (M)
Better management of factor inputs
= Improved management reduces waste and improves quality